Thursday, May 26, 2022

Does a Single Troponin below the 99th percentile URL Rule out Acute MI if the Chest pain is very prolonged?

66 y.o. male who presented for chest pain that started this AM when he woke up, and has  persisted throughout the day prompting him to call 911. He says the pain is dull in nature and located across the chest, does not radiate, that it is worse with exhalation. He denies worsening with activity or positioning.  He endorses SOB and requested to sit up. He says this has not happened to him before. He endorses cough productive of yellow sputum.  He denies any edema. Denies history of venous thromboembolism.  He endorses a 50 pack year history of smoking. He denies recent illness or recent sick contacts. He denies fevers, sweats, chills, headache, dizziness, lightheadedness.

Here is his ED ECG:


Artifact.  Probable LVH.  No clear evidence of OMI or ischemia or reperfusion.
If this patient had brief pain that resolved, one might interpret the T-wave inversion in inferior leads as reperfusion.
However, when the pain is constant for 12 hours, and persistent, one must interpret them as entirely non-diagnostic.
And if the troponin is not elevated, it would prove them to not be due to ischemia.


I saw this patient and on my history, his pain had been present and constant for 12-36 hours.


We did an ED bedside cardiac ultrasound, which was normal.


After a single troponin returned "negative" at 8 ng/L (URL = 34 ng/L; Limit of Detection = 4 ng/L), I believed we had ruled out MI.


Here is the Assessment

  1. CBC, Chem, and dimer were all unremarkable 
  2. EKG was non ischemic
  3. Cardiac US was within normal limits 
  4. CXR showing posterior costophrenic angle interstitial opacities with atelectasis or infiltrates.  No distinct osseous abnormality.
  5. Given albuterol nebulization, with improvement. 
Impression: Bronchitis and Pneumonia
Treatment for asthma and pneumonia

Discharge home after a single "negative" troponin?
Is there data to support sending a patient home after prolonged constant chest pain, a non-ischemic ECG, and a single Abbott Architect troponin I that is ≥ 5 ng/L but below the URL (34 ng/L for men and 16 ng/L for women), which is the level required for a diagnosis of MI?

There is only one study of which I am aware that addressed this, and I published it 18 years ago (see below).  There are indeed studies of discharge after a single troponin and a low HEART score, but they do not reach a sensitivity of less than 1% for myocardial infarction.  

--This patient's HEART score was 3, so he would be eligible for discharge by such protocols. 
--His EDACS score is 14, with a non-ischemic ECG, so he would be eligible for discharge with 2 troponins below the URL. 

With constant pain lasting 12 hours prior to presentation, a single troponin should suffice, but other than my 18 year old study (again, see below), there is no data that I am aware of. 

On the other hand, we and others have shown that, if a patient presents with acute chest pain and has a troponin sample that is drawn at 6 hours (and especially 12 hours) after presentation and is below the 99% URL, that acute MI is ruled out with high sensitivity (see slide below).  

Because this is well known, we often extrapolate this data and apply it to patients who present with prolonged pain, and we frequently discharge such patients if a single initial troponin is below the URL and the ECG is non-ischemic.  We don't always get a 2nd troponin.  Of course this depends on the patient's symptom quality and risk factors as well.

Discharge with a low risk score and 2 troponins below the URL is definitely safe (NPV ≥ 99% for both acute MI and 30 day adverse events), by this study and by many others:  https://www.sciencedirect.com/science/article/abs/pii/S019606441731867X

Smith SW. Tibbles C.  Apple FS.  Outcome of low risk patients discharged home after a normal cardiac troponin I.  Published 18 years ago based on a very insensitive troponin, but there were very few adverse events.


Case Continued

The next day:

The patient returned in respiratory failure and cardiogenic shock!

ECG:
I interpreted this as subacute LAD Occlusion.
In other words:
It appeared as if I had sent a patient home who had unstable angina and it had progressed to acute anterior STEMI/OMI!!


He required intubation.
The cath lab was activated.
We did a bedside ultrasound: The left ventricular ejection fraction appears: severely reduced in function when compared to LV function yesterday on ED POCUS


The first troponin returned at 4000 ng/L, consistent with subacute OMI.


I was distraught.


Angiogram:


Normal


Diagnosis: Takotsubo, probably due to pneumonia.


So it was not acute coronary syndrome at all.  I had not sent ACS home.  Phew!


Formal echo day 3:


Mildly enlarged left ventricle with severely reduced systolic function. Estimated ejection fraction 21%.

Severe hypokinesis to akinesis of the mid and apical left ventricle in all segments with best preserved function in the basal inferolateral wall.


Day 4 ECG:


Now with T-wave inversions


Day 6


Echo recovery with EF 45%


Learning Points:


1. Takotsubo mimics LAD Occlusion

2. Otherwise, I'm not certain!  Except to say that this case is not a counterexample for sending a patient home who has had pre-arrival chest pain for 12 hours and a single troponin that is measurable but below the URL.


===================================
Comment by KEN GRAUER, MD (5/27/2022):
===================================
Interesting case — with the important clinical question posed as to how effective a single troponin value can be for ruling out infarction when chest pain is prolonged. In the interest of academic discussion — I focus my comment on a few specific aspects regarding the ECGs in today's case.
  • For clarity in Figure-1 — I've reproduced the first 2 tracings in today's case.

Regarding ECG #1:
The initial ECG in the ED clearly does not show evidence of acute OMI (Occlusion-based MI). That said, in the context of a 66-year old man with a history of chest pain persistent for the previous 12-to-36 hours — I thought there are some findings worthy of note on ECG #1:
  • There is a large amount of artifact, especially in the limb leads.
  • The rhythm in ECG #1 is sinus. The axis is leftward, consistent with LAHB (Left Anterior HemiBlock).
  • QRS amplitude in a number of chest leads is significantly increased — consistent with voltage for LVH (based on the very deep S in V3 >25 mm — and the tall R in V5).
  • Although difficult to assess because of limb lead artifact — T waves appear to be negative in all inferior leads (RED outlining in these leads). Whether this is in response to predominant negativity of the QRS in these leads — or whether it reflects some element of ischemia is uncertain from this artifact-marred picture.
  • QS complex is seen in leads V1 and V2 — and no more than a tiny r wave is seen in lead V3. Whether this poor R wave progression is the result of LAHB (which results in unopposed posterior forces initially) — or — the result of LVH (which may produce prominent posterior forces with loss of anterior r wave amplitude) — or — anterior infarction at some point in time — is uncertain from this single tracing.
  • I found it a bit unusual for the ST-T waves in leads V1,V2,V3 to be nearly flat — especially in view of probable LVH that typically produces a definitely upright (if not slightly elevated) ST-T wave in anterior leads as a manifestation of LV "strain" when there are deep anterior S waves. Could this be pseudo-normalization?

  • To EMPHASIZE: This initial ECG #1 is not suggestive of acute OMI. But in a 66-year old man with risk factors and a concerning history — I thought the above ECG findings opened some questions. In view of the importance of this tracing in the decision-making process — and in view of all the limb lead artifact — I would have repeated the tracing.

Take Another LOOK at ECG #2:
  • Why might the frontal plane axis in ECG #2 be so different than it was the day before in ECG #1?

Figure-1: The first 2 tracings in today's case.


ANSWER:
The reason the frontal plane axis in ECG #2 is so different from the axis in ECG #1 — is that there is LA-LLead Reversal in ECG #2! For clarity in Figure-2 — I show what the limb leads in ECG #2 should look like if the extremity electrode leads were correctly placed.
  • The tipoff to LA-LL Reversal in ECG #2 — is that the P wave in lead I is clearly larger than the P wave in lead II (and that is distinctly unusual when there is sinus rhythm).
  • The other "tipoff" that something is amiss — is the marked right axis in ECG #2, that of itself is unusual outside of the context of RVH. Lead-to-lead comparison of ECG #1 with ECG #2 shows a dramatic shift from a leftward axis — to a rightward axis over the course of 1 day. That rarely happens.

  • P.S. — In the July 28, 2020 post in Dr. Smith’s ECG Blog — I cited my favorite on-line “Quick GO-TO” reference for the most common types of lead misplacement, which comes from LITFL ( = Life-In-The-Fast-Lane). Simply put in, “LITFL Lead Reversal” into the Search bar — and the link comes up instantly!

And IF We Account for Correction of Lead Placement in ECG #2:
Note ECG #2a in Figure-2 — now shows: i) Return of the leftward axis (LAHB); ii) A sinus P wave in lead II that is taller than the P wave in lead I (as should be the case with sinus rhythm); andiii) ST coving and T wave inversion in the inferior (instead of high lateral) leads.

Figure-2: Showing the effects of LA-LL Lead Reversal (See text).


Final Comparison — Of ECG #2a and ECG #3:
Use the corrected version of ECG #2 ( = ECG #2a) — it now makes more sense when we compare the last 2 tracings in today's case (Figure-3):
  • There is no significant difference in heart rate or frontal plane axis between ECG #2a and ECG #3.
  • There may be slight change in chest electrode lead placement (ie, the S wave in lead V2 is much deeper in ECG #2a compared to ECG #3). That said — this difference is unlikely to alter our overall assessment of these 2 tracings.
  • The overall "shape" of ST-T waves is similar in most leads — with the main difference being some improvement in ECG #3, which was done 2 days after ECG #2a.

As per Dr. Smith — the final diagnosis that accounts for the dramatic ECG changes seen beginning with the 2nd ECG in today's case was Takotsubo Cardiomyopathy. Findings consistent with this diagnosis (seen in Figure-3) include sinus tachycardia — the long QT — diffuse ST-T wave abnormalities without anatomic localization.
  • For review of the ECG findings seen with Takotsubo Cardiomyopathy — Please check out My Comment at the bottom of the page in the March 25, 2020 post in Dr. Smiths Blog.

Figure-3: Comparison of the 2nd and 3rd tracings in today's case (accounting for what ECG #2 would look like if leads were correctly placed).


Wednesday, May 25, 2022

Back to the basics. An elderly man with chest pain, no STEMI criteria, and troponin within normal limits. What does his ECG mean?

Written by Pendell Meyers


An elderly man with history of CAD presented to the ED with acute chest tightness and diaphoresis beginning 30 minutes prior to arrival. He was noted to be bradycardic and hypertensive on arrival. 


ECG#1 at ~1245
What do you think?


Baseline 2 years prior was available:


The ECG is diagnostic of inferoposterior OMI. Of course, however, it does not meet STEMI criteria, even though it is one of the easiest ones we've posted in quite a while. There is approximately 1.0 mm of STE in lead III, but only ~0.5 mm in II and aVF. There are very hyperacute T waves in II, III, and aVF. Reciprocal negative hyperacute T wave in aVL. Clear posterior OMI seen by the very specific ST depression maximal in V2. After comparing to the baseline ECG, we can also see that leads V5 and V6 also have increased area under the T waves, concerning also for lateral involvement.


Wisely, the treating physician chose to overrule the STEMI guidelines and activate the cath lab despite the ECG not meeting STEMI criteria.


The initial high sensitivity troponin I was 9 ng/L at ~1300 (this is within the 99% upper reference limit for men at 20 ng/L!).


Cath at ~1430:

prox RCA occlusion, stented
mid RCA occlusion, stented
scattered other CAD


ECG#2 at ~1545
Interval improvement in inferior leads, and posterior reperfusion T waves, all signaling successful reperfusion.


Troponin was 13,125ng/L at ~1600, then rose to greater than 25,000 at ~18:30 and several more measurements


ECG#3 at ~2000


ECG#4 next AM
Further ECG evolution of reperfusion.


Next AM echo:

EF 59%, hypokinesis of the basal inferior myocardium. 


2 weeks later:

Still further evolution

See how this case beautifully demonstrates the OMI and reperfusion ECG sequences:


He was discharged in good condition.


Learning Points:

This patient got optimal care only by violating the current STEMI guidelines and diagnosing OMI despite lack of STEMI criteria.

You must be able to see hyperacute T waves to diagnose OMI accurately.

Reciprocally inverted hyperacute T-waves in aVL are a reliable sign of inferior OMI.

ECGs during OMI and reperfusion usually follow the OMI paradigm ECG sequences. Learning this progression allows you to understand the state of the artery, diagnose OMI sooner than STEMI criteria, etc.


===================================
Comment by KEN GRAUER, MD (5/25/2022):
===================================
As per Dr. Meyers — today's case goes "back to basics" in terms of illustrating the typical ECG evolution of acute coronary occlusion, followed by reperfusion changes.
  • I focus my comments on a number of different aspects relevant to the interpretation of the first 3 ECGs shown by Dr. Meyers in today's case.

The Initial ECG in Today's Case: 
As per Dr. Meyers — the patient in today's case was an elderly man with known coronary disease, who presented to the ED with new-onset and typical cardiac chest pain that began 30 minutes earlier.
  • With this presenting history — we essentially need to be looking at the initial ECG thinking this patient is likely to be having an acute cardiac event until we can prove otherwise.
  • As per the sequential Figure shown above by Dr. Meyers that illustrates the ECG evolution of acute coronary occlusion and reperfusion — the hyperacute T wave stage typically occurs before the stage of ST elevation.

  • Even before seeing the baseline tracing ( = ECG #2 in Figure-1) — it should be obvious that T waves in the inferior and lateral chest leads are disproportionately peaked and "hypervoluminous" (especially in leads III and aVF) with respect to R wave dimensions of the QRS complex in respective leads. The reciprocally-inverted hyperacute T wave in lead aVL confirms the diagnosis of acute inferior OMI. Waiting until ST segments elevate would only delay the inevitable at the cost of valuable myocardium.

The ST-T wave in Leads V2, V3 of ECG #1:
I thought the appearance of the ST-T waves in leads V2 and V3 of ECG #1 may have been a bit "out of synch" from the hyperacute T waves in the inferior and lateral chest leads.
  • As I've alluded to in multiple posts in Dr. Smith's ECG Blog — I favor the Mirror Test as a visual aid for facilitating recognition of the acute ST-T wave changes of acute posterior MI as they are seen in the anterior leads (See My Comment in the January 3, 2022 post). Typically — a shelf-like shape of ST-T wave depression is initially seen in one or more anterior leads, with no more than modest terminal T wave positivity.
  • Instead, in ECG #1 — there is virtually no ST depression in leads V2 and V3. I thought the T wave in lead V3 was disproportionately positive — and the terminal T wave positivity in lead V2 was more than expected. 

  • My Impression of ECG #1: I completely agree with Dr. Meyers that the acute inferior OMI in the initial ECG in today's case was obvious. But I thought the ST-T wave appearance of leads V2V3 in ECG #1 already suggested posterior reperfusion T waves (in which anterior ST depression resolves — and anterior T waves become taller and more peaked).
  • I thought the mirror-image view of leads V2,V3 in ECG #1 supported my impression (RED inserts of inverted leads V2,V3 showing beginning T wave inversion in V2 — and deep, symmetric T wave inversion in lead V3).
  • In further support that this ST-T wave appearance in leads V2,V3 of ECG #1 represented early reperfusion changes before this was seen in other areas of the heart — is the change compared to the baseline ECG from 2 years earlier — and — the further progression of anterior T wave peaking seen in ECG #3, that was done 3 hours after ECG #1 (See the comparison between ECG #1 and ECG #3 in Figure-2 below).

  • We can only speculate on the reason as to why the posterior wall might show reperfusion T waves at the same time that inferior and lateral chest leads show the hyperacute T waves of acute occlusion. Perhaps this is related to the 2 distinct RCA lesions? (noted proximally and mid-vessel on cath) — or perhaps due to multi-vessel disease? (which was also noted on cath).

Take another LOOK at ECG #2:
  • WHY in ECG #2 is QRS morphology changing for beats #1 and 2 in lead III — and for beats #3,4,5 in lead aVF?
Figure-1: Comparison of the initial ECG in today's case — with a baseline tracing done 2 years earlier. RED inserts in ECG #1 show the Mirror Test applied to leads V2 and V3.


ANSWER:
Isn't there is a fairly marked change from beat-to-beat in QRS morphology that is seen in leads III and aVF of ECG #2?
  • This is a phenomenon that I have occasionally observed over the years, that in my experience is unique to these 2 leads. I believe the reason for this phenomenon — is that the heart sits on the diaphragm, and these 2 inferior leads (leads III and aVF) view the heart's electrical activity from a perspective directly below this. As a result — these leads are sometimes subject to beat-to-beat variation in QRST morphology as a result of diaphragmatic motion associated with accentuated breathing. I have not observed this phenomenon in other leads.
  • Awareness of this phenomenon is important — because of the potentially confounding effect it may have on assessing acute changes in the inferior leads. On occasion — a longer lead sample of leads III and aVF may be needed to determine the "true" QRST morphology in these 2 leads.


Take another LOOK at ECG #3 (which I have reproduced in Figure-2):
As discussed above by Dr. Meyers — ECG #3 showed improvement of the hyperacute T waves in the inferior and lateral chest leads — as well as increased amplitude and peaking of anterior T waves — all signaling successful reperfusion!


QUESTION:
  • What is the rhythm in ECG #3?

Figure-2: Comparison of the initial ECG in today's case — with ECG #3 (done post-Cath — which was ~3 hours after ECG #1).


ANSWER regarding the Rhythm:
Isn't there group beating in the long lead II of ECG #3?
  • Clearly there is a marked sinus bradycardia in the long lead II rhythm strip of ECG #3But isn't there also alternating longer-then-shorter R-R intervals? The duration of each of these longer R-R intervals (ie, between beats #1-2; 3-4; and 5-6) is virtually equal — and — duration of each of these shorter R-R intervals (ie, between beats #2-3; 4-5; and 6-7) is also virtually equal. Isn't this more than what you would expect by chance? This is not the typical phasic variation of R-R intervals over a longer series of beats that is expected with sinus arrhythmia.

  • I strongly suspect that the rhythm in Figure-2 represents 3:2 SA block. The clinical setting for this uncommon form of conduction disturbance is present in today's case (ie, an elderly man, therefore more susceptible to Sick Sinus Syndrome — who presents with acute inferior infarction).

  • SA Block is not common. I count on my fingers and toes the number of times I've seen true SA block over my decades of looking for this rhythm disorder. But as per my proposed laddergram in Figure-3 — I believe this a possible (if not probable) diagnosis for the bradycardia and group beating that we see in the long lead II of ECG #2.

  • I've excerpted the essentials of SA block from my ACLS-2013-ePub in Figure-4.


Figure-3: My proposed laddergram for the rhythm in ECG #3.


Figure-4: Essentials of SA Block (Modified from Grauer: ACLS-2013-ePub).


Tuesday, May 24, 2022

A 30-something with Chest pain, elevated troponin, with Subtle ST Elevation and hyperacute T-waves.

A 30-something male presented in the middle of the night with several hours of sharp, non-radiating, left sided chest pain.  It was there earlier, went away, and then returned approximately 1 hour prior to arrival. He is a smoker and has some family history of early MI.  

Exam and vital signs were normal.

Here was the triage ECG:

There appears to be diffuse ST Elevation (II, III, aVF with reciprocal STD in aVL, V3-V6, and lead I, with T-waves that appear to be hyperacute (broad and fat, but on the other hand they have no straightening of the ST segment).  
ST depression and T-wave inversion in V2 suggests posterior OMI.
This is highly suggestive of acute OMI.


Providers were not convinced that this was OMI, so they awaited the first troponin.  The initial high sensitivity troponin I returned 68 minutes after this ECG at 3900 ng/L (quite high, consistent with OMI, NOMI, or other etiology of acute myocardial injury).

Given the young age, they were also suspicious of myocarditis, and ordered a CRP.

The Cath lab was activated.  Here is the report:

Cath lab activation at 3 am by the ED for atypical CP, and elevated troponin with diffuse STT changes.  No angiographically significant obstructive coronary artery disease .

Peak trop at 7 hours was 4646 ng/L

CRP 88 (very high)


Formal Echo the next day:

The estimated left ventricular ejection fraction is 49%.


Cardiac MRI

1) Borderline decreased LV function with small wall motion abnormality involving the apex 

2) Normal dimensions of all cardiac chambers 

3) Patchy areas of myocardial edema. There is also patchy myocardial delayed enhancement with subendocardial sparing, involving the distal anterior wall, distal inferolateral wall and the basal inferior wall. 

Pattern is consistent with acute myocarditis. 

4) Trace pericardial effusion. 

After the fact, this further history was obtained:  

Of note, one week ago he was ill with nausea, vomiting, and diarrhea. He has noticed fevers and chills as well.

Subsequent ECGs??  I would love to have seen the evolution of the ECGs over days to weeks, but unfortunately, no more were recorded.

Learning points:

Sometimes there are false positive ECGs, or at least a clinical scenario and ECG combination that forces an angiogram.  How could such a false positive activation be avoided?  

That is very difficult, because the delays inherent in confirming or rebutting the diagnosis of OMI take a lot of time, and time is myocardium.  

Cases like this are NOT common, and so will not lead to a flood of unnecessary angiograms.  

If suspicion of Non-OMI etiology is high, then emergent formal bubble contrast echo is very useful, but in myocarditis, it usually reveals a wall motion abnormality.

CT coronary angiogram is excellent, but is rarely available outside of business hours, and hardly ever at night.

The initial troponin is often negative in OMI, and even if it were useful, the mean time from presentation to sample collection in MI studies is about 50 minutes, and the time from collection to central laboratory result is at least 30 minutes.  Although the POC troponins that are available at the present time are very inaccurate in the low range and not appropriate for rule out, they can be useful in confirming acute MI (OMI or NOMI) if elevated.   

But they do NOT differentiate between OMI and myocarditis!!

Bottom line: if you don't want to miss OMI, with its attendant significant myocardial loss, then some false positive angiograms are a reasonable price to pay.

See this case:

A Young Woman with Chest Pressure and Subtle, Focal ST Elevation and Depression


===================================

MY Comment by KEN GRAUER, MD (5/24/2022):

===================================

Insightful case presented above by Dr. Smith! I focus my comment on the fact that the initial ECG in this case manifests LA-LLead Reversal. For clarity — I have reproduced the initial ECG in today's case — and placed what this ECG should look like if the extremity electrode leads were corrected placed (Figure-1). 

Figure-1: Showing the effects of LA-LL Lead Reversal (See text).


It's EASY to overlook lead misplacement — because we do not encounter this entity very often. I highlight this problem in the July 28, 2020 post in Dr. Smith's ECG Blog — in which I include a Table, LINKS to other of our blog posts with examples of lead reversal — and a number of Pearls to facilitate recognizing when the leads are "off".
  • By far — the most common lead reversal is mix-up of the LA (Left Armand RA (Right Arm) electrodes. But this is not the mix-up that occurred in today’s case — because we do not see global negativity (of P wave, QRS and T wave) in lead I (See the February 11, 2020 post).

  • In the July 28, 2020 post in Dr. Smith’s ECG Blog — I cited my favorite on-line “Quick GO-TO” reference for the most common types of lead misplacement, which comes from LITFL ( = Life-In-The-Fast-Lane). Simply put in, “LITFL Lead Reversal” into the Search bar — and the link comes up instantly!

  • The tipoff to LA-LL Reversal in Figure-1 — is that the P wave in lead I is clearly larger than the P wave in lead II (and that is distinctly unusual when there is sinus rhythm).
  • The other, more subtle "tipoff" to LA-LL Reversal — is that in the context of what appears to be hyperacute ST-T waves with predominantly positive QRS complexes in leads I and II — the predominantly negative QRS, which also manifests some ST elevation in lead III just looked "off".

I've become extremely good at recognizing the most common form of LA-RA Lead Reversal — because the global negativity of P wave, QRS complex and T wave that this produces in lead I is never a "normal" finding. I still find it easy to overlook the less common forms of lead reversal — such as the LA-LL Reversal in today's case.
  • Take-Home Message: Remember that with normal sinus rhythm — it is rare indeed that the P wave in lead I will be larger than the P wave in lead II. Next time you see this — Enter "LITFL Lead Reversal" into your internet search bar to remind yourself of what you'll see with the common types of lead reversal.
  • P.S.: For another example of LA-LL Lead Reversal like the one in today's case — Go to the Addendum at the bottom of the page in the August 28, 2020 post in Dr. Smith's ECG Blog. I initially missed that one ...

Monday, May 23, 2022

Inferior ST elevation with reciprocal change: which of these 4 patients has Occlusion MI?

Written by Jesse McLaren, with comments by Smith and Grauer


Four patients presented with cardiorespiratory symptoms, with inferior ST elevation and reciprocal change on their ECG. Which patient had occlusion MI? 


Note: according to the STEMI paradigm these ECGs are easy, but in reality they are difficult.


First let’s start with each ECG without clinical context. What do you think of each ECG?


ECG 1:


ECG 2:


ECG 3:


ECG 4:


Now let’s introduce some clinical context. How would this change management?


Patient 1: 30 year old previously healthy, presenting with syncope, now asymptomatic with normal vitals


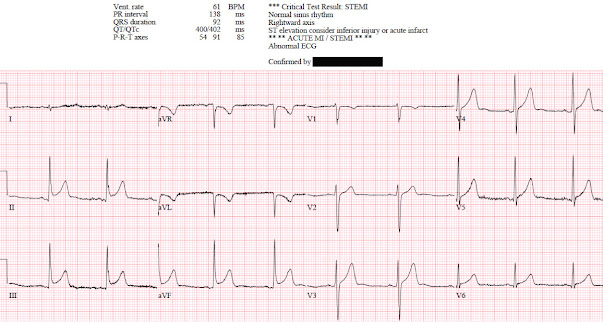
ECG: normal sinus rhythm, normal conduction, vertical axis, normal R wave progression, no hypertrophy. There’s inferior STE which meets STEMI criteria, but this is in the context of tall R waves (18mm) and relatively small T waves, and the STD/TWI in aVL is concordant to the negative QRS. I sent the ECG to Dr. Smith without any clinical context and he replied: "not OMI" because it looks so much like normal variant.


Because the patient was asymptomatic the emergency physician didn’t activate the cath lab but got a stat cardiology consult. The patient had serial ECGs that were unchanged, serial high sensitivity troponin I were undetectable, an echo was normal, and the patient was discharged with a diagnosis of vasovagal syncope and a copy of their ECG for future ED visits. So this ECG false positive STEMI, which could be recognized by expert interpretation.


Smith: The fact that the ECG did not evolve is further proof that this was the baseline ECG. 


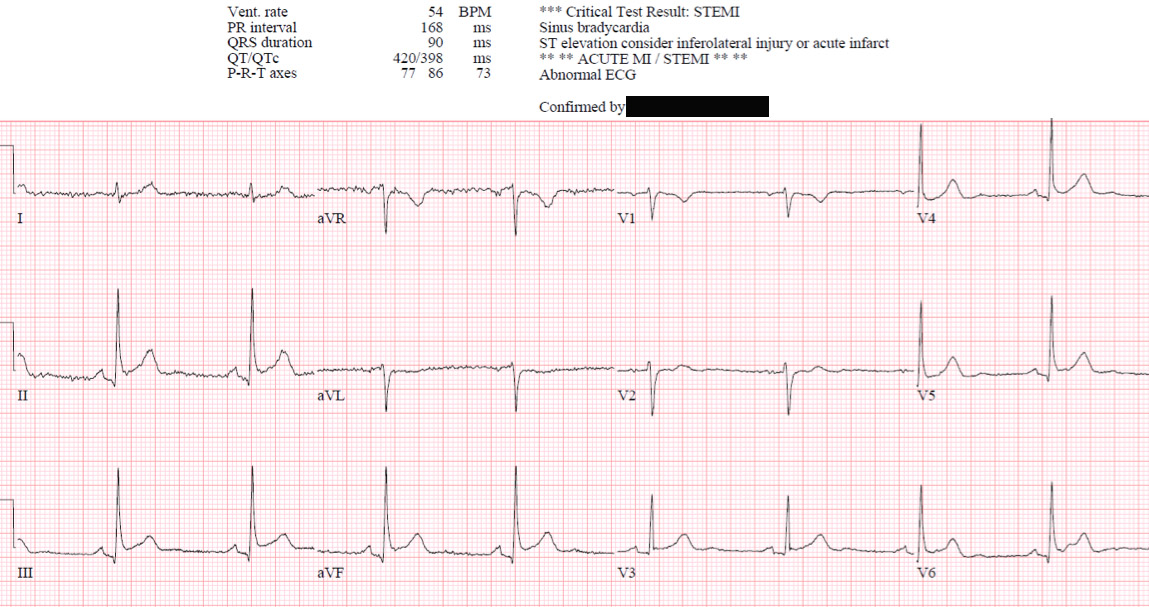
Patient 2: 55 year old with 5 hours of chest pain radiating to the shoulder, with nausea and shortness of breath
 

ECG: sinus bradycardia, normal conduction, normal axis, normal R wave progression, no hypertrophy. There’s inferior STE in the context of large R waves and relatively small T waves, and the STD in aVL is concordant to the QRS complex (i.e. nearly identical to the first case). I sent the ECG to Dr. Smith without any clinical context and he replied: “not OMI”.


But as he emphasizes, OMI is a clinical diagnosis that does not depend on the ECG. The patient presented with classic symptoms of acute coronary occlusion, which may or may not register on the ECG. Because of the symptoms and ECG the cath lab was activated: 95% distal RCA occlusion, with an initial troponin I of 200 ng/L (normal <16 in females and <26 in males) 
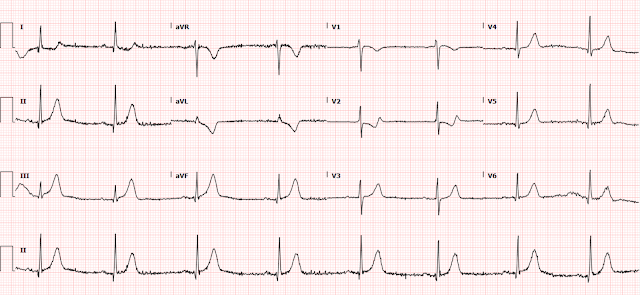
and peak of 13,000. On discharge ECG there is still mild inferior STE but now reperfusion T wave inversion.


The discharge diagnosis was “STEMI” but the ECG could have been false positive STEMI. On the other hand, OMI is a clinical diagnosis, and while the ECG was not diagnostic the patient had ischemic chest pain and OMI was confirmed based on angiography, peak troponin and reperfusion T wave inversion.  


Smith: The fact that the ECG evolved shows that, in this case, the initial ECG which appeared to be normal variant really was due to OMI.


Patient 3: 40 year old with two days of intermittent chest pain which was both exertional and pleuritic


ECG: normal sinus rhythm, normal conduction, normal axis, normal R wave progression, no hypertrophy. There’s inferolateral STE in the context of normal voltages (5-8mm tall), inferior T waves are pointy but large relative to the QRS (as big as the entire QRS in III), and the STD/TWI in aVL is discordant to its QRS. I sent this to Dr. Smith without any clinical information and he replied: “OMI”.


The patient had the cath lab activated but had normal coronaries. First Troponin I was <2 and peak was 8, echo showed subtle apical lateral hypokinesis, CRP was elevated, and patient was discharged with a diagnosis of regional pericarditis. There are no prior or follow up ECGs available. This was false positive STEMI with an ECG mimicking OMI.


Smith: The normal coronaries and negative troponins prove that this was indeed "Not OMI."  In this case, there would be evolution, but the evolution would be typical of pericarditis (if the diagnosis of pericarditis was accurate!!  Many cases pericarditis are really normal variant, but this ECG does not mimic normal variant, so I am quite certain that this really was pericarditis.)


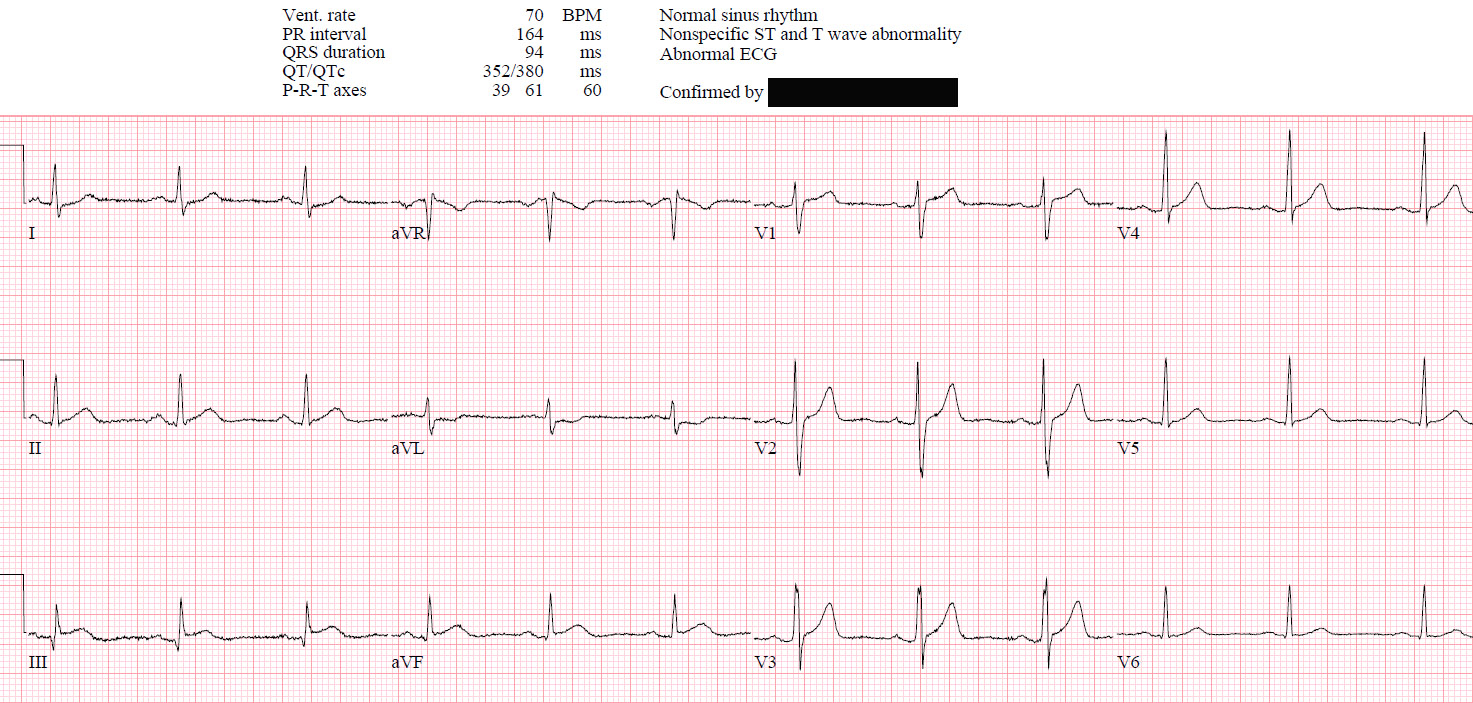
Patient 4: 35 year old with one hour of chest pain radiating to the left arm, with shortness of breath, nausea and diaphoresis 
  

ECG: normal sinus rhythm, normal conduction, normal axis, normal R wave progression, no hypertrophy. There’s inferior STE in the context of normal voltages, with straightening of ST segments and STD in aVL which is discordant to its QRS. I sent this to Dr. Smith without any information and he replied, “OMI.”


This was missed by the treating physician, but the chest pain resolved with aspirin. First troponin I was 7ng/L and repeat was 300. Repeat ECG:


Resolution of STE and reciprocal change, indicating reperfusion and correlating with resolution of pain. 


The patient was referred to cardiology as NSTEMI but had another brief episode of chest pain. As the cardiologist noted, "ECG demonstrated subtle inferior ST segment elevation which normalized and then recurred with further chest discomfort. Code STEMI was called." This repeat ECG is not available in the chart, but sounds similar to the presenting ECG, and it was excellent care that the code "STEMI" was activated despite no evidence of STEMI criteria. The pain resolved again before cath, which found a 80% RCA occlusion. Troponin was 2,000 before cath but no subsequent troponin were done. Discharge ECG showed new Q wave and reperfusion TWI in III:


Because the patient had the cath lab activated and received a stent, the discharge diagnosis was “STEMI” even though none of their ECGs met STEMI criteria. This was STEMI(-)OMI.


Smith: in this case, the angiogram and the troponin confirm acute MI (OMI or NOMI), but the evidence that the ECG findings are indicative of OMI is the evolution.  The peak troponin did not meet our research definition of OMI (Peak high sensitivity troponin I > 10,000 ng/L, but this is only because there was such rapid reperfusion, with resolution of symptoms.


Inferior STE and reciprocal change


As Dr. Meyers has explained in a previous post on inferior STE and reciprocal change in aVL:

Any time there is focal STE in the inferior leads for any reason (whether it is due to acute inferior wall OMI, or whether it is a baseline ECG finding), there MUST BE reciprocal STD in aVL. The fact that there is STD/TWI in aVL does not make the STE in the inferior leads specific for active OMI, it just means that the STE in the inferior leads is indeed focal. If it were diffuse STE on all walls of the LV, it would be very unlikely to have STD in aVL. Also remember that Dr. Smith's study on STE in the inferior leads and STD/TWI in aVL was only comparing patients with inferior OMI against patients with pericarditis. Normal variants and other reasons for STE in the inferior leads were not in that comparison.” 


This was in reference to this study: primary ST depression in aVL (ie. Not secondary to LBBB, LVH, or WPW) is 99% sensitive for inferior OMI, and 100% specific for differentiating inferior STEMI from pericarditis (but not 100% specific for OMI).


Similarly, these 4 cases all have inferior STE with reciprocal STD in aVL, but the question is why—including early repolarization/normal variant, inferior OMI, or myocarditis/focal pericarditis (diagnosis of exclusion). The STEMI paradigm can’t differentiate between these, and leads to false positives (case 1) as well as false negatives (case 4), both of which could be identified by expert interpretation. The other cases show that in the OMI paradigm the ECG is but one datapoint: you can have clinical OMI without diagnostic ECG (case 2), or OMI ECG mimics that are only ruled out after angiography (case 3).


Take home

1. The STEMI dichotomy leads to false positives and false negatives and puts the focus exclusively on the ECG, while the OMI paradigm can differentiate subtle occlusions from mimics while putting the ECG in the context of the patient.    

2. Primary reciprocal STD in aVL is highly sensitive for inferior OMI (far better than STEMI criteria) and excludes pericarditis, but is not specific for OMI

3.  Normal variant STE can mimic STEMI but has tall R waves and relatively small STE and T waves; TWI in aVL can be normal if concordant to an inverted QRS (eg in vertical axis)

4. Myocarditis and regional pericarditis are retrospective diagnoses of exclusion after a normal angiogram


===================================

MY Comment by KEN GRAUER, MD (5/23/2022):

===================================

Today's post by Dr. McLaren is a perfect follow-up for the May 11, 2022 post by Dr. Meyers, in which Dr. Meyers asked us to identify which of the 5 tracings he showed were suggestive of acute OMI.

In today's post — Dr. McLaren puts us to a similar challenge, namely to identify which of the 4 tracings he shows with inferior lead ST elevation are suggestive of acute OMI?

  • I picked 2 of the 4 Cases to comment on. For clarity — I've put these 2 tracings together in Figure-1.
  • Once again — We were initially shown these tracings without the benefit of any history. Dr. McLaren then filled us in on the clinical setting — and on "the Answers" to this clinical question.

Figure-1: I've reproduced ECG #1 and ECG #2 from today's post.


Looking First at ECG #1:
My purpose in commenting on ECG #1 is twofold: i) As per Dr. McLaren — this ECG manifests typical features of ERP (Early Repolarization Pattern)andii) Once you feel comfortable identifying this tracing as suggestive of ERP (and not suggestive of acute OMI) — the important Question then becomes, "What do you do for a young patient who presents to an ED for syncope with an ECG that clearly shows Early Repolarization?"
  • ECG findings of a repolarization variant that ECG #1 shows include upward-sloping ("smiley"-configuration) ST segment elevation in multiple leads (especially in the inferior leads — but also to a lesser extent in leads V3-thru-V6).
  • No J-point notching — but slurring of the downslope of the R wave in 2 contiguous leads (ie, in leads II and III — as shown by the PURPLE arrows that mark the point of onset of this slurring).

  • Against acute OMI are: i) Excellent R wave progression (with an R wave amplitude over 10 mm by lead V3); ii) A relatively short-normal QTc interval; andiii) Absence of reciprocal ST depression, in the presence of similar-looking peaked T waves of normal amplitude in no less than 8 leads (II,III,aVF; and V2-thru-V6) — whereas the ECG of an acute OMI is much more likely to localize.
  • To emphasize — the inverted T wave in lead aVL of ECG #1 "looks" benign — since the T wave vector often follows close behind the QRS vector (ie, the negative T wave in lead aVL "follows" the negative QRS in this lead) — AND — the shape of this inverted T wave peak looks comparable to the shape of the T wave peak in those leads in which the T wave is positive.

  • BOTTOM Line: The history in this young adult was syncope and not chest pain — so there is a "lower prevalence likelihood" by history for acute OMI. In view of this lower prevalence likelihood for acute OMI — the above description is my best attempt at explaining why my brain immediately recognized the pattern in ECG #1 as a non-OMI repolarization variant.

  • QUESTION: But what about the history of syncope that brought this patient to the ED? (See below).


What About ECG #2?
I did not know the history when I first saw ECG #2. After looking at this tracing — I was not at all comfortable ruling out acute OMI from this ECG alone.
  • The small and narrow q waves in inferolateral leads looked like "normal septal q waves" (which can be seen as a normal finding not only in lateral leads — but also in inferior leads when the frontal plane axis is vertical, as it is in ECG #2).
  • I thought the ST segment elevation in each of the inferior leads of ECG #2 looked similar to the inferior lead ST elevation in ECG #1
  • That said — I thought the flat ST segment, with a hint of ST depression in lead aVL was different than the negatively peaked T wave inversion in lead aVL of ECG #1. I thought this to be a nonspecific sign — but it did make me question IF the shape of the ST segment in lead aVL of ECG #2 might reflect a less typical, but nevertheless reciprocal change.

  • The KEY finding that I thought was definitely abnormal in ECG #2 — was the straightened ST segment in lead V2 (RED line in Figure-1). Normally — there should be a gradual upsloping of the ST segment, usually with at least slight ST elevation in lead V2.
  • I was less sure of what to make of the 0.5-to-1.0 mm ST elevation in leads V3-thru-V6.
  • And then there was the history in this 55-year old patient — which was 5 hours of radiating chest pain associated with nausea and dyspnea.

  • BOTTOM Line regarding ECG #2: I was concerned about the appearance of ECG #2 before I knew the history. Once the history was revealed — I interpreted this case as one in which acute OMI needed to be ruled out (rather than the other way around) — because: i) There was 1-1.5 mm of ST elevation in each of the inferior leads — with a straightened and slightly depressed ST segment in lead aVL that I thought could reflect a reciprocal change; ii) Lead V2 showed definite abnormal ST flattening (instead of an upsloping ST segment with slight elevation) — which I interpreted as possible (if not probable) indication of posterior wall involvement; iii) There was slight-but-real ST elevation in leads V3-thru-V6 of uncertain etiology; and, iv) This 55-year old patient presented with a classic history of acute cardiac chest pain.


What To Do with a Young Adult who presents with Syncope and ERP?
Once we can become comfortable that ECG #1 is not suggestive of acute OMI — we need to address the question of, "What do you do for a young adult patient who presents to an ED for syncope with an ECG that clearly shows Early Repolarization?"
  • The problem is the very small-but-present percentage of lethal cardiac arrhythmic events in otherwise healthy young adult individuals who have repolarization variants. As a result — I no longer use the term "BER" (Benign Early Repolarization) when I encounter the type of ECG finding seen in ECG #1 of today's case (Zakka & Refaat-ACC-2016). Instead, I favor calling this a "repolarization variant" — with awareness that this ECG finding is usually but unfortunately not always 100% "benign".

Distinction is made between:
  • ERP (Early Repolarization "Pattern") — in which the ECG findings of early repolarization are seen in the absence of symptomatic arrhythmias. 
  • ERS (Early Repolarization "Syndrome") — in which early repolarization ECG findings are seen in a patient with a history of PMVT (PolyMorphic VT) or resuscitated idiopathic VT/VFib.

  • NOTE: Early repolarization is included among the "J Wave Syndromes" (JWS) — which are a phenotypic spectrum of disorders including individuals with ERS, Brugada Syndrome — and/or — malignant arrhythmias linked to STEMIs or the J-point accentuation (Osborn wave) of hypothermia.

The CHALLENGE:
  • In 2008 — Haïssaguerre found an increased prevalence of ER in patients with idiopathic VFib (N Engl J Med 358:2016-2023, 2008). Since then — the challenge has been to try to distinguish between the very common ECG finding of early repolarization vs asymptomatic individuals with ERP who have a significant risk of developing a malignant arrhythmia. The subject is complex — and beyond the scope of the basics that I cover here. Suffice it to say — Much remains to be learned!

I found articles by Di Diego JM & Antzelevitch C (J Wave Syndromes as a Cause of Malignant Cardiac Arrhythmias — Pacing Clin Electrophysiol 41(7): 684-699, 2018) — and — by Ali et al (Early Repolarization Syndrome: A Cause of Sudden Cardiac Death — World J Cardiology 7:466-475, 2015to be insightful. That said — the BEST article I found regarding definition of the terminology associated with ER (Early Repolarization) — is in the 2015 Consensus Paper written by Macfarlane et al, and including contributions from the biggest names in this field (J Am Coll Cardiol 66:470-477, 2015). Among the points brought out by these articles, and other literature I've reviewed:
  • The prevalence of ER in the general population has been cited to range between 2-to-31% — with this percentage depending on age, sex, race, differing terminology, and especially the amount of J-point elevation accepted as "qualifying" for the definition. But regardless of the criteria for inclusion that are chosen — Point #1 is that the ECG finding of Early Repolarization is common! — Point #2 (as emphasized by Macfarlane et al in their 2015 Consensus Paper) — is that the definition of "ER" had to be revised and agreed upon by researchers and clinicians in the field.

  • Early Repolarization (by the newer definition) — is said to be present on ECG if each of the following Criteria are met: i) There must be an end-QRS notch (J wave) or "slur" on the downslope of a prominent R wave — and this notch or "slur" must lie entirely above the baseline; ii) The peak of this notch (Jp) must be ≥0.1 mm elevated above the baseline in ≥2 contiguous ECG leads (excluding leads V1-V3). IF there is a "slur" (instead of a notch) — the onset of the slur must be ≥0.1 mm elevated above the baseline; and, iii) These ECG findings should be associated with prominent T waves (in ≥2 contiguous ECG leads) — and — a QRS duration (measured in leads that do not show a slur or a notch) that is less than 0.12 second in duration.

  • ST segment elevation without notching or slurring (as specified by the above criteria) — should not be considered "ER" by the Consensus Paper authors. Instead — they favor the term nonspecific ST elevation
  • MY Thought: If such nonspecific ST elevation not qualifying as "ER" is found in an asymptomatic subject with a low-risk profile — perhaps the designation repolarization variant may be equally suitable.

  • Di Diego & Antzelevitch emphasize: Incidental discovery of a J wave on a routine ECG recording should not be interpreted as a marker of "high risk" for sudden death (because the overall probability of malignant arrhythmia is very low in the general population = approximately 1/10,000). That said — there are certain characteristics of concern that increase risk.

Figure-2 is adapted from figures in the Di Diego & Antzelevitch article — in my attempt to illustrate ECG findings described with ER, as well as to summarize what goes into the complex process of risk assessment. Some pertinent points include:
  • ER (Early Repolarization) findings limited to the lateral ECG leads are extremely common — but are generally associated with low risk of malignant arrhythmias. 
  • ER associated with a rapidly ascending (upsloping) ST segments are the most common form — and are also generally associated with low risk of malignant arrhythmias.
  • typical low risk patient profile for ER is asymptomatic status (ER being incidentally discovered, when for whatever reason an ECG is done) — younger adult age — negative family history — voltage for LVH on ECG  — and, lower heart rate with lower blood pressure (suggesting a healthy, physically active individual).

  • Risk is increased when ER findings are seen in the inferior leads (either isolated to inferior leads — or seen in both inferior and lateral leads).

  • Risk of malignant arrhythmias is especially increased when ER findings are associated with a horizontal or descending ST segment (See Figure-2).
  • It is uncommon to see global J waves (ie, present in inferior, lateral and anterior leads) — but when this occurs, the risk of malignant arrhythmias is extremely high.

As best I can tell from the literature I reviewed — risk of malignant arrhythmias is not reliably predicted by distinction between a slurred vs notched ER pattern (with or without up to 2mm of J-point elevation).
  • BUT — Future risk of a malignant arrhythmia is clearly influenced by a patient's personal history (ie, of any worrisome cardiac arrhythmia or potential cardiac-related syncope/presyncope that the patient may have experienced) — and — by family history (ie, of sudden death or significant arrhythmic event).

  • higher risk patient profile would also include being older than "young adult age" — especially if ER findings include horizontal or descending ST segments (See Figure-2) — and — if the ECG also has findings suggestive of coronary disease.


How Does this Relate to the Patient with ECG #1:
All we are told is that this previously healthy 30-year old patient presented with "syncope" — but was asymptomatic at the time ECG #1 was obtained. Workup (including Echo) was negative for OMI — and the patient was discharged from the ED with a diagnosis of "vasovagal syncope" and a copy of their ECG "for future ED visits".
  • In my experience — the diagnosis of "vasovagal syncope" is all-too-often a diagnosis of exclusion used when no other acute cause has been found. But without additional information about this case — Can we really be certain there is no potential cardiac-related cause of this patient's syncope? (ie, Symptoms were concerning enough that this resulted in a visit to the ED!).

  • Regarding the ER findings in ECG #1 — Risk is at least somewhat increased because of the inferior lead location of the high-takeoff J wave slurring in Figure-1. On the positive side — the ST segment in all infero-lateral leads that show ST elevation is clearly "ascending" (upsloping) — and not horizontal or descending. 

  • BUT — because this patient presented to an ED for "syncope" — i) It is essential to obtain a thorough personal history (for potential prior events) — and — a thorough family history (for sudden death or malignant arrhythmia) — and — ii) Greater detail should be sought out until a diagnosis of simple "vasovagal syncope" can be made with more certainty.

Figure-2: I've adapted this Figure from 2 figures in the excellent review by Di Diego & Antzelevitch on J Wave Syndromes as a Cause of Malignant Cardiac Arrhythmias (Pacing Clinical Electrophysiology 41(7): 684-699, 2018 ). NOTE The amplitude of a notch is measured from the peak of the J wave (Jp) or from the onset of the slur (Jp). ST segment slope is assessed from the end of the notch or slur (Jt) — looking to see if the ST segment is ascending, horizontal or descending at a point measured 100 msec. ( = 2.5 little boxes) after the end of the notch or slur (ie, after Jt).


Recommended Resources