Friday, February 25, 2022

Missing ECG signs of OMI is associated with early death

Written by Sean Trostel MD, with edits by Smith and Meyers


A man in his 80s with history of CAD, MI s/p PCI, HTN, HLD, Afib, and HFrEF, presented with sudden onset, aching, central chest pain radiating to the left arm and shortness of breath that began in the morning, 1 hour prior to arrival to the ED.


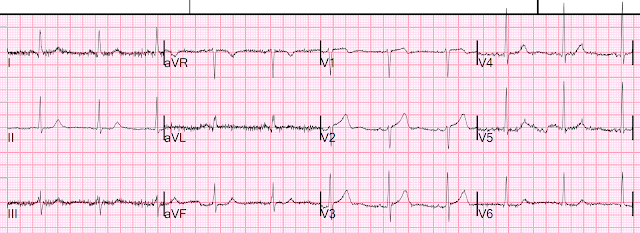
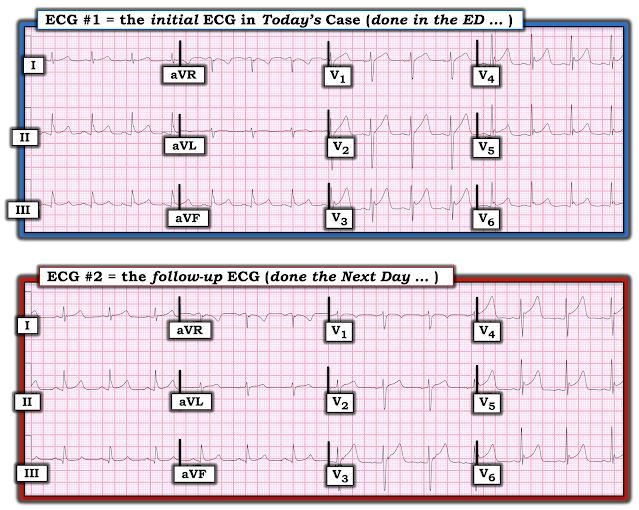
This was his initial triage ECG, recorded one hour after onset of symptoms, and a baseline ECG below for comparison:

What do you think?


Baseline on file:


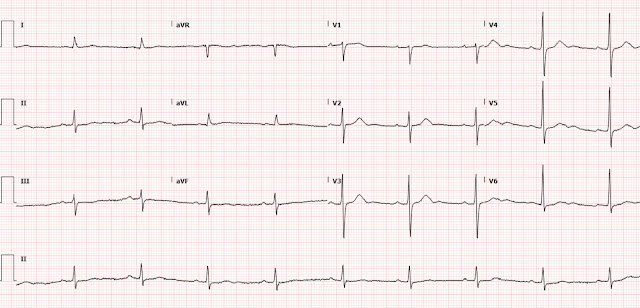
This ECG was interpreted as sinus bradycardia with no acute ST or T wave changes compared to prior.


Despite the very poor quality and wandering baseline (and there was no evidence that it was repeated for better quality), the ECG is still diagnostic. There is subtle ST depression in the anterior leads, most prominent in V2, which is specific for acute posterior OMI in the setting of ACS with a normal QRS complex (which should not have any STD). When compared to the prior ECG, the lateral T-waves have increased in volume relative to the QRS, concerning for lateral involvement; this is partly because of a diminution of QRS amplitude. The ECG is diagnostic for posterolateral OMI until proven otherwise.


The patient was observed in the ED, given unspecified “pain medicine”, and labs were obtained. Initial high-sensitivity troponin was elevated to 214 ng/L. Three hours later the patient continued to have chest pain, and a repeat ECG was ordered:

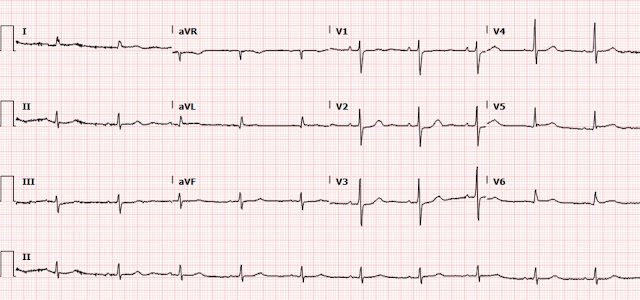
Ongoing posterolateral OMI.


At this time, the ED physician read the ECG to have subtle lateral ST segment changes not appreciated on the prior ECG. But it seems that this was not acted upon.

A troponin was repeated and elevated to 1174 ng/L. The patient was transferred to a referral center, but the cath lab was not activated because his lateral ST elevation did not meet STEMI criteria. Neither the ED nor cardiology notes ever mention the ST depression seen in the anterior leads.

He was seen by cardiology on arrival to the referral center, at which time he continued to have chest pain. He was diagnosed with NSTEMI and was admitted for medical management and angiography the following day.                                    


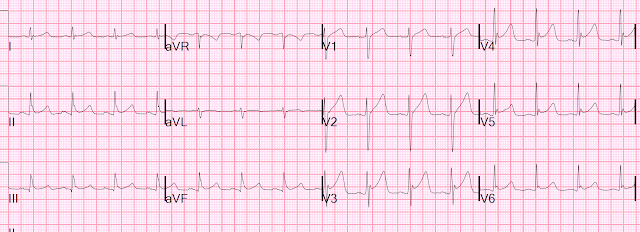
Overnight a serial ECG was obtained.

What do you think?


Did he develop Q waves and T-wave inversions in the high lateral leads?

No, instead it is the classic limb lead reversal (LA/RA reversal). This causes inversion of lead I and switching of aVL for aVR and II for III. At the same time, the patient’s prior ischemic changes have improved. In the anterior leads you can see enlargement of the T-waves, likely reciprocal to T-wave inversions in the posterior leads, indicating some amount of reperfusion in the posterior myocardium. This is called "posterior reperfusion T waves." 

Serial troponins continued to rise throughout the night, 14,891 ng/L, then peaking at greater than 25,000 ng/L 12 hours after the onset of the patient’s pain.


The patient did undergo left heart cath approximately 24 hours after the onset of his pain, at which time an 80% mid RCA lesion and a 100% proximal first obtuse marginal (OM1) occlusion were found. The RCA lesion was called the culprit and stented, but they state there was no thrombus and give no detail about this lesion in the cath report. For the OM1 occlusion, there is literally no detail at all except "OM1: 100% stenosis." There is no detail of whether there is thrombus, no mention of it being a culprit lesion or chronic, no mention of any attempt to cross the lesion. There is no mention of collateral circulation to either territory.

Following PCI, an echo showed akinesis of the mid and apical anterior, anterolateral, lateral, and inferior myocardium with LVEF 35-40% and no right ventricular dysfunction. These changes were new compared to a prior echo. My suspicion is that the OM1 occlusion could have been the true culprit lesion, given posterolateral ischemia on ECG, akinesis in this region, and no RV involvement on echo.


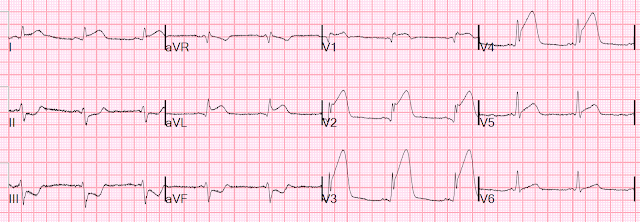
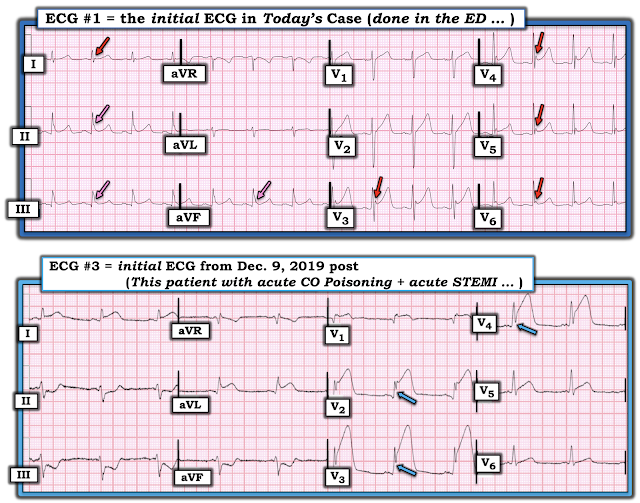
The following day, the patient developed Afib/flutter with RVR, and the following ECG was obtained.


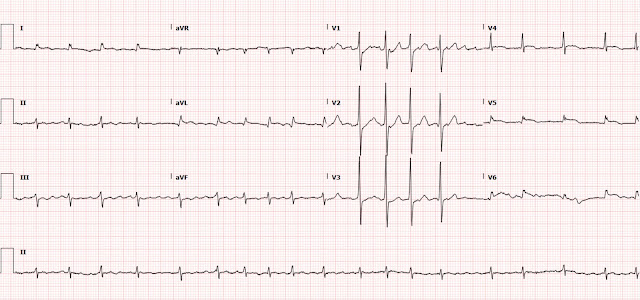
In this ECG you can see recurrence and worsening of the patient’s lateral ST elevation and anterior ST-depression. This is not surprising if the OM1 was the culprit without revascularization, and now this territory has increased demand due to tachycardia.


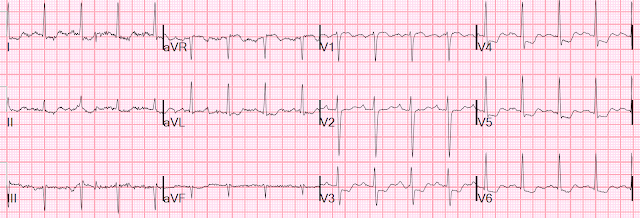
Ultimately the patient was discharged after 3 days and followed up in clinic 1 week later, at which time the following ECG was obtained. 

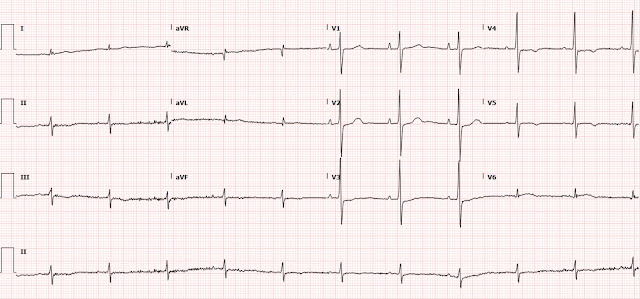
Compared to the patient’s initial ECG, his new baseline has developed new large R waves in the anterior leads, which is consistent with posterior infarction.


Sadly this patient spent the next several months in and out of the hospital with heart failure exacerbations before dying from the same.


Learning points:

Especially if you do not have expert ECG interpretation skills, do not settle for an ECG of such poor quality as the first ECG from this case! An interpreter with less experience could have recognized some abnormalities in that first ECG if it had better quality.

ST-depression of any amplitude maximal in V2-V4 in a patient with suspected ACS and without another QRS-based reason for STD should be considered posterior OMI until proven otherwise.(1) In this case, the ST depression was subtle, but ultimately proved diagnostic of a posterior OMI. This is yet another example of STEMI(-) OMI receiving delayed catheterization due to the current STEMI/NSTEMI paradigm.

It is often difficult to determine or prove the culprit artery even with the angiogram report. The report shows no evidence that the OM1 was even considered as a potential culprit lesion. Anecdotally, we find such problems very commonly with delayed NSTEMI catheterizations. What might have been an obvious acute culprit initially, is perhaps less obvious 24 hours later, and this mistake is facilitated by the cognitive bias that, "of course there's no total occlusion, that can't be the acute culprit, because the patient has only NSTEMI."

According to 2021 AHA/ACC guidelines, NSTEMI with refractory angina or hemodynamic or electrical instability is an indication for immediate cardiac catheterization and possible PCI.(2) This patient would have benefited from cath lab activation as soon as he arrived to the referral center with ongoing anginal chest pain and uptrending troponin, regardless of the presence or absence of ECG changes.

If an ECG shows an abrupt change in axis, inversion of lead I, and reversal of lead aVR with aVL and II with III, check for upper extremity limb lead reversal.

Prior posterior infarction can be recognized by prominent R waves in V1-V3. These R waves can be thought of as reciprocal to would-be Q waves in the posterior myocardium. (3,4)

Non-STEMI that is OMI has double the 1-year and 2-year mortality of Non-STEMI that is NOMI. (5)


References

1. Meyers HP, Bracey A, Lee D, Lichtenheld A, Li WJ, Singer DD, Rollins Z, Kane JA, Dodd KW, Meyers KE, Shroff GR, Singer AJ, Smith SW. Ischemic ST-Segment Depression Maximal in V1-V4 (Versus V5-V6) of Any Amplitude Is Specific for Occlusion Myocardial Infarction (Versus Nonocclusive Ischemia). J Am Heart Assoc. 2021 Dec 7;10(23):e022866. doi: 10.1161/JAHA.121.022866. Epub 2021 Nov 15. PMID: 34775811.

2. Lawton J, Tamis-Holland J, Bangalore S, Bates E, Beckie T, Bischoff J, Bittl J, Cohen M, DiMaio J, Don C, Fremes S, Gaudino M, Goldberger Z, Grant M, Jaswal J, Kurlansky P, Mehran R, Metkus T, Nnacheta L, Rao S, Sellke F, Sharma G, Yong C and Zwischenberger B (2021) 2021 ACC/AHA/SCAI Guideline for Coronary Artery Revascularization: Executive Summary: A Report of the American College of Cardiology/American Heart Association Joint Committee on Clinical Practice Guidelines, Circulation, 145:3, (e4-e17), Online publication date: 18-Jan-2022.

3. Perloff JK. The Recognition of Strictly Posterior Myocardial Infarction by Conventional Scalar Electrocardiography. Circulation. 1964 Nov;30:706-18. doi: 10.1161/01.cir.30.5.706. PMID: 14226169.

4. van Gorselen EO, Verheugt FW, Meursing BT, Oude Ophuis AJ. Posterior myocardial infarction: the dark side of the moon. Neth Heart J. 2007;15(1):16-21.

 5. Khan et al. Impact of total occlusion of culprit artery in acute non-ST elevation myocardial infarction: a systematic review and meta-analysis. European Heart J, 2007. 38, 3082-3089.


===================================

MY Comment, by KEN GRAUER, MD (2/25/2022):

===================================


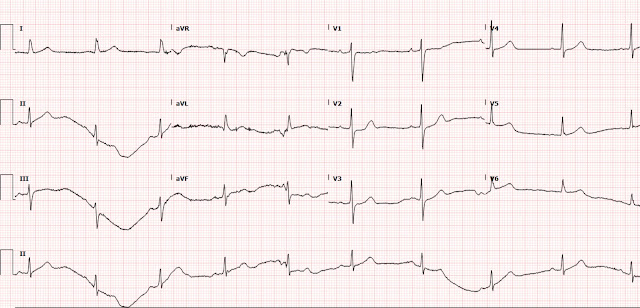
Excellent case by Drs. Trostel, Smith & Meyers — in which they present yet one more case of a posterior OMI that was overlooked by a number of providers despite the very typical history + progressively rising troponin levels. I limit my comments to the initial ECG — which I reproduce in Figure-1.


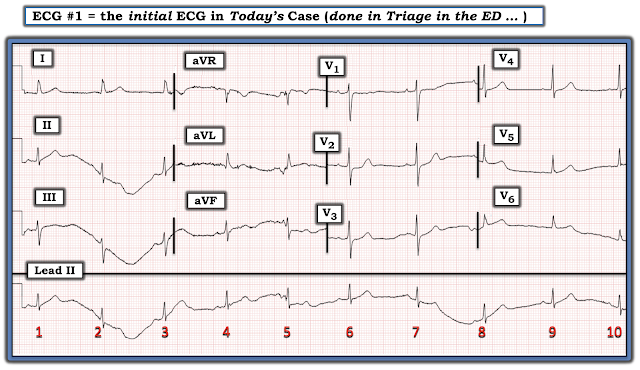
Figure-1: The initial ECG in today's case, taken at Triage in the ED.


My Thoughts on the Initial Tracing:

As per Dr. Trostel — there are subtle-but-real abnormalities on the initial tracing. These should have been noticed — and they should have triggered repeating the ECG long before the 2.5 hours it took.

  • This patient is in his 80s — he has a history of known coronary disease — and he presents with a history completely typical for an acute event (in the form of new-onset, radiating chest pain that began just 1 hour before he got to the ED). With this history — Emergency providers need to start with an extremely high index of suspicion, to the point that they almost need to prove that such a patient is not having an OMI, rather than the other way around.

  • Even before gaining access to the baseline (prior) ECG — the early transition in the chest leads (R = S, already by lead V2) with "shelf-like" ST depression in this lead V2 + the hint of ST elevation in lead V6 (the 1st complex in V6 looks to have a hyperacute T wave, in view of the very small amplitude of the R wave in this lead). Given the need to prove this highly typical acute presentation is not due to acute OMI — these changes (even before the elevated troponin levels returned) should not be ignored.

There is another reason this initial ECG should have been repeated long before the 2.5 hours it took — namely that in a patient in whom you are looking for subtle-but-real clues — ECG #1 is technically inadequate!
  • Look at the baseline wander in the long lead II rhythm strip (Figure-2). The T waves in beats #1, 3 and 9 look hyperacute — where as it looks as if there is ST depression in beats #2, 5 and 7. In contrast — the ST-T wave of beat #6 looks totally normal.
  • PEARL: The problem causing the marked baseline wander appears to be in the Left Leg — since everything looks normal in lead I ( = the 1 limb lead for which the electrical activity from the left leg electrode is not involved).

Note in Figure-2 — that I've labeled the ST-T waves in selected leads with an "A" and a "B"Which complex in each of these labeled leads is the real ST-T wave?
  • In lead II — Is it the hyperacute-looking T wave (A) — or the marked ST depression in B?
  • In lead aVL — Is it the ST elevation in B?
  • In lead aVF — Is it the ST elevation in A — or the ST depression in B?
  • in lead V2 — Is it complex A that is diagnostic of acute Posterior OMI (ie, with very positive "Mirror" Test) — or B, in which there is only subtle J-point depression? (NOTE: For more on the "Mirror" Test — See My Comment at the bottom of the page in the February 10, 2022 post in Dr. Smith's ECG Blog).

  • In lead V3 — Is it the abnormal ST segment flattening in A (which in association with the "shelf-like" ST depression of A in lead V2 further supports the diagnosis of acute Posterior OMI) — or B in lead V3, which looks virtually normal?
  • In lead V6 — Is it the hyperacute T wave with subtle-but-real ST elevation in A — or the unremarkable ST-T wave in B of lead V6?

BOTTOM LINE: In the context of the history in today's case — we need to be looking hard for subtle-but-real findings that justify prompt cath to define the anatomy and expedite reperfusion.
  • The technically inadequate initial ECG in Figure-1 should be immediately repeated in such a patient.

Our THANKS once again to Dr. Sean Trostel for his insightful presentation!

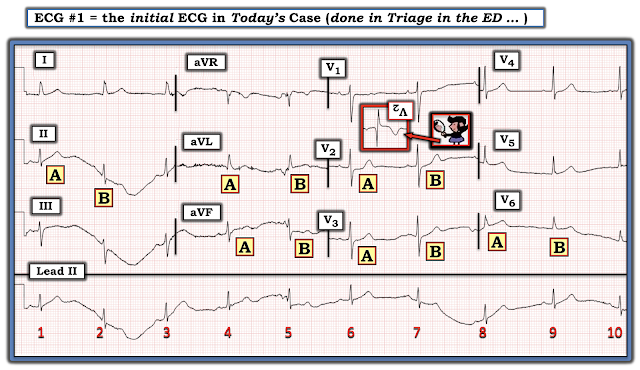
Figure-2: I've labeled the initial ECG (See text).


Tuesday, February 22, 2022

A 40-something man with very elevated blood pressure and acute severe chest pain

This 40-something male whose only medical history was hypertension presented with acute chest pain.

A 12-lead ECG was immediately recorded within minutes of arrival at triage: 

What do you think?  
Is the STE in V2-V4 due to normal variant ST Elevation (so called "Early repolarization") or is the STE due to LAD Occlusion (OMI)?


The very astute triage physician immediately recognized LAD Occlusion (LAD Occlusion MI or OMI).  Why?

There is some ST elevation, but it does not meet "STEMI criteria".  But there are hyperacute T-waves (wide and "bulky" in proportion to the QRS). There are also down-up T-waves in III and aVF, which is a quite specific sign of LAD OMI.

Moreover, there is a touch of ST depression in lead V6; normal variant STE never has any ST depression except for lead aVR.

In a male over age 40, the Universal Definition of MI accepts as normal up to 2.0 mm STE in V2 and V3 and up to 1 mm in all other leads (for women it is 1.5 mm, and for men under age 40 it is 2.5 mm).  There are not 2 consecutive leads meeting these criteria.  But as we always point out, <50% of acute Occlusion MI meet these criteria.  

David Marti et al. found that 18% of LAD Occlusion have no lead with more than 1 mm STE.  Incidence, angiographic features and outcomes of patients presenting with subtle ST-elevation myocardial infarction.  And there are many other similar publications.

If we apply the formula for differentiating LAD Occlusion from Normal Variant STE, and we use QTc of 436 ms (computer measured), R-wave amplitude in V4 = 14 mm,  QRS in V2 = 7 mm,  and STE at 60 ms after the J-point = 2.5 mm, we get 20.5, which is very high and confirms LAD Occlusion.

____________________

2 days ago I posted an ECG with normal ST Elevation that could mimic OMI.  

Here is today's ECG placed below that normal ECG: 

Normal on top; LAD OMI on the bottom
In both cases, without measuring anything, an experienced interpreter knew instantly that the top ECG is normal and the bottom one is LAD Occlusion.  

Learn to recognize ECGs in the same way that you recognize faces.

______________________________

The cath lab was activated emergently.

In the meantime, the patient's pain dropped from "11/10" to "5/10" and another ECG was recorded at 14 minutes after the first, using exactly the same lead stickers:

What do you think?


This ECG had normalized (due to partial reperfusion)  Such normalization further proves that the first one is diagnostic!

This shows resolution of hyperacute T-waves and of much of the STE.  Notice that, in this ECG, the T-wave in V2 is larger than it was in the first one!!  However, it is SMALLER in proportion to the size of the QRS, and PROPORTION IS ALL THAT MATTERS.  In V3 and V4, the T-wave is now smaller in absolute terms and MUCH smaller in proportion to the QRS.  So this implies spontaneous reperfusion. 

There is also resolution of the small amount of STE in aVL and I.

Notice that the QRS voltage has increased.  Occlusion and reperfusion affect not only the ST-T, but the QRS.

Case continued

Several minutes later while waiting for the cath team, the patient was again having excruciating pain and another ECG was recorded at 32 minutes after the first.
Obvious Anterolateral STEMI [STEMI (+) OMI]
LAD Occlusion Proximal to First Diagonal - we know the location due to the STE in I, aVL and inferior reciprocal ST Depression.
Notice the S-wave in V3 has nearly disappeared.


The patient's blood pressure was very high (170/115) and so he was given several sublingual NTG and also started on a Nitroglycerine drip and titrated up to 150 mcg/min until blood pressure was 150/90.  We should have given him metoprolol, as this is indicated in anterior STEMI of symptom duration less than 6 hours, going to cath lab, with Systolic BP >120 mmHg (mortality decreased in randomized trials).  See the discussion of beta blockade for Anterior STEMI at this post.  (We only thought of that after cath lab was ready.)

The patient was taken to the cath lab and found to have a thrombotic 99% Proximal LAD Occlusion with TIMI-1 flow (greatly decreased flow).  

We do not know whether or not there would have been any flow (TIMI-0 vs. TIMI-1) at the time of the ECG.  [We do know that only 64% of True STEMI have TIMI-0 flow; 36% have TIMI 1, 2, or 3 flow. This is because coronary thrombi are dynamic, and change between the time of the ECG and the time of the angiogram.]

The LAD was opened and stented.

Next Day:

Reperfusion T-waves, identical to Wellens' waves


The initial high sensitivity troponin I was 236 ng/L.  No further trops were measured.

Echo showed no wall motion abnormality.  Rapid recognition and cath lab activation saves myocardium!!

The patient was discharged from the hospital 48 hours after admission.


===================================

MY Comment, by KEN GRAUER, MD (2/21/2022):

===================================

Today's case is an excellent one for honing our skills in recognizing acute OMI in the absence of satisfying millimeter criteria for an acute STEMI. As per Dr. Smith — In a patient with new-onset chest pain — the initial ECG in today's case (that I reproduce below in Figure-2) — is diagnostic of acute LAD occlusion.
  • By way of review — I wanted to summarize those ECG findings, that when seen in association with new cardiac symptoms — should immediately suggest acute OMI regardless of whether or not millimeter-based criteria for a STEMI are met (Figure-1).

Figure-1: ECG findings to look for when your patient with new-onset cardiac symptoms does not manifest STEMI-criteria ST elevation on ECG. For more on this subject — SEE the September 3, 2020 post in Dr. Smith’s ECG Blog with 20-minute video talk by Dr. Meyers on The OMI Manifesto. For my clarifying Figure illustrating T-QRS-D (2nd bullet) — See My Comment at the bottom of the page in Dr. Smith’s November 14, 2019 post.


WHY is ECG #1 Diagnostic of Acute OMI?
I focus my comments on a number of findings in the initial ECG (Figure-2). These highlight the 1st and 3rd bullets in the Table shown above in Figure-1.
  • As per Dr. Smith — there are hyperacute T waves. Realizing that this term is subject to individual interpretation — I define "hyperacute" T waves as being disproportionately tall and/or fatter-at-their-peak or wider-at-their-base than should be expected given R wave and S wave amplitude in the lead being looked at. Simply stated — Hyperacute T waves are overly "voluminous", in that they take up more than the expected amount of space under the T wave.

  • Although there is some ST elevation in leads V2, V3 and V4 — there does not have to be ST elevation for T waves to be "hyperacute".

  • As emphasized in the Table in Figure-1 — the more leads with suspicious findings — the greater the concern for an acute ongoing event. I start with those 1 or 2 leads that are definitely "hyper-voluminous" — which in the case of Figure-2, are leads V2 and V3. Not only does the T wave in lead V2 tower over the small R wave in this lead — but the peak of this T wave is "fat" — and the base of this T wave takes up the major part of the QT interval. 
  • Similarly — the T wave in lead V3 is much taller, with a much wider base than expected given the size of the QRS complex in this lead. 
  • By the concept of "neighboring leads" — the T wave in lead V4 is also (by my definition) hyperacute. One might not think so if you only looked at the T wave in lead V4 by itself — but given that the T waves in leads V2 and V3 are definitely abnormal — I thought the T wave in lead V4 was clearly more "voluminous" than I would have expected.

But there are other leads in Figure-2 that I assessed as definitely abnormal!
  • The ST segments in lateral chest leads V5 and V6 are flattened (straightened RED lines in these leads) — and — these ST segments in V5, V6 are accompanied by relatively low amplitude T waves (ie, Normally, the T waves in these lateral chest leads are not this much smaller in size than T waves in the anterior leads).
  • The ST-T wave for the 2 beats in lead V1 look different. IF the "correct" ST segment is that for the 2nd beat in lead V1 — then this subtle ST elevation with ST segment coving is not a normal lead V1 finding.
  • In the Limb Leads — there are subtle-but-real abnormalities in 5 of the 6 leads. In addition to the "down-up" T waves highlighted by Dr. Smith that shouldn't be there (BLUE arrow in lead aVF) — the ST segments in leads II and aVF are abnormally straightened (RED lines in these leads). In the context of clearly hyperacute T waves in the chest leads — I took the subtle-but-real ST elevation with wide-based T waves in leads I and aVL as suggestive of hyperacute change. In that context — the small q waves in these high lateral leads might or might not be significant.
  • Finally — I thought the inverted T wave in lead III was probably a reciprocal change. To Emphasize: The T wave in lead III may normally be negative, especially when the QRS complex is predominantly negative in this lead. But, given clear abnormalities in the other 2 inferior leads (leads II and aVF) — I interpreted this T wave inversion in lead III as a mirror-image opposite reciprocal change to the subtle ST-T wave abnormalities seen in lead aVL
BOTTOM LINE:
  • In this 40-something man with new-onset chest pain — definite hyperacute T waves (with some ST elevation) are seen in leads V2 and V3 — with subtle-but-real ST-T wave abnormalities in no less than 10 (if not 11) of the 12 leads. As was recognized by the astute triage physician — acute LAD occlusion must be assumed until proven otherwise!

Figure-2: I've labed the initial ECG in today's case.


Extra CREDIT:
Did YOU notice that the rhythm in ECG #1 was not sinus?
  • Why do I say this?


ANSWER:
We recognize sinus rhythm by the presence of an upright P wave in lead II. The reason for this finding, is that the path of the electrical impulse as it travels from the SA Node toward the AV Node — will be oriented very close to +60 degrees in the frontal plane when the rhythm is sinus. This is why the P wave should normally be tallest in lead II (compared to P wave amplitude in leads I and III).
  • Suspect either a non-sinus rhythm or LA-LL Lead Reversal if ever the P wave is clearly upright and larger in lead I compared to lead II (as is the case in ECG #1).
  • As per the August 28, 2020 post in Dr. Smith's ECG Blog (Please see the Addendum I wrote at the bottom of the page of that post) — among the changes that occur with LA-LL Lead Reversal are: i) Leads I and II switch places (which is why a sinus P wave will look larger in lead I with this type of lead reversal)ii) Lead III becomes inverted; andiii) Leads aVL and aVF switch places.
  • Since the repeat ECG during chest pain recurrence in today's case showed a normal-appearing upright P wave (much larger than the P wave in lead I at that time) — but without inversion of lead III — we can conclude that the reason for the small P wave in lead II of ECG #1 is not LA-LL lead reversal — but instead simply reflects a Low Atrial Rhythm.

  • To Emphasize  A low atrial rhythm is often not a pathologic rhythm, and in today's case, the fact that there is a low atrial rhythm has no impact on either treatment or the clinical course of this patient. But the most common mistake I've seen even experienced interpreters make when interpreting arrhythmias — is the failure to spend the 3-5 seconds it takes for your "educated eye" to look in front of each beat in the long lead II rhythm strip to ensure that you always see a clearly upright P wave with constant PR interval before each beat. IF you don't — then something else is going on!

  • As noted above, among the changes seen when there is LA-LL Lead Reversal — are that lead III will be inverted — leads I and II switch places — and leads aVL and aVF switch places. Failure to recognize this lead reversal in the above referenced August 28, 2020 post completely changed the location and appearance of acutely-evolving ST-T wave changes in the follow-up ECG of that case. PEARL: Be on the alert that IF the P wave in lead I is clearly larger than the upright P wave in lead II — that it's important to find out why!


Friday, February 18, 2022

A comatose patient with a carbon monoxide level over 50%

A young man had an accidental exposure to carbon monoxide (CO).  He was comatose and intubated and his initial Carboxyhemoglobin level was over 50%.

An ECG is always recorded for CO toxicity.  This was his ECG.  

It was shown to me with worry for ischemic ST elevation, which is certainly possible from severe CO toxicity, or concomitant ACS.  

In fact, there is laboratory evidence that CO toxicity increases Platelet–neutrophil aggregates and plasma myeloperoxidase (MPO) concentration and thus may precipitate ACS (though this is by no means clinically proven).  Intravascular Neutrophil Activation Due to Carbon Monoxide Poisoning

What do you think of this ECG?


My interpretation was that this was all normal variant ST Elevation.

Inferior STE: there are prominent J-waves in all leads.  There is no reciprocal ST depression in aVL.

Anterior STE: Prominent J waves and high QRS amplitudes.

If we use the LAD-normal variant formula, we get:

QTc = 436 ms 

R-wave V4 = 13 mm, QRS V2 = 21 mm, STE at 60 ms after J pt in V3 = 2.5

Formula value = 18.7.  This is suggestive of LAD occlusion.  However, the variable which most contributes to this is the QTc of 436 ms, which is quite long and skews the result of the formula to LAD occlusion.  For comparison, if the QT were an average of that of LAD occlusion (420 ms) vs. Normal variant (390 ms) from our study, the QTc would be 405 ms and the formula value would be 17.06, which is rarely seen in LAD occlusion

What we have evidence for, but is not widely known, is that CO Toxicity likely lengthens the QT interval.  So this relatively long QT interval is NOT due to ischemia but may be a result of CO Toxicity.  Yelken B et al. The assessment of QT intervals in acute carbon monoxide poisoning

I was not worried about this ECG.

The coma completely recovered with 3 hyperbaric oxygen treatments in our world class state-of-the-art-facility.  https://hennepinem.com/fellowships/hyperbaric-medicine/.  

Read more about CO poisoning and cardiac ischemia here (ECG is pasted below): What is the treatment for this subendocardial ischemia?


Troponin peaked at 43 ng/L (barely elevated; most patients with CO toxicity this severe have significantly elevated troponin simply from the oxygen deprivation AND from directly toxicity of CO on myocardial cells)

Here is the next day ECG:

Essentially the same, with no evolution, proving that the previous ECG is his baseline normal variant ST Elevation

Sometimes Occlusion MI and CO poisoning are simultaneous!

The patient was discharged neurologically intact.

______________________________

See this case of an awake patient without chest pain but with a CO level of 34%:

CO poisoning. Routine ECG recorded before hyperbaric therapy....Are they related?

With this ECG:


________________________


See this typical case of cO poisoning: 

What is the treatment for this subendocardial ischemia?


===================================

MY Comment, by KEN GRAUER, MD (2/17/2022):

===================================


Insightful case presented by Dr. Smith of this young adult who presented with accidental CO poisoning. I focus my comments on an often-overlooked technical point — and — on an important clinical point that is unfortunately not well appreciated by clinicians outside of those who regularly follow Dr. Smith’s ECG Blog.


The Often-Overlooked Technical Point:
As per Dr. Smith — in support of our impression that the initial ECG in today’s case represented a benign repolarization variant, was the lack of any significant change in overall ST-T wave appearance in the repeat ECG (done the next day) — compared to the initial ECG that was done in the ED ( = ECG #2 compared to ECG #1 in Figure-1). That said — there IS a difference between the 2 tracings!
  • The KEY to accurate comparison of serial tracings — is to be sure you are “comparing apples with apples — instead of comparing apples with oranges”
  • It is common to see changes in frontal plane axis and/or in chest lead R wave progression on serial tracings. This may be due to slight changes in the incline of the patient’s bed (ie, if on the initial tracing the patient was too dyspneic to lie flat) — or, to changes in chest lead electrode placement — or, simply due to the difficult-to-account-for slight variation in QRST morphology that sometimes occurs from one tracing to the next. These changes may produce differences in QRS and ST-T wave morphology from one tracing to the next not due to any change in the patient’s clinical condition.

CHECK OUT the 2 serial tracings in Figure-1:
  • Is the frontal plane Axis the same in both tracings?
  • Is R Wave Progression (and the area of Transition) the same?
  • IF either the Axis or R Wave Progression changed — How did this change affect QRS and ST-T wave appearance?


ANSWER:

The frontal plane Axis is identical in ECG #1 and ECG #2 in Figure-1 (ie, approximately +70 degrees). Comparing these 2 tracings lead-by-lead — QRS morphology is virtually identical in each of the 6 limb leads. This tells us that lead-by-lead comparison of ST-T wave changes in the 6 limb leads is "comparing apples with apples", so that any differences in ST-T wave morphology in any of these 6 limb leads will be real! 

  • Since there has not been any change (other than minimal increase in T wave amplitude in lead aVL of ECG #2) — we can confidently say "No change".


In contrast — R Wave Progression is different in ECG #2, compared to what it was in ECG #1.

  • The area of Transition (where height of the R wave becomes taller than the S wave is deep) — had been between leads V3-to-V4 in ECG #1. Note that R wave amplitude equaled S wave depth already in lead V3 in ECG #1.
  • Transition occurs later in ECG #2 (ie, R wave height does not exceed S wave depth until leads V4-to-V5 — and the QRS was still predominantly negative in lead V4).
  • This means that serial comparison looking for ST-T wave changes in Figure-1 between these 2 tracings is not like "comparing apples with apples" — because transition is delayed in ECG #2, and QRS morphology is not the same.

  • Isn't the T wave in lead V1 of ECG #2 now negative — whereas it was positive in ECG #1?
  • Isn't the T wave in lead V2 of ECG #1 significantly taller than the T wave in lead V2 of ECG #2?
  • Isn't there more J-point ST elevation in leads V2 and V3 in ECG #1?

BOTTOM Line: When frontal plane Axis or R Wave Progression changes in serial tracings (as it so often does!) — We have to account for such changes with a "value judgment" as to whether we think such differences in ST-T wave morphology represent a "real" (ie, clinically significant) change — or whether such differences are unlikely to be clinically significant.

  • I completely agree with Dr. Smith's assessment — that in today's case, the differences we see in ST-T wave morphology between the 2 tracings is unlikely to be clinically significant (and is most likely the result of slight change in chest lead electrode placement).
  • Take-Home POINT: Remember to take into account frontal plane Axis and R Wave Progression when comparing serial tracings!


Figure-1: Comparison of the initial ECG in the ED ( = ECG #1) — with the follow-up ECG done the next day ( = ECG #2).


The Important Clinical Point:

Prior to working with Dr. Stephen Smith — the concept of Terminal QRS Distortion (T-QRS-D) was unknown to me. It’s a beautiful concept that on occasion may provide invaluable assistance for distinguishing between early repolarization vs acute OMI. The 3 ECGs shown above by Dr. Smith in today's case add insight to what is, and what isn’t T-QRS-D.
  • T-QRS-— is defined as the absence of both J-wave and an S-wave in either lead V2 or lead V3 (and sometimes lead V4). Although simple to define — it’s taken me a bit of practice to become comfortable and confident in its recognition.

There are an increasing number of other examples of what T-QRS-D is, and what it is not on Dr. Smith’s Blog. For easy reference — Consider these 2 links:

Figure-2: Comparison between ST elevation in lead V3 due to a repolarization variant (TOP — from the 4/27/2019 post) — vs acute OMI (BOTTOM — from the 9/20/2015 post), which manifests T-QRS-D (See text).


What About the ECGs shown in Today's Case?
To illustrate the difference between what T-QRS-D is and is not — I've put the 1st and 3rd tracings shown in today's case together in Figure-3.
  • ECG #1 ( = TOP tracing in Figure-3): As per Dr. Smith — the ST-T wave changes in this tracing strongly suggest a repolarization variant. In addition to prominent J-point notching in multiple leads (RED arrows in Figure-3) — there is normal R wave progression with ample QRS amplitude — no reciprocal ST depression — similar ST-T wave morphology in multiple leads (ie, lack of the localizing changes that are typically seen with acute infarction) — and, terminal QRS "slurring" (PINK arrows), that convey similar clinical implications as the prominent J-point notching. Lack of evolution on the repeat tracing done the next day (ECG #2) supported the conclusion that ECG #1 represents a repolarization variant, and is not indicative of an acute cardiac event.

  • ECG #3 ( = BOTTOM tracing in Figure-3) — was added to today's case by Dr. Smith to provide an example in which acute CO poisoning was accompanied by an obvious STEMI (The case discussed in detail in the December 9, 2019 post in Dr. Smith's ECG Blog). Note the BLUE arrows — which highlight obvious T-QRS-D, seen here in the 3 leads with the most ST elevation.

Take-Home POINT: Clearly — the diagnosis of acute LAD occlusion is readily evident in ECG #3 without need to identify T-QRS-D. But there will be occasional cases in which you may be uncertain if there is (or is not) an acute OMI — in which case, recognizing T-QRS-D may instantly confirm your suspicion of the need for prompt cath.


Figure-3: Comparison of ECG #1 and ECG #3 from today's case to illustrate what is — and what is not T-QRS-D (See text).


Recommended Resources