Friday, September 30, 2022

Are all of these ST-T findings due to LVH?

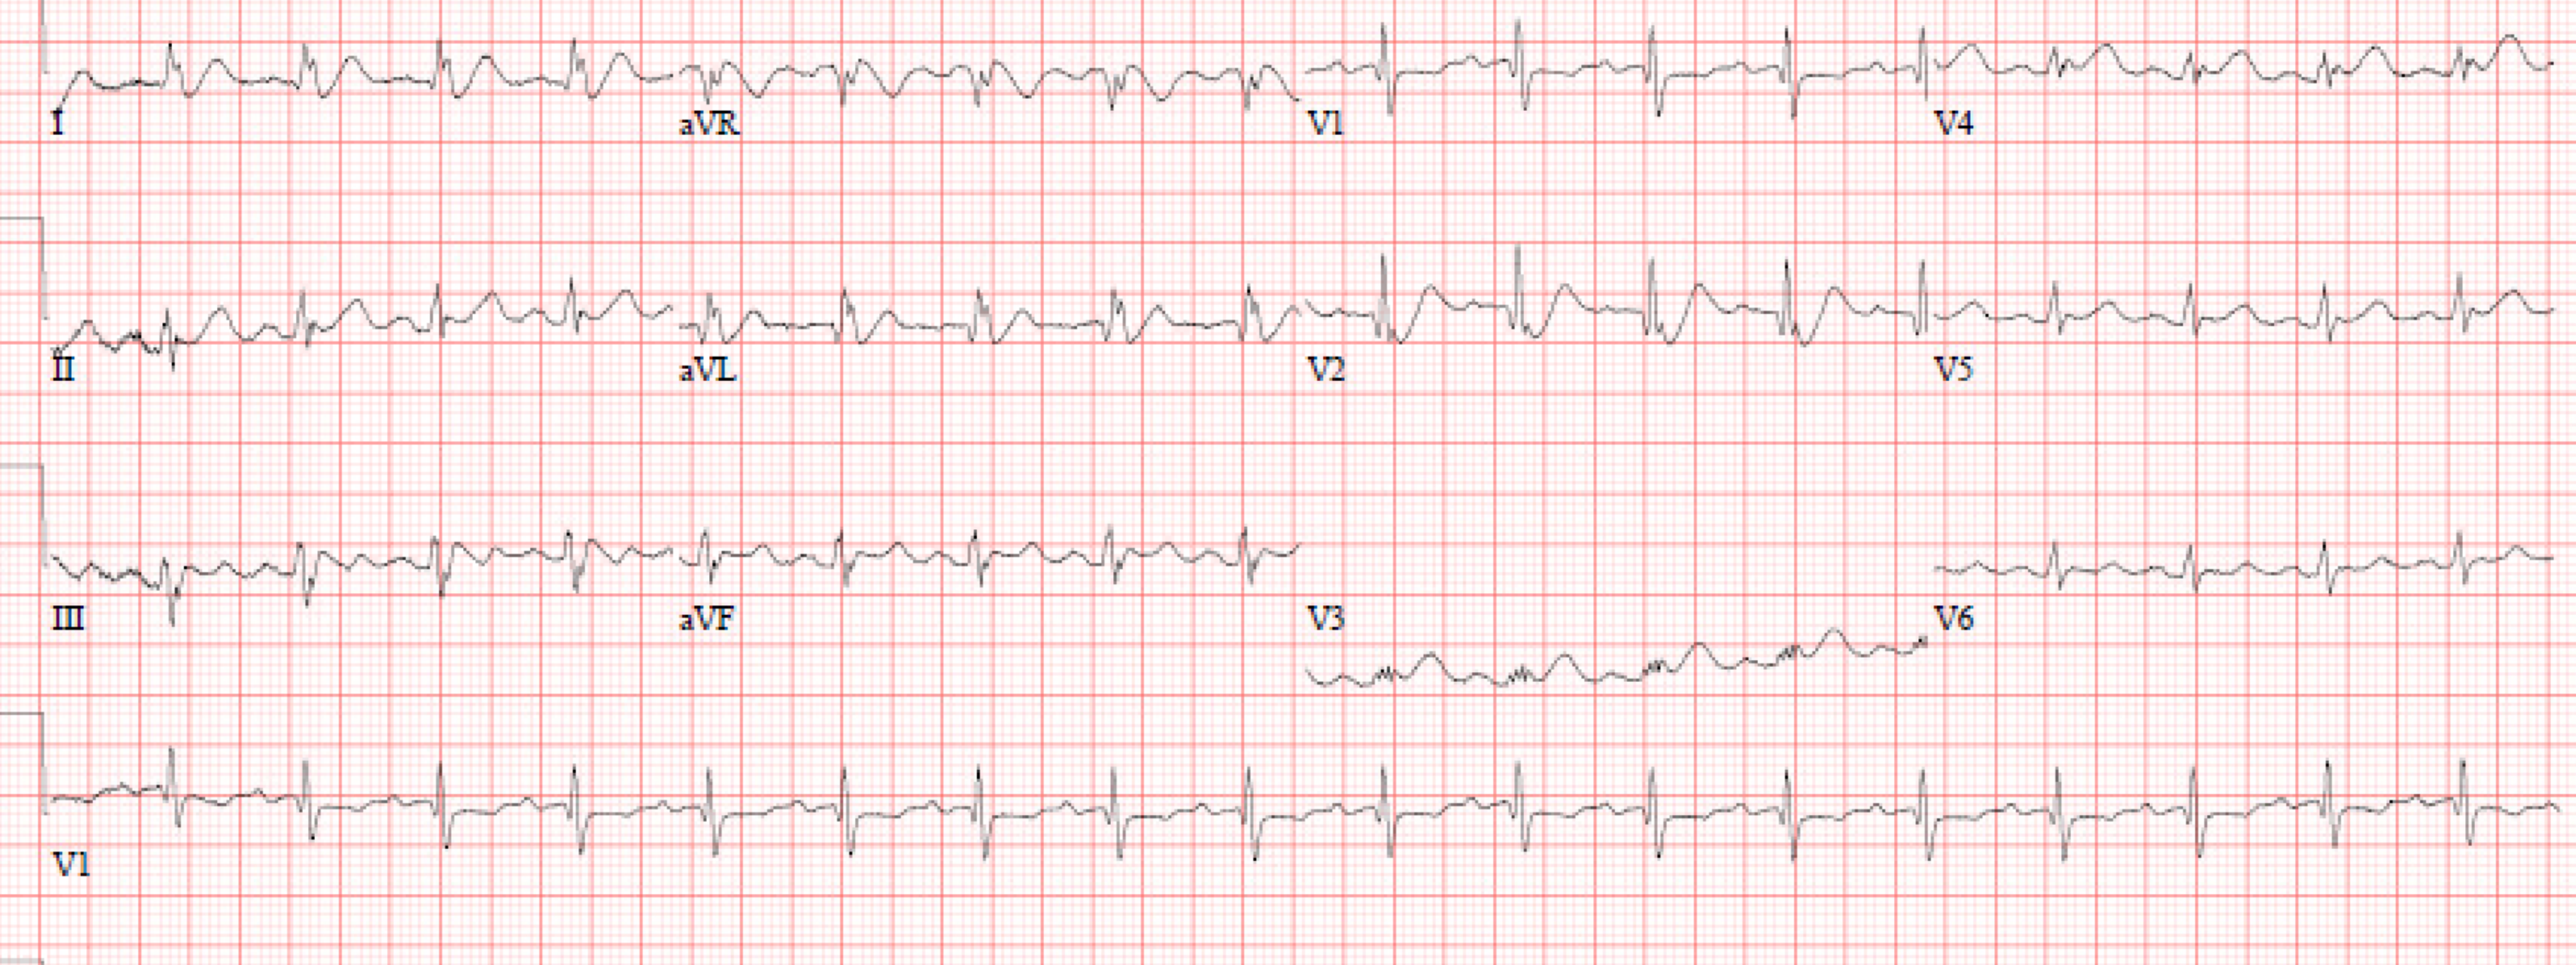
 I was texted this ECG:


What do you think?  What did I text back?


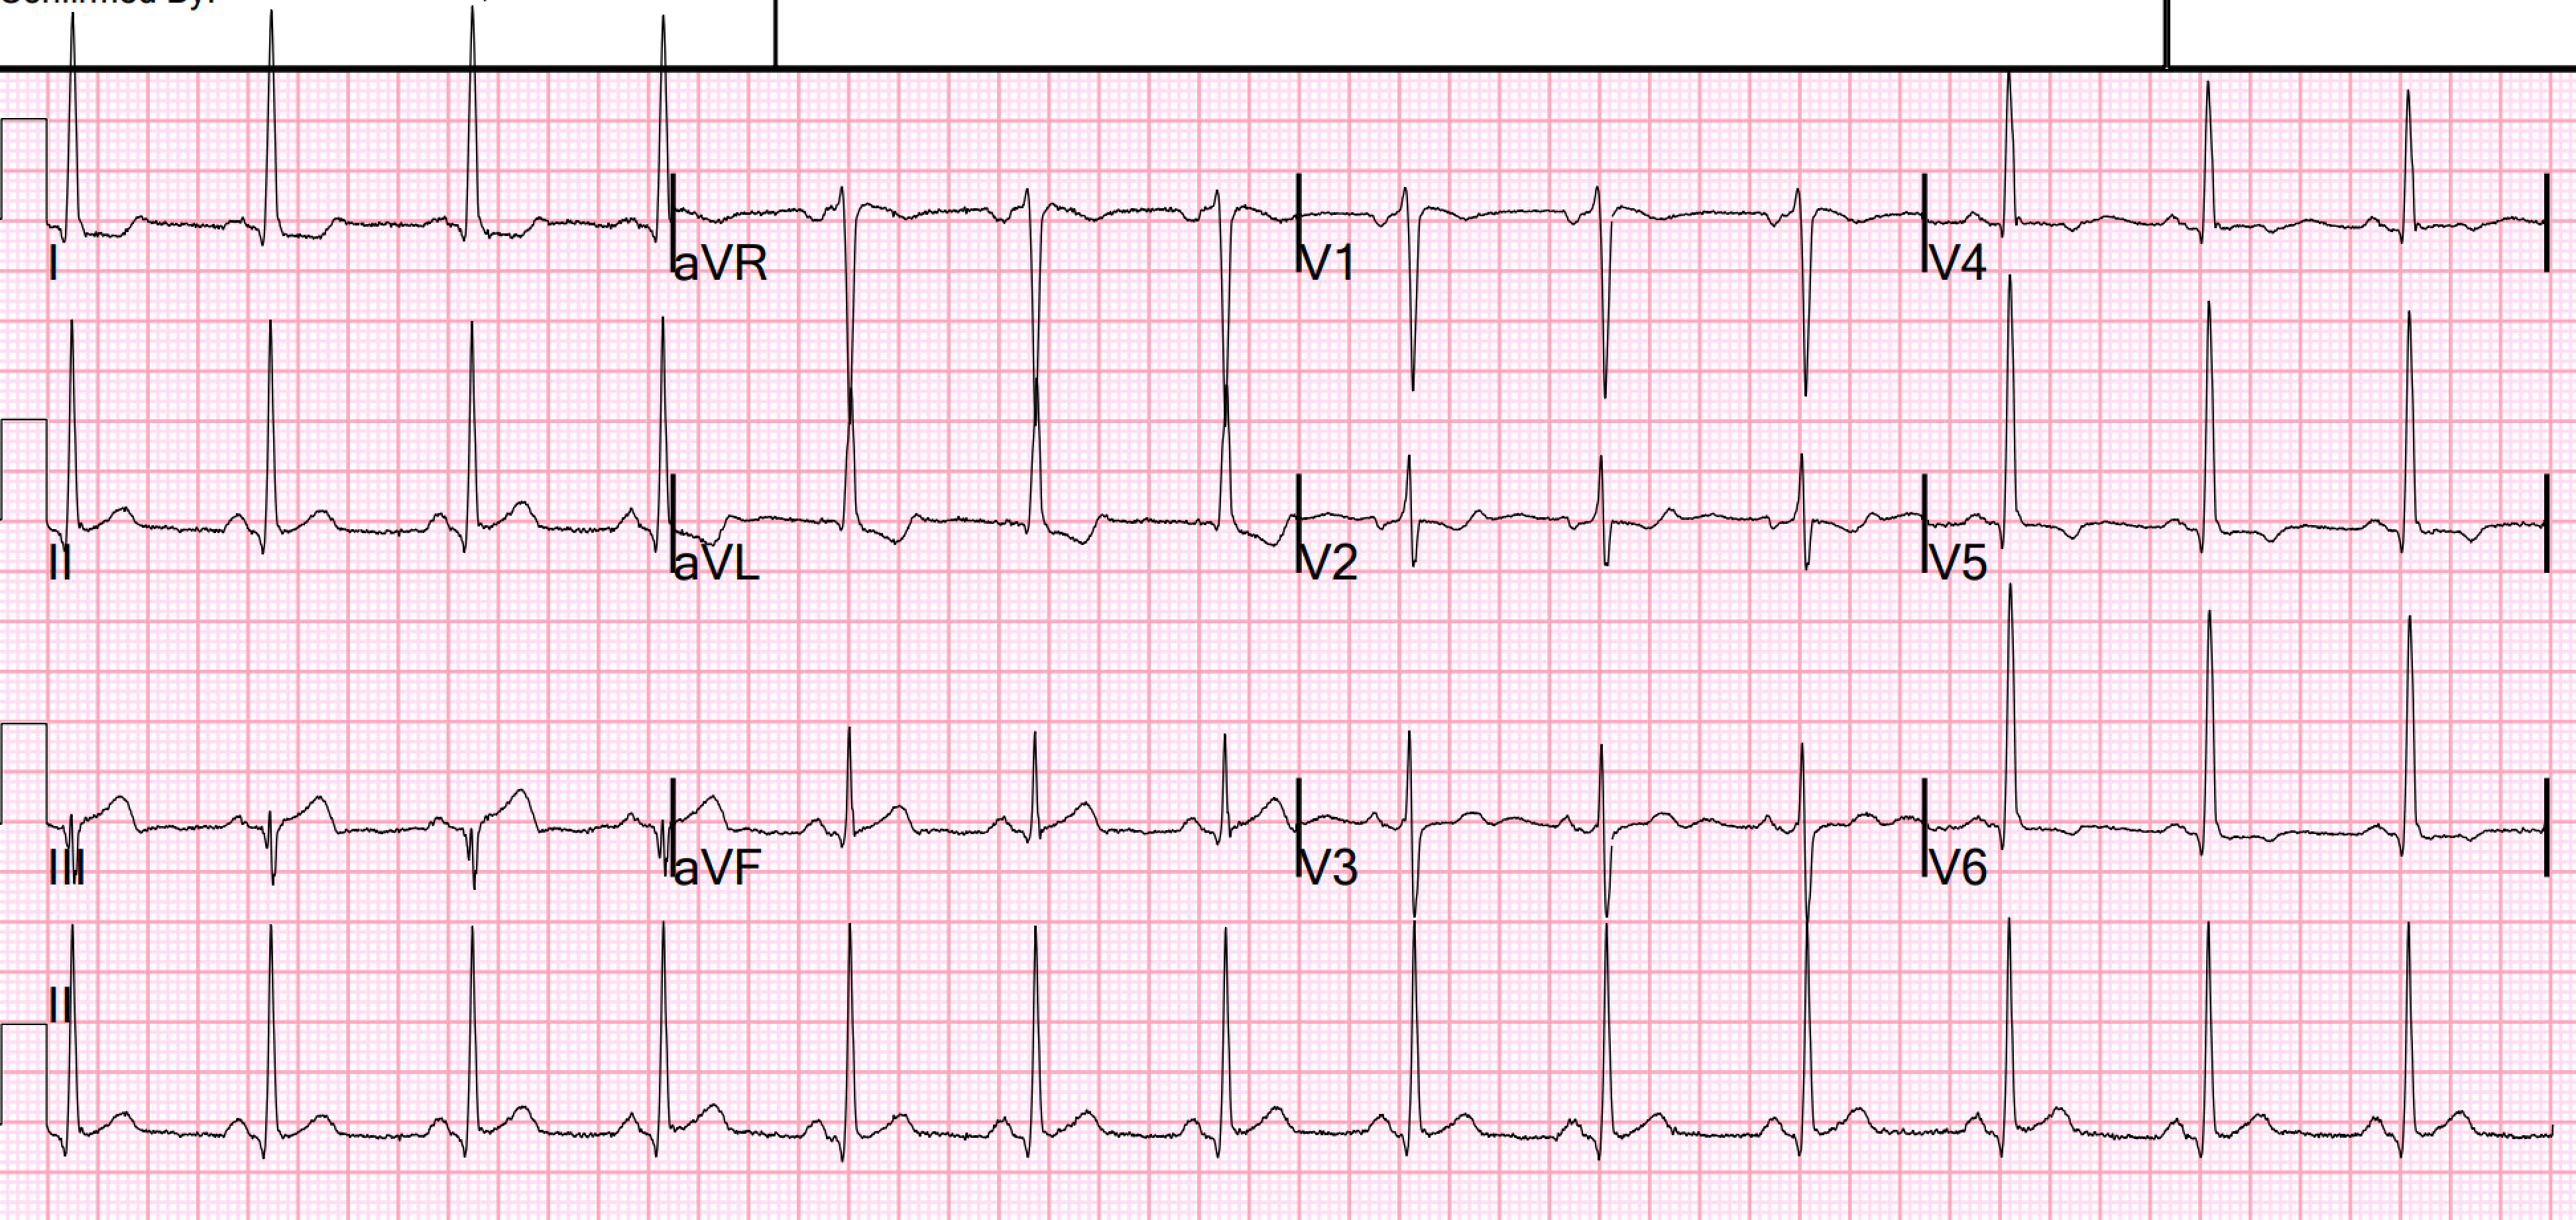
The ECG is diagnostic of acute inferior-posterior OMI.  This is what I texted back:

"It is tricky because it is in the setting of left ventricular hypertrophy. And I worry the cardiologist will say that it is all LVH. But I am quite certain that it is diagnostic of acute OMI.   And if you find an old one, it will not look like this."  

"See V2: there is downsloping ST segment .  The T wave in lead III Is too big for that small S wave. There is terminal QRS distortion in aVF.  The STT in aVF is not discordant as you would expect with LVH, and there is a straight ST segment."

I sent it to Pendell, and he immediately texted back:

"Nice inferior-posterior OMI.  Likely to be missed."

The MD who sent it to me is a highly skilled, fellowship trained ED ultrasonographer.  She did a bedside echo and did not see any wall motion abnormality.


Later, I heard the history:

A 40-something male with past medical history significant only for hypertension presented to the ED with acute onset of chest pain, associated with diaphoretic and shortness of breath.

At the time of the 2nd ECG, his chest pain is improving however still present.  No similar episodes of chest pain in the past. 


He had presented through triage (not by ambulance) 1.25 hours after pain onset, and the ECG was recorded another 27 minutes later (our ED is completely overwhelmed with patients who are "boarding" in the ED and in triage is thus also overwhelmed on a daily basis)


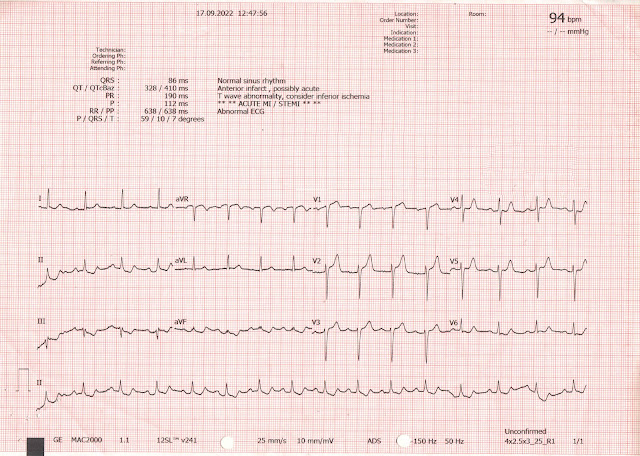
The cath lab was activated, and a 2nd ECG was recorded 55 minutes after the first one, while waiting for the cath team:

Slight increase in the previous findings.


Angiogram:

RCA: dominant. It supplies a medium sized RPDA (right posterior descending) and small RPLA (right posterolateral). It is thrombotically or embolically occluded in the distal segment at the bifurcation to the RPDA and RPLA.  It was successfully stented.


Formal Echo with Definity Bubble Contrast:

Decreased left ventricular systolic performance, mild; estimated left ventricular ejection fraction is 45%.

Regional wall motion abnormality- mid to distal inferior segments ("posterior" is no longer recognized as an echocardiogram wall, but this amounts to an inferior and posterior MI)


Highest hs troponin I measured (at 6 hours, after PCI -- which releases "pent up" troponin) = 24, 500 ng/L.


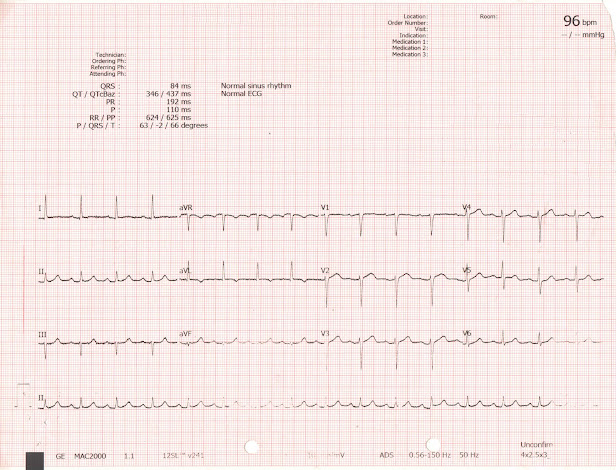
An ECG was recorded the next day:

Inferior Q-waves and reperfusion T-waves (inverted) with reperfusion T-waves in V2 and V3 (upright, enlarged)


1. LVH can mimic or obscure the findings of OMI
2. Not all large OMI that are evident on ECG can be seen on bedside echo.  Formal echo with bubble contrast is the only way to rule out wall motion abnormality.  It may be that Speckle Tracking could be nearly as good.

See these posts of Speckle Tracking Cardiac Echo in the ED:


===================================

MY Comment, by KEN GRAUER, MD (9/30/2022):

===================================

Today's post by Dr. Smith reinforces an important and always challenging concept — How to assess for OMI in a patient with LVH?
  • I focus my comment on a few additional aspects to those discussed above by Dr. Smith that I hope will be useful for approaching this diagnostic dilemma.
  • For clarity in Figure-1 — I've reproduced the initial ECG that was texted to Dr. Smith without the benefit of any history. For comparison — I have added the chest leads from a patient with LVH but no acute OMI (taken from the July 29, 2022 post in Dr. Smith's ECG Blog).

Figure-1: The initial ECG that was texted to Dr. Smith ( = ECG #1). Compare the chest leads of ECG #1 — with the chest leads in ECG #2 (which I've taken from the 1st case presented in Dr. McLaren's July 29, 2022 post in Dr. Smith's ECG Blog).


MY Thoughts on Today's Case:
As per Dr. Smith: Reasons why despite LVH — ECG #1 is diagnostic of acute infero-postero OMI include the following:
  • Per Dr. Smith: "There is a downsloping ST segment in lead V2"
  • Per Dr. Smith: "The T wave in lead III is too big for that small S wave. There is terminal QRS distortion in lead aVF — and the ST segment in this lead is straight".

To Dr. Smith's comments — I'd add the following:
  • The abnormal shape of the ST-T wave in lead V2 constitutes a positive Mirror Test. Even without LVH — the taller-than-expected initial R wave in lead V2 and the ST-T wave appearance in this lead instantly suggested to me that posterior OMI was likely  (Please see My Comment at the bottom of the page in our recent September 21, 2022 post — in which I review in detail my use of the Mirror Test).
  • In a normal tracing (ie, without LVH) — the ST segment in leads V2 and V3 is very often slightly elevated, with a gentle upsloping — that leads into a positive T wave. So in addition to the definitely abnormal shape of the ST-T wave in lead V2 — I immediately thought lead V3 in ECG #1 was highly suspicious of a continuation of an acute process.

  • Knowing that leads V2 and V3 were abnormal quickly convinced me that the disproportionately large (hypervoluminous) ST-T wave in lead III almost certainly represented a hyperacute T wave. And as soon as I found out that the patient in question presented with new-onset chest pain — the diagnosis of acute infero-postero OMI was assured until proven otherwise.

  • PEARL: In my experience, the fragmented QrS complex in lead III is virtually diagnostic of infarction at some point in time. Much more than a simple negative deflection (ie, Q wave) — the finding of an initial negative deflection (Q wave) — that then briefly turns positive (the small r that we see in lead III) — but which then promptly descends again (into the deep S wave) — is indicative of scar, and most often of infarction at some point in time. Given the hyperacute ST-T wave in lead III — this strongly suggests an ongoing acute process!


What Should ST-T Waves Look Like with LVH?
I've reviewed my approach to the ECG diagnosis of LVH on many occasions in Dr. Smith's ECG Blog (See My Comment in the June 20, 2020 post in Dr. Smith's Blog — among many others).
  • The presence of increased voltage on ECG without ST-T wave abnormality consistent with LV "strain" (or a "strain equivalent" pattern) — is not specific for true LV chamber enlargement. In such cases (IF there is a need to know) — Echo would be needed to distinguish between benign increased QRS amplitude on ECG vs true chamber enlargement.
  • In contrast — in a patient with the "right disease" (ie, heart failure, longstanding hypertension) — who is of a certain age (ie, younger adults often manifest increased QRS amplitude not due to chamber enlargement) — the finding of voltage criteria for LVH + ST-T wave changes of "strain" is more than 90% specific for true LV enlargement!

More about the Effect of LVH on the ECG:
Patients with marked LVH often manifest ST-T wave changes of LV "strain" in one or more leads.
  • Not all patients with Echo-proven LVH manifest LV "strain" on ECG. The Framingham Studies taught us that longterm prognosis is adversely affected when both voltage and repolarization changes of "strain" are present on ECG.
  • ST-T wave changes of LV "strain" are most commonly seen in one or more of the lateral leads (ie, in leads I, aVL; and/or V4, V5, V6). Typically — there is slow descent of the ST segment, with a more rapid rise at the end of the ST segment.
  • Some patients with LVH (especially if the frontal plane axis is vertical) — also manifest ST-T changes of LV "strain" in the inferior leads.
  • Some patients with especially deep anterior S waves — manifest the "mirror-image" picture of LV "strain" in the form of an upright ST-T wave, often with some ST elevation in these anterior leads.
  • The other major effect produced by LVH on ECG is that the increase in leftward and posterior forces forces may overshadow baseline anterior forces — with a "net result" that R wave progression is delayed (sometimes to the point of producing QS complexes in one or more anterior leads).

LV "Strain" — What About Today's Case?
The 2 ECG examples I provide in Figure-1 synthesize the above concepts:

ECG #1 in Figure-1:
  • Voltage criteria for LVH are fulfilled in multiple leads in ECG #1. These include: i) One or more limb leads with an R wave ≥20 mm; ii) R in aVL ≥12 mm; iii) Deepest S in V1,V2 + tallest R in V5,V6 ≥35; andiv) R in V6 ≥18 mm.
  • A classic LV "strain" pattern is seen in lead aVL (and to a lesser extent in lead I)To Emphasize — the slowly downsloping ST segment shape with more rapid return to baseline in lead aVL is so typical, that even with possible added effect from reciprocal OMI changes — I interpreted this ST-T wave appearance in these high-lateral leads as typical for LV "strain".
  • The patient in today's case is 40-year old man who has hypertension — therefore, he is clearly in a higher prevalence group likely to have true LVH.

  • KEY Point: Despite multiple leads showing markedly increased voltage — the chest leads in ECG #1 are remarkable because: i) There is no ST-T wave elevation in any of the anterior leads; andii) Although there is shallow T wave inversion in leads V5 and V6 — there is virtually no slowly downsloping ST segment depression in these leads (as would be expected in a patient such as this with so much other ECG evidence for true LVH with "strain").

  • BOTTOM LINE re ECG #1: Given the history of new-onset severe chest pain — the logical conclusion is that the lack of the typical LV "strain" changes in anterior and lateral chest leads is because the acute infero-postero OMI produced opposing ST-T wave changes that attenuated what we otherwise would have seen from LV "strain".

The Chest Leads in ECG #2 in Figure-1:
  • As mentioned above — the 6 chest leads in ECG #2 are from a patient with marked LVH but no acute OMI.

  • As sometimes happens — Instead of manifesting increased lateral chest lead R wave amplitude — this patient manifests exceedingly deep anterior S waves in leads V1 and especially V2 (I've outlined in RED the huge >30 mm S wave in lead V2).
  • Considering how deep the S wave in lead V2 is — the ST elevation with large, peaked T wave in this lead is not disproportionate — and was purely the result of marked LVH.
  • Although lateral chest leads V5 and V6 show no more than modest R wave amplitude — these leads nevertheless manifest an ST-T wave shape highly typical for LV "strain".

  • In CONCLUSION: Contrast a final time the appearance of ST-T waves consistent with LV "strain" in the anterior and lateral chest leads of ECG #2 — with the lack of such changes in the chest leads of ECG #1 (in which ST-T wave changes were attenuated by the opposing effect of the ongoing acute infero-postero OMI).


Sunday, September 25, 2022

A 50 year old with chest pain? What is going on? By Emre Aslanger.

Posted by Emre Aslanger, our newest blog Editor. Emre is a distinguished cardiologist in Turkey, and has published widely on the ECG in OMI and other areas.

Emre Aslanger Google Scholar Profile


A 50-year-old male with a 20 years’ history of diabetes mellitus treated with metformin only presents with chest pain that started 20 minutes ago. The pain radiates to left inner arm and is now about to resolve. His admission ECG is given below.

What do you think?


You can click on it to make it larger, but let's make it a bit easier to see here:

What do you think? (you can still click on it to make it larger)


Although the wandering baseline makes it a bit hard to interpret, ST-segment depression in inferior leads are quite evident. This should immediately urge the interpreter to look at high lateral (lead I and aVF) and anterior leads for subtle ST-segment elevation. There seems to be a subtle ST-segment elevation in aVL, which can be easily overlooked if interpreted in isolation. The ST-segment elevation in V1-3 is also highly suspicious. Moreover there is ST-segment depression in V4-6. All indicate a proximal left anterior descending artery (LAD) occlusion myocardial infarction (OMI), which sadly does not meet ST-elevation myocardial infarction (STEMI) criteria.


Despite this, the automated interpretation suggests acute STEMI!  


If you were use the LAD-normal variant STE formula (which is not advised when there is ST depression, which make normal variant all but impossible), you would get 18.89, which indicates LAD occlusion.


________

Smith comment: This is strange because the millimeter criteria for STEMI are not met.  How did this conventional algorithm (not a neural network) diagnose STEMI?

_______________

Smith and Meyers comment: We have posted several prior cases of STE in V1 with STD in V5, 6 due to LAD occlusion.  These seem to indicate septal MI, proximal to septal perforator (see below for other cases).  We have coined the term "Procordial Swirl" pattern based on the upward ST-segment shift usually seen in V1-V2/V3 and downward shift in V4/V5-V6, as shown in another example below. Please note: the most important mimic of the precordial swirl sign is seen in cases of LVH, which routinely have STD in lateral leads and STE in V1-V2. 


Here is another example of "Precordial Swirl":

_______________________


The clinician in charge was not sure and ordered ECG and troponin follow-up.


A second ECG was taken after 15 minutes. The patient said the pain was almost resolved. 


What do you think?


The subtle ST-segment elevation in lead I, aVL and V2 continues. The ST-segments in inferolateral leads are resolving, but there is still significant ST depression especially in lead III (this should always be considered to be reciprocal to high lateral STE, whether that STE is evident or not -- it is NOT "inferior (subendocardial) ischemia"!!  . Also note the tiny Q wave in V2. Even this ECG is highly suspicious, if not diagnostic, for anterior OMI !

__________

Smith comment


Since I started writing this blog, I have been making the point that "ST depression does not localize," meaning that ST depression in inferior, anterior, or lateral leads does NOT tell you that there is subendocardial ischemia in those leads.  This has been proven by many studies of stress ECGs.  ST depression in II, III, aVF is generally reciprocal to (often unseen) STE in aVL.


ST depression limited to Inferior leads is reciprocal to high lateral wall and represents STEMI


ST depression does not localize: 2 cases of "inferior" ST depression diagnostic of high lateral STEMI (references can be found here)

_______________


The first troponin (hsTnT) turned out to be 9 pg/dL (normal <14 pg/dL). [This is the same as the ng/L, the units used in most of the US and Europe].  As pain was then completely resolved, they decided to wait for a second troponin. 


__________

Smith comment: If the ECG is diagnostic, as it is here, waiting for the troponin is only acceptable if BOTH ECG and symptoms have resolved

__________


The second troponin came 69 pg/dL. A diagnosis of non-STEMI was made and a search for a PCI-capable center was commenced. 


Another ECG was taken at 4th hour.

Nearly all ST segment changes returned to normal. Note spontaneous reperfusion caused T-wave inversion in aVL and relatively bulky T-waves in inferior leads ("reciprocal reperfusion T-waves".) 


The patient was transferred to PCI-capable center. A third troponin at three hours after admission turned out to be 320 pg/dL.


Angiogram showed exactly what is expected: a thrombosed stenosis just before the first septal and diagonal artery. 


LAD lesion was successfully stented. The next day echocardiogram showed mid and apical anterior and septal dyskinesia with an ejection fraction of 40%. 


Take home messages:

  • A subtle ECG does not mean a mild, unimportant lesion.
  • Troponin lags and does not reflect the seriousness of the situation. 
  • Although this lesion is spontaneously reperfused, the risk of reocclusion is quite high and if it occurred, a significant amount of myocardium would be lost before reaching to catheter laboratory. These patients should urgently be taken to catheterization laboratory.
Research on the ECG in OMI:
If this case were in one of our studies, it would be considered a false positive EKG!!  Our methods in determining retrospectively if the artery was occluded at the time of the ECG recording require EITHER 1) TIMI 0/1 or sometimes 0/1/2 flow OR a culprit PLUS a very high troponin, which for high sensitivity Troponin T is above 1000 ng/L.  In this case, reperfusion was so fast that the peak was at 320 ng/L, and this case would be considered a false positive in one of our studies!!

See these other cases with precordial swirl sign:

A man in his 50s with "gas pain"


==================================
Comment by KEN GRAUER, MD (9/25/2022):
==================================
We welcome Dr. Emre Aslanger as our newest Associate Editor to Dr. Smith's ECG Blog! The problem he addresses in today's case relates to a "theme" well known to our readers: Recognizing subtle signs of an acute OMI that does not meet "STEMI criteria" — but which nevertheless needs prompt intervention.

For clarity and ease of comparison — I have reproduced the 3 serial tracings in today's case in Figure-1.
  • I find it easiest to appreciate the serial ECG findings highlighted by Dr. Aslanger — by lead-to-lead comparison — in association with close correlation to the clinical history.

Figure-1: Comparison of the 3 serial ECGs in today's case.


MY Thoughts on the Serial ECGs in Today's Case:
As is so often true — the History in today's case is KEY: The patient is a 50-year old man with the longstanding risk factor of diabetes. He presented to the ED with new-onset chest pain that began just 20 minutes prior to ECG #1
  • Not only does the presentation of today's patient immediately place him in a "high-prevalence" group for a likely coronary event — but the fact that he presented to the ED so soon (ie, within 20 minutes!) after the onset of symptoms: i) Makes it quite possible that any ECG findings found on his initial tracing will be subtle and not yet fully evolved; andii) Makes this patient an optimal candidate for maximum benefit from prompt intervention IF it turns out that he is in the process of evolving an acute cardiac event.

ECG #1:
The rhythm in ECG #1 is sinus arrhythmia at ~90/minute. The axis is normal at +15 degrees. The PR, QRS and QTc intervals are normal. No chamber enlargement.
  • Q waves — A tiny, narrow q wave is seen in lead aVL.
  • R Wave Progression — Transition (ie, where the R wave becomes taller than the S wave is deep) — is slightly delayed, occurring between leads V5-to-V6. Of NOTE (and potentially relevant given this patient's clinical course!) — is the fact that the R wave increases from lead V1-to-V2 — but then decreases from V2-to-V3 — increasing again in lead V4 — but inexplicably decreasing one more time from V4-to-V5. I thought this repetitive increasing-then-decreasing R wave progression strongly suggested one or more errors with chest lead electrode placement.

Regarding ST-T Wave Changes in ECG #1:
I counted ST-T wave abnormalities in no less than 11/12 leads!
  • I thought the most "eye-catching" ST-T wave abnormality was in lead V2. Although slight ST elevation is commonly seen as a normal finding in anterior leads V2 and V3 — this usually does not attain 2 mm, as seen in lead V2 of ECG #1. Even more remarkable is the disproportionately enlarged T wave in lead V2 (with respect to the QRS complex in this lead) — that in a patient with new-onset chest pain strongly suggests a hyperacute change.

  • Neighboring leads V1 and V3 also manifest taller-than-they-should-be T waves — that I interpreted as a continuation of the hyperacute change seen in lead V2.
  • Leads V4 and V5 manifest the unusual appearance of an initially downward-sloping ST segment — that evolves into disproportionate taller-and-fatter-than-they-should-be T waves.
  • This appearance of the ST-T waves in leads V4 and V5 made more sense to me when I considered anterior neighboring leads V1,V2,V3 (all of which show hyperacute T waves) — and the neighboring lateral chest lead V6, which shows primarily reciprocal ST depression (ie, leads V4 and V5 being obviously acute — manifest an intermediate picture to its anterior and lateral neighboring leads).

  • As per Dr. Aslanger — the overall picture of ECG #1 in this patient with new-onset chest pain strongly suggests acute proximal LAD OMI. This impression of proximal LAD occlusion is further supported by the subtle-but-real ST elevation in high-lateral leads I and aVL — and the reciprocal ST depression in all 3 of the inferior leads

  • QUESTION: How might the appearance of the acute ST-T wave changes seen in all 6 of the chest leads been altered — IF chest lead electrodes had been correctly placed?

  • BOTTOM LINE: Even before troponin results come back positive — this high-risk clinical presentation in today's patient with new-onset chest pain + abnormal ST-T waves in 11/12 leads, including multiple leads with hyperacute T waves — clearly justifies prompt cath after this 1st ECG.

ECG #2:
It's important to emphasize how optimal it is that the initial ECG was repeated in just 15 minutes! The need for quickly repeating the initial ECG became especially important in today's case when the patient's clinical condition changed! (ie, His chest pain had almost resolved within 15 minutes after ECG #1 was done!).
  • Interpretation of ECG #2 is best accomplished by direct lead-by-lead comparison (which is facilitated by side-by-side viewing of the first 2 ECGs in today's case, as shown in Figure-1).
  • Although subtle — there is definitely less ST elevation in lead V2 of ECG #2 — and there is no longer any ST elevation at all in lead V3. The T waves in these 2 leads clearly look less hyperacute.
  • In lead V1 — Not only has the ST elevation completely resolved in ECG #2 — but instead of the straight ST segment takeoff seen in the 1st ECG, the ST segment is now distinctly flat.
  • In the lateral chest leads (V4,V5,V6) — although T wave size has not appreciably changed — there is no longer ST segment flattening or depression in any of these leads.
  • In the inferior leads — the reciprocal ST depression previously seen in ECG #1 has now almost resolved.
  • In lead aVL — the T wave has become smaller in ECG #2.
  • The only lead not to show any ST-T wave change is lead I.

Putting It All Together:
Although only 15 minutes passed between the time that ECG #1 and ECG #2 were recorded — the patient's chest pain virtually resolved during this period and at the same time, there was improvement in ST-T wave morphology in 10/11 leads that showed abnormalities in ECG #1. This qualifies as clear evidence of "dynamic" ST-T wave changes in a patient who presented to the ED for new chest pain less than 1 hour earlier.
  • As per Dr. Aslanger — Acute proximal LAD OMI should be assumed until proven otherwise. Although relief of chest pain and resolution of acute ST-T wave changes suggests spontaneous reperfusion of the occluded vessel — the risk of reocclusion remains high.
  • Troponin may not become significantly elevated if the period of vessel occlusion is very brief (ie, when there is rapid spontaneous reperfusion). The decision to perform cardiac catheterization should not have to wait for troponin to become elevated.
  • Clinically in Today's Case Conditions could not have been better for potential optimal benefit from prompt cath with PCI of the "culprit" vessel to prevent reocclusion.

ECG #3:
To Emphasize — Prompt cath was indicated in today's case, if not immediately (after ECG #1) — then 15 minutes later after ECG #2.
  • Although ECG #3 was not needed for diagnostic purposes — interpretation of this 3rd tracing adds further support to the conclusions drawn from review of the first 2 ECGs. As per Dr. Aslanger — Chest lead ST-T wave changes have essentially normalized in ECG #3 — with reperfusion changes evident in the limb leads (ie, T wave inversion in lead aVL — and flat ST segments with bulky inferior T waves).


Thursday, September 22, 2022

A man in his 50s with acute chest pain without STEMI criteria. Trop negative. Cath lab cancelled. But how about the ECG and echo?

Case submitted by Matt Tanzi MD, written by Pendell Meyers


A man in his early 50s presented with substernal chest pain and that started 1 hour prior to arrival. There was some radiation to the left jaw and diaphoresis. He had ongoing pain on arrival.

Initial triage ECG:

What do you think?


I sent this to Dr. Smith who immediately replied that it is diagnostic of OMI, but difficult to tell whether it is 1) anterolateral with de Winter morphology, or instead 2) A combination of Aslanger's pattern (inferior OMI with single lead STE in III and reciprocal STD in I, aVL, plus widespread STD of subendocardial ischemia) with posterior (V2 STD) and RV extension (V1 STE). In other words, does V2 indicate ST depression of posterior OMI? or is the ST depression and hyperacute T wave indicative of de Winter hyperacute OMI morphology of the anterior wall? It is difficult to tell, but either way: OMI needing reperfusion.

The ECG shows sinus tachycardia, grossly normal QRS complex, ST depression from V2-V6, and in I and aVL. There are possibly hyperacute T waves in V2 (maybe also V3 and V4), constituting de Winter morphology (hyperacute T wave taking off from depressed ST segment). V1 has a tiny amount of STE and a hyperacute T wave also. The ECG overall is diagnostic of OMI.


The cath lab was activated. He received aspirin and heparin bolus. The cardiologist immediately evaluated the patient and stated that the ECG did not meet STEMI criteria, so the cath lab was cancelled. The cardiologist stated that they should try nitroglycerin and see if that controls the pain. 

He was given sublingual nitro and then a continuous drip.


ED2 Post nitro:

Mostly similar, but ST segments in V3 and V4 have risen. Still de Winter morphology in V2, I, and aVL.


At this time, POCUS was performed by the ED team and is shown below:


I believe the POCUS clips above show a clear anterior wall motion abnormality.


The patient had ongoing chest pain. The ultrasound was reviewed with the cardiologist and together they reactivated the cath lab, about 25 minutes after the initial cancellation.


If you had waited for the initial (conventional prior generation) Troponin T, it was undetectable (less than 0.01 ng/mL).


Angiogram results:

Prox LAD 99%, thrombectomy (no TIMI flow listed)

"Distal nitroprusside administration and distal LAD thrombectomy performed with improvement in no reflow."

"Integrellin double bolus given in lab. Continue Integrelin for 18 hours."


Post cath ECG:

What do you think? What has changed?


Now there is RBBB (the right bundle is supplied by the LAD in all cases I am aware of), with persistent concordant STE in precordial leads, as well as Q-waves in V1 and V2. In the situation of LAD OMI, this ECG does not yet show significant signs of reperfusion, and may instead be concerning for No Reflow phenomenon, meaning lack of downstream perfusion despite epicardial intervention. 


Formal echo next day:
Severely reduced global LF systolic function, EF 25%
WMA: mid anterior, mid anterolateral, mid inferior, mid anterior septum, inferior septum, entire apex, all severely hypokinetic 
No evidence of clot with usage of echo enhancing agent. Swirling of contrast in LV apex consistent with low flow state
Normal RV systolic function


Peak Troponin T = 4.94 ng/mL (large MI, similar to the average STEMI+OMI in our data of 265 OMIs, using the same assay, which had mean and median peak troponin T of 5.50 and 3.78 ng/mL)  


Discharge ECG:

Persistent RBBB. The Q wave in V1-2 has widened, concerning for LV aneurysm morphology in RBBB. There is conspicuous lack of reperfusion T wave inversions in anterolateral areas, which would usually be present if there had been meaningful reperfusion. This ECG further supports No Reflow and long term poor outcome.


Learning Points:

When the OMI is most hyperacute, when there is maximal tissue to be salvaged by emergent reperfusion therapy, the troponin is lowest and there is very often insufficient STE to meet STEMI criteria. We have shown that, even in OMIs that DO meet STEMI criteria,  expert ECG interpretation can identify OMI hours sooner than STEMI criteria. Would you like your EM physician and cardiologist to be ECG experts? or just use STEMI criteria?

When the ECG is not diagnostic to a provider, immediate bedside echo can help to diagnose OMI.

The LAD supplies the RBBB and LAFB. New RBBB/LAFB in OMI is a sign of extremely dangerous LAD OMI.

No Reflow phenomenon indicates inadequate downstream reperfusion and is diagnosable by ECG.


===================================

MY Comment, by KEN GRAUER, MD (9/22/2022):

===================================

I liked this case — because it presents yet one more variation in the de Winter T Wave Pattern that we all need to recognize.

  • For clarity — I have reproduced and show together in Figure-1 — the first 2 tracings in today's case.


Dr. Meyers showed Dr. Smith and myself the 1st ECG in today's case, initially without the benefit of any history. As noted above — Dr. Smith was immediately suspicious of, "de Winter, LAD OMI".


I focus my comment on my slightly different response. I replied as follows for my interpretation of ECG #1:

  • "Sinus tachycardia — some potentially significant Q waves (in leads aVL, V1,V2) — and LOTS of ST depression, which interestingly is most marked in lead V2 (!), as well as in high-lateral leads I and aVL. In addition — there is ST elevation in “opposing” leads (ie, especially in lead aVR — but also in leads III and V1)."
  • My Impression of ECG #1 was: "Diffuse subendocardial ischemia in a patient with multi-vessel disease (and probably some prior events). IF associated with a history of new chest pain — then this patient should clearly undergo prompt cath to define the anatomy."

The reason why I did not promptly recognize de Winter T Waves (as Dr. Smith immediately did) — was because I didn't see very tall T waves arising from the marked J-point ST depression.
  • The "Take Home" point for me regarding today's case — was that the simple reason I didn't see the very tall anterior T waves usually associated with de Winter T Waves — is that we were seeing this extensive anterior infarction at a very early stage in the process before the T waves had a chance to enlarge.

  • I believe the process in today's patient did begin with diffuse subendocardial ischemia (supported by the diffuse severe hypokinesis on formal Echo done the following day). 
  • Then followed initial marked J-point ST depression (in leads I, aVL and V2 — as seen in ECG #1 of Figure-1) — with development of terminal T wave positivity in these 3 leads.
  • And as we look back on ECG #1 (after seeing the subsequent serial ECGs that evolved) — those Q waves I pointed out in ECG #1 were in fact early indicators of the infarction to come.

  • The follow-up ECG (ECG #2 — done a short while later) — then showed progression of extensive evolving infarction. Specifically — the amount of J-point ST depression in leads I, aVL and V2 is much less in ECG #2 (with reduction in the amount of ST depression in other chest leads) — and T waves in multiple leads (ie, leads I, II, aVL; V2,V3,V4) are becoming larger and "fatter"-at-their-peak (ie, more hyperacute).

Figure-1: The first 2 ECGs in today's case.


Additional Learning Points from Today's Case:
We continue to frequently review the gamut of de Winter T Wave "variants" in Dr. Smith's ECG Blog (See the May 2, 2019 post — among many others).
  • I discussed in detail in My Comment at the bottom of the page in the July 11, 2022 post — how common it is to see "variations on the theme" of de Winter T Waves. In the interest of brevity — I'll simply reproduce in Figure-2, my adaptation from the original manuscript by de Winter et al, published in this 2008 NEJM citation — which shows you 8 selected ECG presentations from his series of patients.
  • I've seen scores of other variations of de Winter T Waves. I have added to "My Mental List" — the additional ECG variation seen in ECG #1 from today's case, in which we catch a very early glimpse of de Winter T waves evolving from initial diffuse subendocardial ischemia.

  • P.S.: Clinically — the fact that I did not recognize de Winter T waves as soon as Dr. Smith did in today's case does not matter — because regardless of what you call the picture of ECG #1 in Figure-1 — in a patient with new-onset chest pain — prompt cardiac cath is clearly indicated. Unfortunately that was not done in today's case

Figure-2: The de Winter T Wave Pattern, as first described by Robbert J. de Winter et al in N Engl J Med 359:2071-2073, 2008. ECGs for the 8 patients shown here were obtained between 26 and 141 minutes after the onset of symptoms. (See text).


Recommended Resources