Saturday, July 31, 2021

Pancreatitis with Bizarre T-wave inversions and a normal echo. Is it takotsubo?

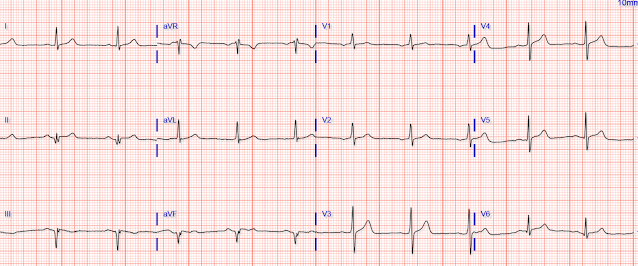
I was shown this ECG and told that the patient is suffering from another bout of chronic pancreatitis.  I was told there was no chest discomfort or SOB. 

What do you think?


I said "this looks like takotsubo".

With this ECG and the presumptive diagnosis of pancreatitis, takotsubo stress cardiomyopathy is by far most likely.  It is possible that it is due to ACS, but the bizarre diffuse T-wave inversions with a very long QT are nearly pathognomonic of takotsubo.  (They can also be seen in apical hypertrophic cardiomyopathy, but this patient did not have any such history and previous ECGs were different)

If it is takotsubo, there is usually apical ballooning on echo.  

If it is ACS, it would need to be anterior and inferior ACS, and there will often be corresponding wall motion abnormalities.  Apical ballooning can appear very much like anterior + inferior WMA, so echo does not necessarily distinguish the two.  

However, absence of any WMA is very unusual for takotsubo, but not unusual for Non-OMI.  

POCUS echocardiogram was done but was NORMAL!

Thus, we must strongly suspect that this is myocardial infarction (takotsubo is classified as non-MI myocardial injury)

Electrolytes were normal and the only QT prolonging medication on the list was ondansetron.  We do not know how much ondansetron he was taking.

The first troponin returned elevated at 271 ng/L.  There were previous troponins from 2 visits about 4 and 5 weeks before.

Looking back, he presented several times recently:

     ------------------------------- 4 weeks prior, visit 3 (4 serial values)--------------------// --5 wks prior, visit 2

                                                                                                                                                   1 value


Here is the history of this presentation (presentation 5): 

The patient had 9/10 epigastric pain that radiated to the back for almost 24 hours associated with alcohol intake, with nausea and vomiting, and it feels similar to previous chronic pancreatitis.  

But he also has substernal chest burning with SOB.   Was he having pancreatitis AND acute MI?


Let's go back and look at previous visits.

Presentation 1

T-wave inversion, nonspecific but consistent with ischemia.  No troponins measured.

Previous from 3 months prior
No evidence of ischemia

__________________________________


Presentation 2, abd pain 

TWI is resolved


Abd pain again on presentation 3

TWI again

Diagnosis at this visit was chronic pancreatitis, with troponins at 7, 8, 8, and 8 ng/L; he was admitted for pancreatitis.


Presentation 4.   Altered ms, no ekg, no troponins


Presentation 5 (the one we are presenting, first ECG above at the top, and shown again here)

This is the same ECG you saw above


Presentation 5 - serial troponins

    time (hours)              24                 16                15                6                 2.5               0


Presentation 5 -- follow up ECGs -- 18 hours

About the same


42 hours


66 hours


90 minutes after PCI


Formal Echo also was nearly normal, with a possible suggestion of "apical takotsubo"


So he underwent angiogram:

LMCA: No angiographic significant obstructive disease.

LAD: Type III LAD is noted. Severe calcification is present. LAD distal to large LADD1 has 80%. Proximal to LADD1 has a 60% assessed via iFR 0.84.  Pre procedure TIMI III flow was noted for proximal lesion.

LCx: Proximal LCX has indeterminate , 60% disease assessed via FFR 0.80, iFR 0.98

OM1 large with a large lateral segment

Distal LCX before the LPL1 has a 80-90% stenosis

Lesion on Prox CX: The Proximal segment of the RCA has 60-70% disease.  The Distal segment of the RCA has 90% disease.  RPDA diffusely diseased.


Cardiology thought process here:

EKG shows deepening T wave inversions and prolonged QT throughout first hospital day. DDx for TWI and QTc prolongation includes stress CM (takotsubo), HOCM, intracranial bleed, and cardiac ischemia. TTE not entirely convincing of HOCM but cannot rule out apical HOCM. Stress CM also cannot rule out. Reviewing previous imaging, he does have extensive calcifications of his coronary arteries. Angiogram was completed and revealed 3 vessel coronary artery disease involving the LAD. After discussion with patient and CT surgery decision was made to pursue PCI. Stent was placed in the proximal and mid distal LAD 7/08. 

Successful PCI to LAD/Diagonal with adjunctive rotational atherectomy, excellent angiographic result with residual apical LAD stenosis that was appropriate to defer. Due to procedural length and probable LAD "culprit", will defer treatment of Cx and RCA. Will need 12 months of clopidogrel-based DAPT, high-intensity statin therapy, oral beta blockade, and ACEi - if BP tolerates - in the setting of "anterior unstable angina".  Smith comment: This last bit is clearly a mis-statement, as this ACS is acute MI, not unstable angina.


Learning Points:

1. If you think it is takotsubo, but the echo is not consistent, then think ACS.

2. Patients may have 2 pathologies at the same time (Hickum's dictum).  This patient definitely had pancreatitis on at least one visit, but also had either or both of takotsubo AND ACS.

3. Takotsubo and Acute MI may be very difficult to differentiate on ECG, whether they present as ST Elevation (OMI vs. OMI mimic) or with bizarre T-wave inversion (Non-OMI vs. Non-OMI mimic).  

4. They may even be difficult to differentiate by echo, and even by angiogram (was it a culprit or not?  The angiographer thinks so, but I think he was not certain)

5. Takotsubo should have obvious diffuse wall motion abnormalities resulting in apical ballooning.


Monday, July 26, 2021

Computer says "normal," troponin undetectable.

This was written by @BrooksWalsh, with one comment by Smith

A middle-aged guy comes in with chest pain. No known cardiac disease, and he’s healthy enough that he was hiking in some hilly terrain when he developed the symptoms..

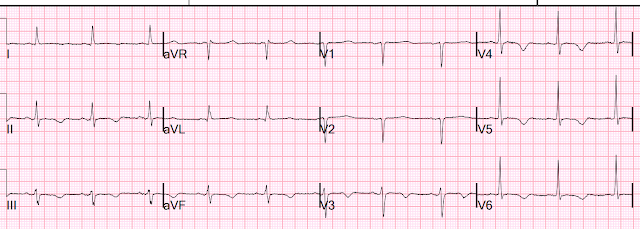
He comes into the ED, and they get an ECG which shows…


… and is read by the computer as:


Very reassuring, especially in the context of evidence that a computer interpretation of “normal” is “unlikely to have clinical significance that would change triage care.” 

(HINT: this paper is very flawed, as Litell, Meyers and Smith point out in this article: 

Emergency physicians should be shown all triage ECGs, even those with a computer interpretation of "Normal"


Also, the troponin (not high-sensitivity) is undetectable, so is this guy is ready for d/c, amirite?

“Not so fast” you say?


For starters, it would be reasonable to ask how soon after symptom onset the troponin was drawn - it was within 1-2 hours, a bit too soon to use a single marker. Also, perhaps serial ECGs would be preferred? Ah, we’ll get to that later.

But first, long-time readers of this blog are unlikely to fall for the “Computer said the ECG was normal” ploy. But you can’t call out the cath team based on reverse psychology, so let’s take a closer look at the ECG!


Close up of ECG


Scrutinizing the ECG, we can see that there’s some subtle ST segment elevation in leads III and aVF.


The ST elevation is mild, though, < 1 mm in both leads. And of course this can happen in pericarditis, say, or early repolarization.

However, what should raise some concerns is the ST segment in the oft-neglected aVL:


Looks like a bit of ST depression here, and while it isn’t a lot, it’s all we need! In the context of inferior STE, if there is any STD in aVL then pericarditis is almost completely ruled-out, and acute coronary occlusion is very likely!


Smith comment: in the context of a presentation compatible with ACS, this so-called "normal" ECG is DIAGNOSTIC of inferior Occlusion MI [This is a STEMI (-) OMI as it does not meet 1 mm STEMI criteria].  It can't be anything else.  Activate the cath lab, don't wait for the troponin and, if you do, ignore it if "negative."

Continued

About those serial ECGs…

A doctor with a keen eye noted the subtle STD in aVL, and called out the troops (not the trops).

A second ECG was a bit more flagrant!


Even more diagnostic of inferior OMI

Resolution


Following the expeditious placement of a stent in the right posterior descending artery, the patient recovered quite nicely. Some corresponding regional hypokinesis was found on echo, and a follow-up ECG showed some inferior Q waves.


Had the initial ECG led the clinicians to label this as a “non-STEMI,” however, things might not have evolved so well - let alone if he had been discharged!


Here are 29 other posts in which the computer made a grave error of "normal ECG":

Wednesday, July 21, 2021

Hypotension, altered mental status, and aVR sign - activate the cath lab?

 Written by Lucas Goss MD, peer reviewed by Pendell Meyers, Alex Bracey, Stephen Smith


An 81 year-old female with PMHx of ESRD on hemodialysis, normal NM stress test in 2020, TAVR on warfarin, atrial fibrillation, diastolic heart failure, obesity, diabetes, hypertension, and CVA was brought into the ED by EMS for altered mental status and hypotension that began near the end of her dialysis session. Upon EMS arrival to her dialysis facility, they were unable to obtain a blood pressure. EMS recorded a prehospital ECG that looked identical to the initial ED ECG shown below, and EMS called the ED physician concerned about the patient and the ECG, asking whether the cath lab should be activated:

What do you think?


ECG Interpretation

Sinus rhythm 1st degree AV block, with a few PACs or PJCs (causing a few periods of regularly irregular rhythm)

The QRS is approximately 100ms, with morphology suggestive of LAFB

Diffuse ST depression that is maximal in V4-V6 and lead II, with obligatory reciprocal STE in aVR


Impression

Findings consistent with diffuse supply demand mismatch, without signs of focal occlusion. As we have explained many times on this blog, the differential of this ECG pattern is huge, including non-occlusive ACS (such as acute left main ACS, triple vessel disease with nonocclusive culprit), or any non-ACS cause of either/both decreased supply or decreased demand. The list of causes for this latter possibility is far too long to list, but common causes include hypotension, hypoxemia, sepsis, GI bleed, etc. 


Case Continued

Before the patient had arrived in the ED, the ED providers were initially concerned for ACS because of "aVR sign". Because of this concern, they immediately paged cardiology and asked that they come down to the ED to evaluate the patient on arrival. The patient was immediately brought back to a resuscitation room.

Upon arrival to the ED, the patient’s vital signs were notable for BP of 82/67, HR in the 60’s, and saturating well on room air. From the available documentation, it sounds like the patient was somewhat somnolent on arrival, and it is unclear to me whether she could confirm or deny chest pain or other symptoms.

The patient was undressed and noted to have a massive amount of melena. At this point the working diagnosis was changed to massive GI bleeding.

A central line was placed and she began receiving massive transfusion protocol, TXA, and vasopressors. She was found to be acidotic with a hgb of 5.4 (down from 9.7 one week earlier), lactate of 12, INR was unreadably high, and significant elevation of LFTs. Initial troponin was 89. After intubation she lost pulses and suffered a brief PEA arrest that responded to 1mg of epinephrine and 1 round of compressions.

Unfortunately she remained too unstable for endoscopy and continued to have GI bleeding. She suffered another cardiac arrest and was made DNR shortly into her hospital stay. 


Learning Points

STE in AVR with diffuse ST depression is NOT diagnostic of left main or severe triple vessel disease. Rather, it is most commonly representative of diffuse subendocardial ischemia or supply/demand mismatch. The causes of this finding are vast and include sepsis, hypoxia, PE, tachyarrhythmias, GI bleeding, etc., as well as ACS. It depends almost completely on the clinical situation.

Note that this is in contrast to ST depression in leads V1-V4 which is typical of posterior OMI. With diffuse subendocardial ischemia, there will be STE in AVR with diffuse ST depression that is maximal in V5, V6, and lead II.

If a patient demonstrates this EKG finding despite fixing their oxygenation, hypotension, tachyarrhythmia, etc. and this finding persists on EKG it may be indicative of left main or severe triple vessel disease. However, until all of the other physiologic derangements are fixed, this is a non-specific finding that merely demonstrates diffuse subendocardial ischemia.

Imagine if the patient had been given aspirin and heparin for NonSTEMI!

See some of our other related posts:

ST Elevation in Lead aVR, with diffuse ST depression, does not represent left main occlusion

Global ST depression with ST elevation in aVR - what is the cause?


A man in his 50s with witnessed arrest and ST elevation in aVR


The below comes from this post:


Extreme widespread ST depression, with ST Elevation in aVR. What do you think?

Learning point

Most widespread ST depression, with STE in aVR is NOT due to ACS.  See 2 papers referenced below.

The differential diagnosis for widespread ST depression with STE in aVR is anything that can cause supply demand mismatch.  So anything that   Some important ones are listed here:
1. Valvular disease
2. Severe anemia
3. Severe hypoxia
4. Hypotension, especially diastolic hypotension
5. Hemoglobinopathies or cellular toxins
6. Severe LVH or HOCM, which prevents adequate perfusion
7. Extreme tachycardia
8. Extreme hypertension
9. Lesser degrees of any of the above, if combined with fixed coronary stenoses.

Acute coronary syndrome.  Severe Left Main stenosis (not occlusion!) or LAD, or single vessel ACS with 3 vessel disease.

The ECG does not differentiate the above etiologies, it simply signifies that there is severe diffuse global supply-demand mismatch, whatever the etiology.

LVH, LBBB, RBBB, and RVH may manifest ST depression without any ischemia!

Other cases:
2 cases of Aortic Stenosis:


An elderly man with sudden cardiogenic shock, diffuse ST depressions, and STE in aVR

Literature

1. Knotts et al. found that such ECG findings (STE in aVR) only represented left main ACS in 14% of such ECGs: 

Only 23% of patients with the aVR STE pattern had any LM disease (fewer if defined as ≥ 50% stenosis). Only 28% of patients had ACS of any vessel, and, of those patients, the LM was the culprit in just 49% (14% of all cases).  It was a baseline finding in 62% of patients, usually due to LVH.

Reference: Knotts RJ, Wilson JM, Kim E, Huang HD, Birnbaum Y. Diffuse ST depression with ST elevation in aVR: Is this pattern specific for global ischemia due to left main coronary artery disease? J Electrocardiol 2013;46:240-8.

2.  Now there is a paper published in 2019 that proves the point beyond doubt, though makes it clear that this pattern is associated with very high mortality.

https://www.sciencedirect.com/science/article/abs/pii/S000293431930049X
Harhash AA et al. aVR ST Segment Elevation: Acute STEMI or Not? Incidence of an Acute Coronary Occlusion.  American Journal of Medicine 132(5):622-630; May 2019.

Here is the abstract:

Background
Identification of ST elevation myocardial infarction (STEMI) is critical because early reperfusion can save myocardium and increase survival. ST elevation (STE) in lead augmented vector right (aVR), coexistent with multilead ST depression, was endorsed as a sign of acute occlusion of the left main or proximal left anterior descending coronary artery in the 2013 STEMI guidelines. We investigated the incidence of an acutely occluded coronary in patients presenting with STE-aVR with multi-lead ST depression.

Methods

STEMI activations between January 2014 and April 2018 at the University of Arizona Medical Center were identified. All electrocardiograms (ECGs) and coronary angiograms were blindly analyzed by experienced cardiologists. Among 847 STEMI activations, 99 patients (12%) were identified with STE-aVR with multi-lead ST depression.  
Smith comment: this is a very limited population, as it only includes those with STEMI activations.  There are likely many other patients with STE-aVR who did not get a STEMI activation as they were not suspected of having ACS.

Results

Emergent angiography was performed in 80% (79/99) of patients. Thirty-six patients (36%) presented with cardiac arrest, and 78% (28/36) underwent emergent angiography. Coronary occlusion, thought to be culprit, was identified in only 8 patients (10%), and none of those lesions were left main or left anterior descending occlusions. A total of 47 patients (59%) were found to have severe coronary disease, but most had intact distal flow. Thirty-two patients (40%) had mild to moderate or no significant disease. However, STE-aVR with multilead ST depression was associated with 31% in-hospital mortality compared with only 6.2% in a subgroup of 190 patients with STEMI without STE-aVR (p less than 0.00001).  
Comment: Again, this does not include the many STE-aVR patients who were not activated, so even fewer would have ACS, and mortality in this group is much greater than in all STE-aVR patients.

Conclusions

STE-aVR with multilead ST depression was associated with acutely thrombotic coronary occlusion in only 10% of patients. Routine STEMI activation in STE-aVR for emergent revascularization is not warranted, although urgent, rather than emergent, catheterization appears to be important.


Monday, July 19, 2021

See many morphologies of non-ischemic ECGs from the same patient

 I was reading ECGs on the system when I saw this one (ECG-1):

What do you think?


My read was "ST Elevation that is NOT ischemic".  

I suspected this strongly because it just doesn't "look right" for a STEMI, in spite of the clear STE in V3 and V4.  This STE appears to be due to LVH, even though the STE in V4 is concordant to the QRS.  

There were previous ECGs for comparison, so I looked at them:


The patient had presented 4 days earlier with chest pain and had several ECGs recorded:

Time zero (ECG-2):

Scary looking STE, but has features of benign STE, especially in V5 and V6: 
Tall R waves, relatively short QT interval, LVH voltage in V2 and V3, pronounced J-wave in V4 and slurring of the J-point in V5, V6.

There were previous ones to compare to at that time:

This is from 13 days prior (ECG-3):

Different, but it certainly suggests that ECG-2 is not ischemic.
This one has more features of standard LVH: high voltage and discordant STE in V2-V4, tall R-waves in V5 and V6.
But concordant STE in V5 is not really typical of LVH


This is from 3 years prior (ECG-4):

Different, but it certainly suggests that ECG-2 is not ischemic
This one has lots of concordant STE in V4-V6.


So serial ECGs were recorded on that presentation 3 days prior:

Time 17 min (ECG-5):

About the same as time zero (ECG-2)

Time 100 min (ECG:-6)

Very similar again


There was a bedside echo.  Here is the parasternal short axis:

This shows severe concentric LVH


Next AM (ECG-7)

Very similar again


On that previous visit, he had been diagnosed with NSTEMI based on hs troponins of 82 ng/L, then 97 ng/L, then 80 ng/L.  But he had always in the past had slightly elevated troponins.  

He did have an abnormal echo:

Normal left ventricular size, severely increased wall thickness. (i.e, LVH)

Moderately reduced systolic function; estimated LVEF 30-35%.

Regional wall motion abnormality-anterior, probable


So chronically elevated troponins are probably due to severe LVH.


But his angiogram was normal (a normal angiogram does NOT rule out ACS or even OMI at the time of the ECG)

On the presentation of ECG-1, he also had elevated trops with a rise and fall (92, 124, 69)


So is this a type 1 MI OMI, type 1 NOMI, or type 2 MI?


My opinion, and also that of the treating cardiologists: the ECG findings are NOT due to any OMI at any time.  They are due to a combination of LVH, benign ST Elevation, and benign T-wave inversion.    

The troponin elevations are due either type 1 Non-OMI or type 2 MI.  


What is certain is this:  all of these ECGs are compatible with a non-ischemic etiology, and you should remember the morphology and suspect that it may be non-ischemic when you see it.


Learning Points:

ECGs are very hard.  They require years of training, paying attention, recognizing patterns.  There are few easy paths to expertise.  

But some takeaways are that, when there is doubt:

1. Look for old ECGs

2. Do serial ECGs

3. Use bedside and formal echo


Friday, July 16, 2021

What is this rhythm? Is there AV block?

Case written and submitted by Elzada Sercus M.D., peer reviewed by Pendell Meyers, Steve Smith, and Ken Grauer


A 31-year-old female with a history of low blood pressure and episodes of lightheadedness developed near syncope on postpartum day one after an uncomplicated c-section. She has no other past medical history and does not take any medications. She has no family history of sudden cardiac death or premature coronary artery disease. Given the patient's near syncope, an ECG was obtained and when the patient was placed on continuous telemetry monitoring was found to have frequent PVCs. She did not experience any palpitations or sensation of heart racing during the episodes recorded.  She was not having any chest pain at the time the ECG was performed or at any point preceding or during her near syncopal episodes. 

Telemetry monitoring showed sinus rhythm with occasional bradycardia in the 40s-60s, as well as frequent PVCs. Blood pressure ranges were 98-113 mmHg systolic and 82-68 mmHg diastolic which were baseline for this patient. Potassium was 3.5 mmol/L and magnesium 1.6 mg/dL, otherwise all laboratory studies were within normal limits. Electrolyte repletion was ordered, and the ECG below was obtained:


What do you think? What is the rhythm? Is there any evidence of AV block?


Baseline ECG (taken 5 months prior):


Presentation ECG annotated:


ECG Interpretation:

Normal sinus rhythm (each QRS complex is preceded by a P wave) with frequent unifocal PVCs. There are normally conducted sinus beats (blue arrow) followed by PVCs (green arrow). Following the QRS there appears to be another atrial wave (red arrow) superimposed on the PVC's T wave, followed then by another narrow complex QRS with slightly different morphology than the normally conducted QRS (after the blue arrow). 


At first glance, it may appear that the atrial waves at the red arrow are different than those at the blue arrow. However, closer inspection reveals that they march out perfectly, and when considering the morphology of the ST segment and T wave without a superimposed P wave, these atrial waves are actually both upright and similar (probably identical). They are not inverted, and therefore not retrograde. Thus, the P waves are all sinus, throughout, without fail or change in rate.


Dr. Grauer has created images for us to understand the morphology of the P waves, as well as a ladder diagram showing the actual rhythm:


Here we add a red curved line showing the expected morphology of the ST segment and T wave of the PVC, if there had not been a superimposed sinus P wave. With this for reference, you can see that the superimposed P wave is in fact upright in this lead, not inverted.


Dr. Grauer's ladder diagram showing the exact rhythm events. 


Thus, the actual rhythm here is sinus rhythm with frequent, interpolated PVCs, a few of which make the AV node refractory at just the right time to block conduction of a sinus P wave.

There is no pathologic AV block.

The atrial and ventricular beats after the PVCs are not echo beats. An echo beat occurs when a ventricularly originating action potential (in this case, the PVC) proceeds retrogradely up the AV node, then causing a retrograde P wave which can "echo" back down and then proceed anterogradely back through the AV node, causing a narrow complex QRS. These P waves at the end of the PVC are not inverted, therefore not retrograde, and they are timed exactly at the moment when the sinus P waves should occur. They are simply sinus.

Meyers note: I initially thought these were echo beats, until Dr. Grauer pointed this out! A cardiologist was consulted for this ECG who gave a formal interpretation of echo beats as well. Luckily for the patient there was no danger from this rhythm, nor from the incorrect interpretation.


Electrolytes were repleted, PVCs were noted to be much less frequent, and mother and baby did well.


Learning Points:

Interpolated PVCs can sometimes cause the AV node to be refractory at the moment when the next sinus P wave would have conducted, causing physiologically normal blocked conduction. This is not pathologic AV block, but rather normal AV node function.

Echo beats occur when a ventricular action potential goes retrogradely up the AV node, then causes an inverted retrograde P wave, then "echoes" back down to the AV node anterogradely, then resulting in a narrow QRS. This case does not show echo beats, but could be mistaken for them.

Ladder diagrams can help understand and teach rhythms.

Anytime you find waves that march out perfectly, it is always more likely that they are from one source than two. Echo beats that happen to be perfectly timed with the sinus P waves is a stretch of logic, instead of realizing that they are simply all sinus P waves firing perfectly on time.

Thanks to Dr. Grauer for helping me understand this rhythm!


====================================

2 Useful LINKS on today's topics from Ken Grauer, MD (7/15/2021):

===========================


Tuesday, July 13, 2021

Which Modified Sgarbossa Rule does this meet? And what is the Rhythm?

A reader sent this ECG and asked "Steve, can this be hyperK?"  He sent no clinical information.

What do you think?


My answer: "This is inferior OMI."  There is LBBB and an with a false negative Modified Sgarbossa."

The rhythm is also interesting, but does not affect the diagnosis of OMI: there are also no P-waves before the QRS complex.  The wide complex suggests an idioventricular rhythm, in fact it is an accelerated junctional rhythm followed by Left Bundle Branch Block (LBBB).  Idioventricular rhythm would have a slower QRS onset, similar to VT (and it can't be VT also because it is too slow).  So this is an accelerated junctional rhythm with retrograde P-waves and LBBB). (I confirmed this with the rhythm master, Ken Grauer, who annotated the 2nd EKG below to show the retrograde P-waves).

There are obvious hyperacute T-waves in inferior leads and also in V5 and V6, but it does not clearly meet any of the 3 Smith Modified Sgarbossa criteria.  There is some minimal concordant ST elevation in lead III (some might measure 1 mm, but it is not consistent in the only 2 complexes), and just less than 1 mm of concordant ST depression in V1-V3.  There is also no ST elevation that is greater than 25% of the preceding S-wave (no proportionally excessively discordant ST Elevation).  

But there is one other rule that we derived and validated as VERY SPECIFIC, though probably not sensitive, for OMI: Discordant ST depression (or STE) that is out of proportion to the preceding R-wave (or S-wave) in just one lead with an ST/S or ST/R ratio of at least 30%.  If greater than 30%, it is nearly 100% specific.  Lead aVL has 1.25 mm ST depression and 3.75 mm R-wave, for a ratio of 33%.

Some will say "this meets the Barcelona criterion of ST deviation of at least 1 mm discordant with the QRS in any lead with max R or S voltage of no more than 6 mm."  While this is true, the Barcelona criteria should only be mentioned to condemn it.  The methodology was worthless.  See here: Barcelona Rule on Left Bundle Branch Block: Lots of Issues.  See the most critical issue discussed below.

See references for Modified Sgarbossa far below:


Later, there was a follow up ECG:

This shows obvious evolution of inferior and posterior MI.  There is still an accelerated junctional rhythm.


Outcome:

He was taken for angiogram and found a 100% occluded mid RCA and 3 stents were placed.   I do not have troponin or echo data, or followup ECG.


Ken Grauer annotated the 2nd EKG, with explanation below. 


#2 ECG (and this also applies to the first ECG: 

— vertical RED line shows onset of the QRS (so NO sinus P waves). Instead — multiple leads show retrograde P waves (YELLOW arrows). QRS morphology consistent with LBBB (albeit lack of a monophasic R wave in lead V6 …. Of concern is marked primary ST elevation in each of the inferior leads (lead III >> II) — with mirror image reciprocal ST depression in leads I and aVL (much more than what would be expected with simple LBBB). Note J-point ST depression in lead V2 (which is not normal) — and then hyperacute T waves in V5,V6 — so consistent with acute RCA occlusion that results in accelerated junctional escape with LBBB and acute infero-postero-lateral STEMI.

#2 ECG — Junctional rhythm again, albeit at a slightly slower rate + LBBB (albeit still no monophasic R wave in lateral chest leads) — still hyperacute T waves in inferior and lateral chest leads with reciprocal change in aVL — though less ST elevation in ECG #2 (and less J-point ST dep in aVL)

Of note — Lack of lateral chest lead R wave may reflect loss of lateral forces from the STEMI.

References for Smith Modified Sgarbossa Criteria


The Barcelona Criteria are based on Fatally Flawed Research

This is an excerpt from a paper I am writing with some colleagues.  A critique of the "Barcelona Criteria," which should only be mentioned to condemn it.


The final area of contention regards the inappropriately low cTn threshold ratios (peak level divided by upper reference limit) utilized by the authors of the Barcelona study. Di Marco et al. used a cTn ratio of 10, in reference to a separate study by Gonzalez et al [1]. This was a mistaken representation of Gonzalez et al. who had incorrectly stated that their cTn assay had a 99% URL cutpoint of >0.001 µg/L (1ng/L, or 0.001 ng/mL). This was incorrect, as there is no assay on the market with a URL that low, including all high sensitivity (hs) cTn. Using this URL, a peak cTn ratio of 10 gives a cut-point of 0.010 ng/mL, which is not only a very low cutoff for occlusion, but also too low to make the diagnosis of any MI, as it is far lower than the URL for almost all assays available, whether 4th or 5th generation hs-cTn [2].


In the Smith validation study, by comparison, the vast majority of cTnI measurements were done using an assay with URL of 0.032 to 0.050 ng/mL (µg/L). Thus, the cTnI ratio required to diagnose OMI was far greater (>200-300x the URL for cTnI, and >100x the URL for cTnT) than the Barcelona study. The proven TIMI 0-1 Occlusion MI groups in the Smith criteria studies consistently demonstrated mean peak cTnI levels >10ng/mL, and peak cTnT levels in the 2.0-6.0 ng/mL (µg/L) range. This highlights that for a reference standard of OMI, the troponin cutoff must be in the range of >100x the URL.


As expected with the inappropriately low troponin threshold in the Barcelona study, the online supplemental information stated that 95% of all AMIs in the study were considered “STEMI equivalents.” This contrasts with the known prevalence of true STEMI and of OMI among AMI with normal conduction. For example, Hillinger et al. found only 81 STEMIs (18%) and 54 additional OMIs (13%), for a total of 135 OMI (31%) among 438 AMIs in their large, prospective real world chest pain cohort [3].


1. Gonzalez MA, Porterfield CP, Eilen DJ, Marzouq RA, Patel HR, Patel AA, et al. Quartiles of peak troponin are associated with long-term risk of death in type 1 and STEMI, but not in type 2 or NSTEMI patients. Clin Cardiol. 2009 October 01;32(10): 575-583.

2. Hillinger P, Strebel I, Abacherli R, Twerenbold R, Wildi K, Bernhard D, et al. Prospective validation of current quantitative electrocardiographic criteria for ST-elevation myocardial infarction. Int J Cardiol. 2019 October 01;292: 1-12.

3. Collinson PO, Saenger AK, Apple FS and IFCC C-CB. High sensitivity, contemporary and point-of-care cardiac troponin assays: educational aids developed by the IFCC Committee on Clinical Application of Cardiac Bio-Markers. Clin Chem Lab Med. 2019 April 24;57(5): 623-632.


Recommended Resources