I was working in triage very late when a 30 yo previously completely healthy woman walked in with 30 minutes of central chest pressure.
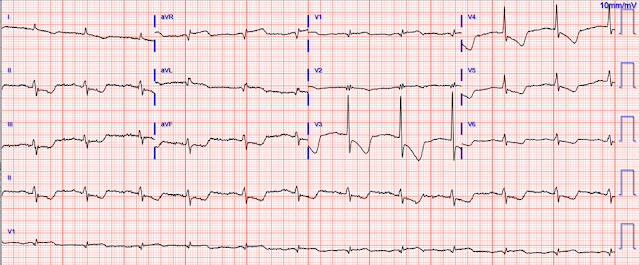
This ECG was recorded:
The computer called it "Normal"
What do you think?
Veritas algorithm
Overread by cardiologist as normal
I immediately recognized an inferior-posterior-lateral OMI. There are hyperacute T-waves in II, III, and aVF. They are too large, wide, fat, and bulky in comparison to the size of the QRS to be normal. The degree of upward concavity is less than normal. There is a downsloping ST segment in V2. There are relatively large T-waves in V4-V6.
The patient was otherwise healthy, had no past history, and had never had chest discomfort before.
I immediately activated the critical care team and walked the patient to the critical care area, our "Stabilization Room." The team was there and I showed them the ECG and said "I am 80% certain this is OMI. Let's record another one."
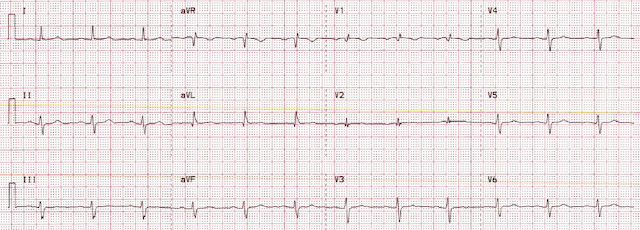
So another was recorded 19 minutes after the first:
- The fact that today’s patient is a previously healthy young woman in no way rules out the possibility of acute OMI.
- The fact that the computer failed to detect any acute abnormality likewise in no way rules out the possibility of acute OMI. Computerized ECG interpretation programs are notorious for missing early subtle ECG changes of acute OMI (Please see My Comment at the bottom of the page in the February 4, 2022 post in Dr. Smith's ECG Blog for "My Take" on the Pros & Cons of Computerized ECG Interpretations).
- It is not unusual for the initial Troponin value to be normal. An initial normal Troponin value rules out nothing.
- The finding of an rSr’ complex in both leads V1 and V2 on ECG #1 is unusual. While possible that this might reflect an incomplete RBBB pattern (and there are narrow terminal s waves in both leads I and V6) — even though the P waves in V1 and V2 are not negative — this rSr’ pattern in V1 and V2 should always make you consider the possibility of too-high placement of the V1,V2 electrode leads. The reason this is relevant in cases like this one — is that IF you are looking for subtle signs of acute posterior OMI — you’ll want to ensure that the lead V1 and V2 electrodes are correctly placed.
- The initial ECG presents a superb example of how to recognize hyperacute T waves. As per Dr. Smith — the T waves in each of the inferior leads (II,III,aVF) are “hypervoluminous” with respect to QRS amplitudes in these leads (ie, These T waves are taller — “fatter” at their peak — and wider at their base than they should be). There can be NO doubt that in a patient with new chest discomfort — that the T wave in lead III that is double the height of the R wave in this lead is abnormal.
- The “magic” reciprocal relationship between leads III and aVL is present here. The reason this is a subtle finding in today's initial tracing — is that the QRS in lead aVL is tiny! But this tiny QRS in aVL starts with a Q wave — manifests a coved ST segment — and ends with disproportionately deep (considering QRS amplitude) T wave inversion.
- The abnormally straight ST segment in lead I supports our suspicion of reciprocal change in lead aVL. It’s important to appreciate that this ST segment straightening in lead I is not normal.
- In the Chest Leads — There is often normally slight-but-real ST segment elevation in anterior leads V2,V3. Therefore — it’s important to recognize that the ST segment straightening without any J-point elevation that we see in lead V3 of ECG #1 is not normal. Instead, in a patient with new chest pain and hyperacute inferior lead T waves — this picture that we see in lead V3 suggests associated posterior OMI until proven otherwise. In further support of our suspicion of associated posterior OMI — is that neighboring leads V4,V5 also show subtle-but-real ST segment flattening.
- To EMPHASIZE: Many of the findings that I highlight above (which Dr. Smith instantly recognized) — are subtle indeed. But taken together — the fact that this previously healthy 36 year old woman presented to the ED with new chest pain — and knowing that there is NO way the towering, fat T wave in lead III is normal — the fact that no less than 8/12 leads show supportive findings of infero-postero OMI (even though we’ve lost the ability to assess 2 of the remaining leads = V1,V2 because of possible electrode lead misplacement) — We have to assume acute infero-postero OMI until proven otherwise.
- It’s easiest to appreciate serial ECG changes when you look lead-to-lead with both tracings next to each other (Figure-1). Although I see no significant change in the chest leads between these 2 tracings — there should be no doubt that inferior lead T waves are less voluminous in ECG #2 — and the worrisome shape of the ST segment and depth of T wave inversion in lead aVL has improved. This defines this 2nd ECG as showing “dynamic” ST-T wave changes — and confirms the need for prompt cath.
-USE.png) |
| Figure-1: For ease of comparison — I've put together the first 2 ECGs in today's case. |
- Take Home Point: Repeating the ECG will often provide the answer!


-USE.png)


-USE%20copy.png)


-USE%20copy.png)