Friday, August 26, 2022

Acute chest pain and a bizarre ECG

 Written by Pendell Meyers


A middle aged adult presented with acute undifferentiated chest pain.

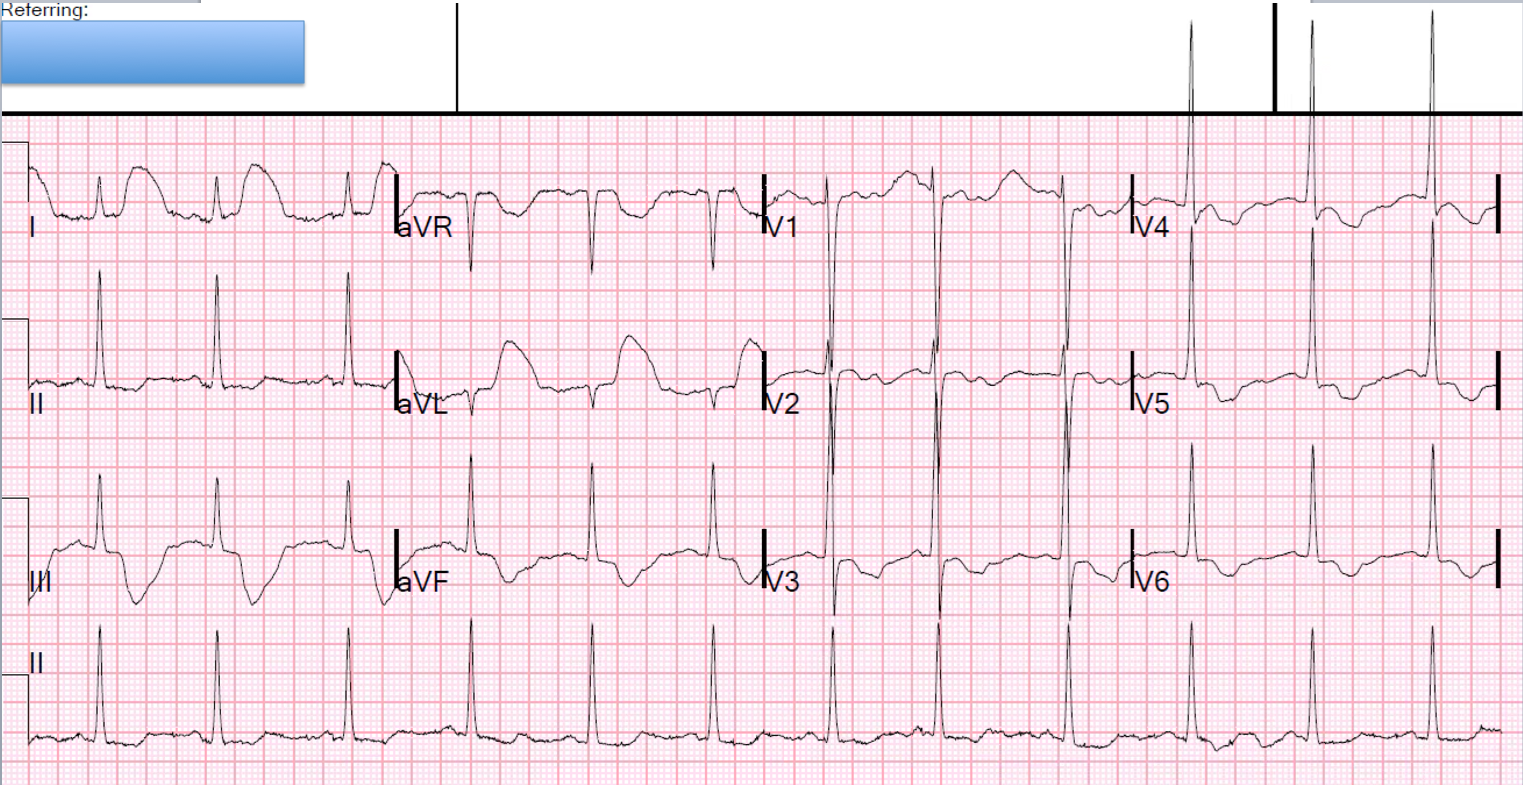
Here is his ECG at triage:

What do you think?


I sent this ECG with no clinical information to Dr. McLaren, who replied simply "Artifact". 

He is referring to an artifactual ECG pattern that corresponds with the cardiac cycle which is known as "arterial pulse tapping artifact." See the discussion and links at the end of the post for more information, but this phenotype of ECG artifact is not yet well understood (to my knowledge). In some cases, it has been attributed to placement of an electrode near a pulsing anatomical structure, such as a dialysis fistula.


The cath lab was activated for suspicion of posterolateral STEMI(+) OMI.

Minutes later the ECG was repeated with new electrodes (there was no obvious problem or abnormality noticed from the first electrode placement):


The cath lab was deactivated.


All troponins were undetectable.


No other significant pathology was found upon further chest pain workup.


It seems almost certain to me that the first ECG does represent artifact simulating OMI, which I believe fits with the pattern of arterial pulse tapping artifact.


Check out this case of similarly appearing arterial pulse tapping artifact:

Bizarre (Hyperacute??) T-waves


See more info on arterial pulse tapping artifact:

Arterial pulse tapping artifact

https://www.aclsmedicaltraining.com/blog/guide-to-understanding-ecg-artifact/

This online article references the article below by Emre Aslanger, one of our co-editors:

Aslanger E, Yalin K. Electromechanical association: a subtle electrocardiogram artifact. Journal of Electrocardiology. 2012;45(1):15-17. doi:10.1016/j.jelectrocard.2010.12.162.

Incredibly, this case was just published in Circulation on January 22, 2018 (thanks to Brooks Walsh for finding this!) 
Asymptomatic ST-Segment–Elevation ECG in Patient With Kidney Failure.   https://doi.org/10.1161/CIRCULATIONAHA.117.032657.  Circulation. Originally published January 22, 2018

Here is a case from Circulation year 2000 that was misdiagnosed as due to pancreatitis.  But you can tell from the normal lead III that this was a right arm electrode problem:
http://circ.ahajournals.org/content/101/25/2989.full


===================================

MY Comment, by KEN GRAUER, MD (8/26/2022):

===================================

Today’s case provides an excellent example of how the 1st time you see an ECG phenomenon — it may pass unrecognized. But after one learns about the phenomenon — it becomes EASY to recognize in the future!

  • The clinicians who initially saw today's patient were fooled by what superficially looks like ST elevation in high lateral leads I and aVL — and — with what looks like marked ST depression in virtually all other leads.


KEY Point: Artifact is deceptively common in clinical practice. The BEST way not to overlook artifact — is to be aware of how common it actually is! I’ll add the following points regarding CLUES to today’s case:

  • CLUE #1: The 1st thing to notice about the initial ECG ( = ECG #1 that I've reproduced in Figure-1 below— is that there is a tremendous amount of baseline artifact. This is especially true in the limb leads — where none of the seemingly elevated and depressed ST segments look the same. In the long lead V1 rhythm strip — each of the 10 beats manifest a different variation on the shape of the ST segment. When there is much artifact elsewhere on a tracing — the chances increase greatly that artifact is also affecting the ST segments you are concerned about.

  • CLUE #2: The shape of the elevated and depressed ST segments in the limb leads is bizarre. The ST segment is jagged in the 2 limb leads with ST elevation (ie, leads I, aVL) — and the deepest part of the depressed ST segments in leads III and aVF is almost pointed. This does not look physiologicIn general, when ECG deflections look bizarre and “unphysiologic” — there is an excellent chance that such deflections are not real!

  • CLUE #3: The shape of the depressed ST segments in all 6 chest leads looks very similar (ie, with a "rounded scoop", showing approximately the same amount of ST depression in each of these 6 leads — as highlighted in GREEN). The presence of geometric shapes (in this case, the "rounded scooping") — is also unlikely to be physiologic.

  • CLUE #4: All of the above described unusual shapes (ie, the peak of the ST elevation in leads I,aVL — the negative peaking in leads III and aVF — and the lowest part of the rounded GREEN scoopings) — occur at a fixed interval with respect to the preceding QRS complex. This suggests us that whatever is producing these deflections must be related to cardiac contraction (and/or to arterial pulsation)!

  • But it is CLUE #5 — that clinched the diagnosis of artifact for me (See below Figure-1).

Figure-1: The 2 ECGs from today's case. I've labeled the artifact in ECG #1 (See text).


CLUE #5: The distribution in ECG #1 of the bizarre ST-T wave deflections precisely follows the location and relative amount of amplitude distortion predicted by Einthoven’s Triangle.

  • The amount of artifactual ST segment deviation is approximately equal in 2 of the standard limb leads (ie, outlined in RED in leads I and III) — andnot seen at all in the 3rd standard limb lead (ie, the ST segment is neither elevated nor depressed in lead II). By Einthoven’s Triangle (See Figure-2) — the finding of equal ST segment amplitude artifact in Lead I and Lead III, localizes the "culprit" extremity to the LA ( = Left Arm) electrode.
  • The absence of ST elevation or depression in lead II is consistent with this — because, derivation of the standard bipolar limb lead II is determined by the electrical difference between the RA ( = Right Armand LL ( = Left Leg) electrodes, which will not be affected if the source of the artifact is the left arm.
  • By Einthoven's Triangle — the finding of maximal amplitude artifact in unipolar lead aVL confirms that the left arm is the “culprit” extremity (highlighted in RED in lead aVL).


Figure-2: Use of Einthoven's Triangle to determine the electrical voltages in the 3 standard limb leads.


NOTE: I reproduce below in Figures 34 and 5 — the 3-page article by Rowlands and Moore (J. Electrocardiology 40: 475-477, 2007) — which is the BEST review I’ve seen on the physiology explaining the relative size of artifact amplitude deflections when the cause of the artifact is a single extremity. These principles are illustrated by the colored deflections that I drew in the initial ECG that I show above in Figure-1:

  • As noted by the equations on page 477 in the Rowlands and Moore article: i) The amplitude of the artifact is maximal in the unipolar augmented electrode of the “culprit” extremity — which is lead aVL in Figure-1 (RED outline of the elevated ST segment in this lead)andii) The amplitude of the artifact in the other 2 augmented leads (ie, leads aVR and aVF) is about 1/2 the amplitude of the artifact in lead aVL (BLUE outline of the depressed ST segments in leads aVR and aVF).
  • Similarly — the amplitude of the artifact deflections in the unipolar chest leads in Figure-3 is also significantly reduced (to ~1/3 size) from the maximal amplitude seen in leads I, III and aVL (GREEN outline of the scooped ST segments in each of the 6 chest leads).


BOTTOM LINE: You will see artifact frequently in real-life practice. Awareness of the above CLUES facilitates recognizing with 100% certainty that the bizarre ST segment deviations seen on a tracing like the one in today's case are the result of artifact — and are related to arterial pulsations in one of the extremities. 

  • Nothing else shows fixed relation to the QRS complex in the mathematical relationships described above, in which there is equal maximal artifact deflection in 2 of the 3 limb leads (with no ST segment deviation in the 3rd limb lead) — in which maximal artifact in the unipolar augmented lead will be seen in the extremity electrode that shares the 2 limb leads that show maximal artifact (as according to Einthoven’s Triangle).

To conclude this case — Take another LOOK at Figure-1
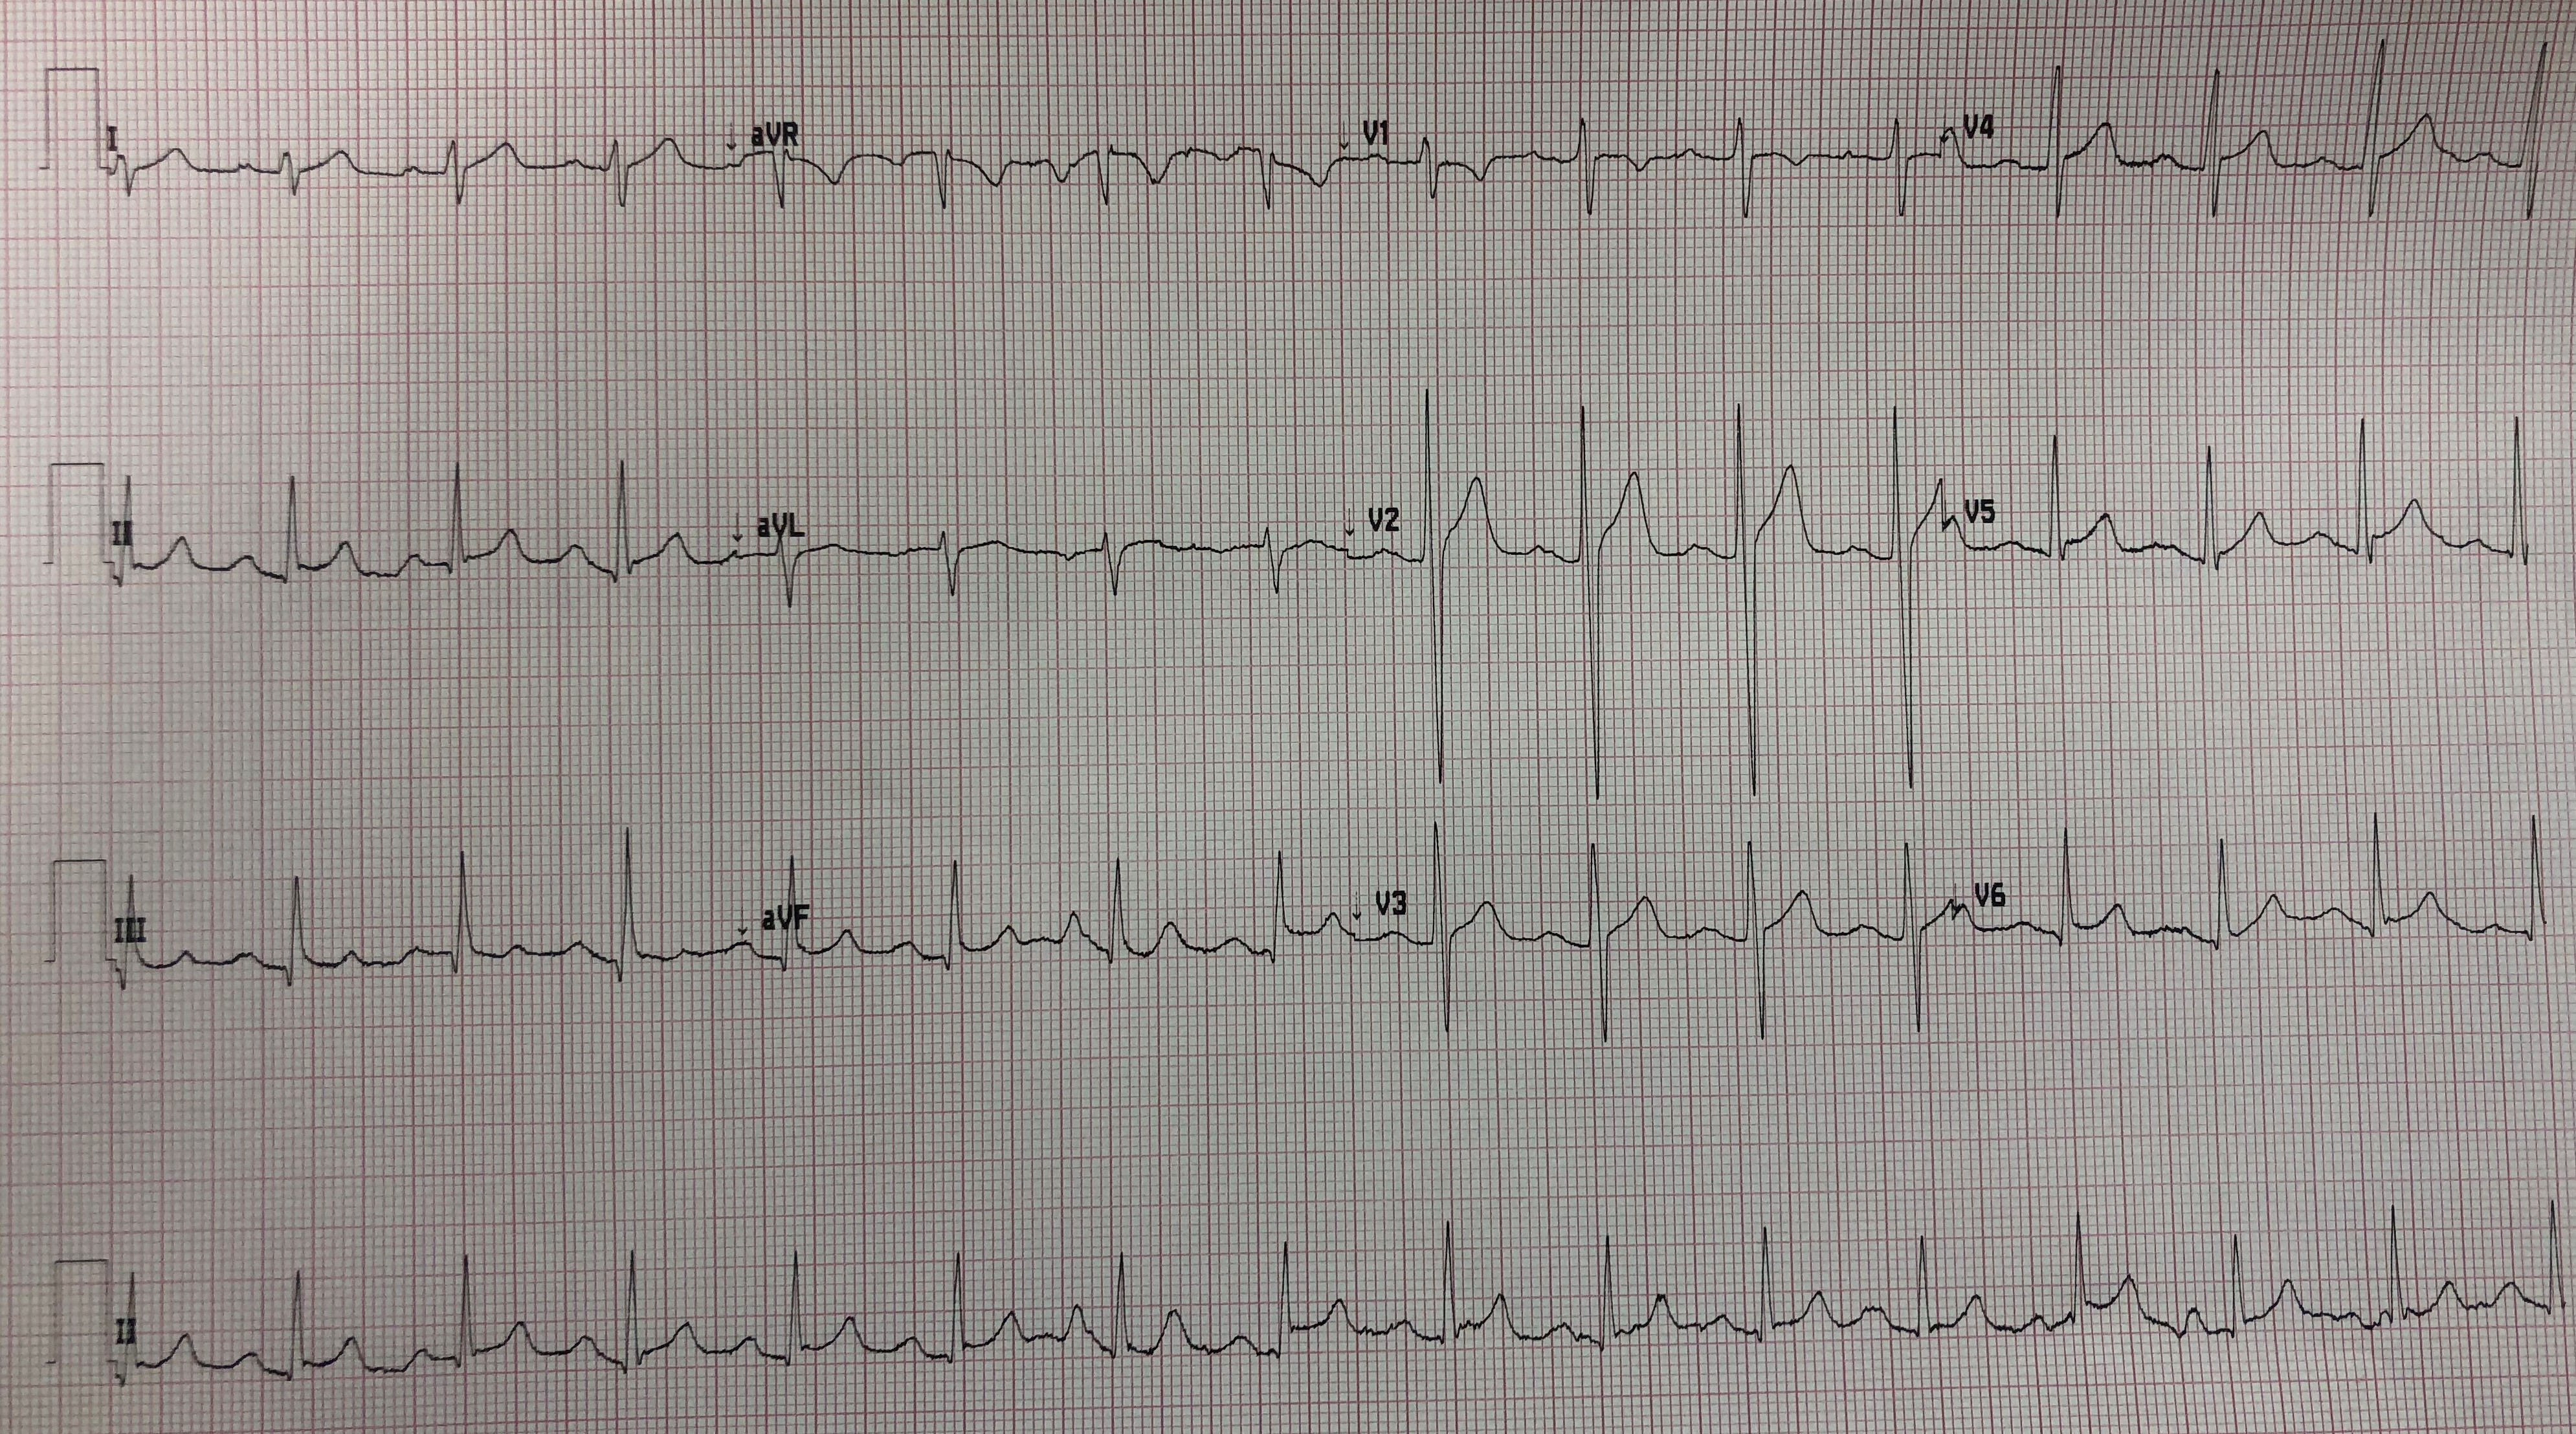
  • ECG #2 was recorded just minutes after ECG #1 — after repositioning all electrode leads. In your mind's eye — Wouldn't ECG #1 look like ECG #2 if we took away the artifactual deflections highlighted in RED, BLUE and GREEN?


Figure-3: Page 475 from the Rowlands and Moore article referenced above.


Figure-4: Page 476 from the Rowlands and Moore article referenced above.


Figure-5: Page 477 from the Rowlands and Moore article referenced above.


Tuesday, August 23, 2022

Very fast narrow complex tachycardia

A 50-something with h/o palpitations, chest pain, and EF of 40% (of unknown etiology) presented with chest pain.

Blood pressure, perfusion, and mental status were normal.  Patient was comfortable appearing.  

Here is his initial ED ECG:

Narrow Complex Tachycardia at a rate of 217

A Modified Valsalva was attempted without success.

Then 6 mg of adenosine was given.  There was a 2 second interruption, and then this rhythm strip was recorded:  
There is now a wide complex, with RBBB pattern.  
For unknown reason, the right bundle no longer repolarizes in time for the next beat.  It is refractory.  So there is now a rate related RBBB even though previously, at the same rate, there was normal conduction.  
RR intervals are ~275 ms, corresponding to heart rate = 218 (= initial heart rate)


Then 12 mg of adenosine was given.

Here is the first half of the rhythm strip after 12 mg:

Here is the second half:

As you can see, there is initial slowing of the ventricular rate and then it speeds up again. 
If you look closely at lead V1, you can see atrial activity throughout, at a very similar rate to the fast ventricular rate.

These are not flutter waves, which would be much large (i.e., "macro"); they are too small.  This is micro-atrial tachycardia. 

Short primer of atrial tachycardia
--Atrial Flutter is a "Macro" tachycardia, with a pathway that uses the entire right atrium and therefore has large, very visible flutter waves.  
--Atrial flutter is also a re-entrant atrial tach.  So it is a "Macro Re-entrant Tachycardia"
--Micro atrial tachycardia takes place in a very localized part of the atrium and manifests on the 12-lead as atrial activity that is of much less magnitude and duration than flutter.
--Micro atrial tachycardia can be either re-entrant or automatic.  
--Automatic tachycardias, including atrial tachycardias, are not responsive to either adenosine or electricity. 
--All re-entrant tachycardias, Macro (flutter) and Micro, are potentially responsive to electrical cardioversion. 
--Of Micro re-entrant atrial tachycardias, some are adenosine responsive and some are not.  
--When you treat an SVT with adenosine and it converts, you can't be certain that it was AVNRT -- it might have been a micro-reentrant atrial tachycardia that is adenosine responsive!
--With any atrial tachycardia, the ventricular rate can be reduced by an AV nodal blocker such as beta blocker or calcium channel blocker.

Back to our case
This atrial tachycardia is not macro; it is micro.  This one does not appear to respond to adenosine.   As soon as the short half-life adenosine is metabolized, the AV node can conduct again and the ventricular rate is fast again.  

But at this very fast atrial rate, the atrial tach is probably re-entrant and it should respond to electricity. 

Many AV nodes cannot conduct this fast and, if they do not, we would see 2:1 conduction with a heart rate of about 109.  This AV node conducts very fast.

Just like with atrial flutter or fibrillation, we can slow the ventricular response with an AV nodal blocker that lasts longer than adenosine, such as a calcium channel blocker or beta blocker.

Of course, we could just try electricity to see if it will convert this atrial tachycardia (it should be successful if it is re-entrant). Electricity is very likely to work.

The patient was a bit reluctant to be electrically cardioverted, so we gave him metoprolol 5 mg IV q 5 minutes x 3 (total dose = 15 mg)

Here is his ECG rhythm strip after metoprolol:
Mostly 2:1 conduction, with some 1:1 conduction.  
Here you can see where I marked the atrial activity in lead V1.  


And a 12-lead:
These show mostly 2:1 conduction, with some beats conducting at 1:1


After this, the patient agreed to electrical cardioversion:
Normal Sinus Rhythm


Why did the patient have a low EF?
--He probably had been having such frequent tachycardia that he had tachycardia cardiomyopathy.

He underwent an angiogram which was normal.

He later reverted to atrial tachycardia while an inpatient.

2 days later, he underwent EP study with ablation.


===================================

MY Comment, by KEN GRAUER, MD (8/23/2022):

===================================

I found today's case fascinating, with a number of important lessons. I fully acknowledge that after pondering the intricacies of the 7 tracings shown above by Dr. Smith — I had more questions than answers. That said, despite a number of uncertainties — the lessons are clear! — and, excellent management by Dr. Smith resulted in successful conversion to sinus rhythm.
  • I focus my comment on 4 of the 7 tracings shown by Dr. Smith above. For clarity — I've numbered the tracings in the sequence that were shown above.

The patient in today's case presented with chest pain — and the ECG shown in Figure-1. The patient was hemodynamically stable in association with this rhythm.
  • Even before addressing the rhythm — the 1st point to make is that patients with tachyarrhythmias often present with chest discomfort. IF the patient's chest pain promptly resolves on conversion to sinus rhythm and this post-conversion ECG shows no acute ST-T wave changes — then you can usually be comfortable that the chest pain was merely a result of the rapid heart rate, and not an acute cardiac syndrome.

Figure-1: The initial ECG in today's case.


MY Thoughts on the Initial ECG:
The ECG in Figure-1 shows a regular narrow-complex tachycardia — therefore, a regular SVT (SupraVentricular Tachycardia). The heart rate is ~215/minute. The presence of atrial activity is uncertain.
  • Although there is an upright deflection just past the midpoint of the R-R interval in lead II — the heart rate of ~215/minute is too fast for this to represent a sinus P wave.
  • Leads V1 and aVR both manifest what might be a pseudo-r' that notches the terminal portion of the QRS in those leads. Retrograde atrial conduction with AVNRT often looks like this in these 2 leads. That said — when we do see retrograde atrial activity with AVNRT — it typically produces a negative notch in the terminal part of the QRS in the inferior leads, and that is not seen in Figure-1.

  • Bottom Line Regarding Atrial Activity in Figure-1 — I could not be certain as to whether some type of atrial activity was or was not present.

Therefore — My assessment of the ECG in Figure-1 was that there was a regular SVT rhythm at ~215/minutewithout clear sign of atrial activity.
  • We've previously reviewed the differential diagnosis of regular SVT rhythms on many occasions in Dr. Smith's ECG Blog (Please see discussions by Dr. Smith and My Comment at the bottom of the page of the March 6, 2020 post for Review of Key Concepts).

  • Practically Speaking — the principal differential diagnosis of a Regular SVT rhythm, in which sinus P waves (ie, a definite upright P wave in lead IIare not evident includes: i) Sinus Tachycardia (IF there is a possibility that sinus P waves might be hiding within the preceding ST-T wave)ii) A Reentry SVT (either AVNRT if the reentry circuit is contained within the AV node — or AVRT if an AP [Accessory Pathway] located outside the AV node is involved)iii) Atrial Tachycardiaor iv) Atrial Flutter with 2:1 AV conduction.

  • Heart Rate Can Help! In brief — i) IF the heart rate in an adult is ≥170/minute — then both Sinus Tachycardia and AFlutter become less likely (ie, not impossible! — but less likely); — BUT — ii) IF the heart rate of a regular SVT rhythm in an adult is close to ~150/minute (ie, ~140-160/minute) — then any of the above 4 entities have to be considered in the differential diagnosis!

Applying this to the rhythm in Figure-1:
  • As noted above — the heart rate of ~215/minute in ECG #1 makes sinus tachycardia in an adult extremely unlikely.
  • Untreated AFlutter is also extremely unlikely — since a rate of ~215/minute is too fast for 2:1 AV conduction (because this would require a flutter rate of 215 X 2 = 430/minute — which is much faster than the usual flutter rate of ~300/minute) — and a rate of ~215/minute is slower that what one would expect if there was 1:1 conduction with AFlutter.

  • This leaves a reentry SVT or ATach as the most likely possibilities for the rhythm in Figure-1.


The "Good News" about Treatment:
  • While helpful to work through the differential diagnosis — initial management of regular non-sinus SVT rhythms in an ED setting is very similar.
  • During the course of such treatment — you will usually arrive at the correct rhythm diagnosis.


The CASE Continues:
In today's case — Valsalva was unsuccessful. Adenosine was then given (initially 6 mig IV — then 12 mg IV). The result is seen in the 2 rhythms shown in Figure-2.
  • NOTE: To facilitate visualization of key features — I only show leads V1,V2,V3 for the 2 rhythms in Figure-2.

Figure-2: ECG #3 — and its continuation in ECG #4 illustrate the response of the regular SVT rhythm to Adenosine (See text).


The Response to Adenosine:
Having all but eliminated sinus tachycardia and atrial flutter (because of the very rapid rate of ~215/minute) — the differential diagnosis for today's regular SVT rhythm was reduced to some form of reentry SVT (ie, AVNRT or orthodromic AVRT) or ATach.
  • Adenosine will almost always work for converting a reentry SVT rhythm. 
  • As per Dr. Smith's discussion above — Adenosine may or may not convert ATach, depending on the mechanism of the ATach.
  • Most of the time, even if Adenosine does not convert the rhythm — this drug's effect on slowing the ventricular response to the SVT (at least, for the brief duration of action of Adenosine) — will allow underlying atrial activity to be seen, thereby revealing the mechanism of the rhythm. 

The unique feature of today's case is that shortly after Adenosine was given — RBBB conduction developed! (seen for beats #1-20 in ECG #3).
  • Failure of 2 doses of Adenosine to convert the regular SVT rhythm in today's case suggested that the etiology was likely to be ATach.
  • My understanding from review of the literature is that induction by Adenosine of RBBB during treatment is rare (because Adenosine generally has little or no effect on conduction through ventricular myocardium or in the bundle branch system).
  • The typical rsR' morphology in lead V1 for beats #1-thru-20 in ECG #3 and the fact that the rate of the rhythm during these 20 beats was identical to the ~215/minute seen in Figure-1 — strongly suggested that this was indeed induction of a supraventricular RBBB conduction pattern by Adenosine (and not VT).
  • Although a component of "rate-related" BBB appeared to be operative — the fact that the heart rate before and after onset of RBBB conduction remained the same suggested some other mechanism accountable for the switch to RBBB conduction. Perhaps in today's patient Adenosine did exert some effect on conducting tissues within the bundle branch system that took effect before the drug was able to act on AV nodal tissue?

  • Beat #21 in ECG #3 is conducted normally. Perhaps the short pause before this beat was enough to normalize bundle branch conduction?
  • Beats #23 and 26 look like PVCs (very different morphology). But what about beats #22, 24,25,27,28,29?

Take a look at ECG #4. Note that there are different QRS morphologies seen on this rhythm strip!
  • The challenge interpreting ECGs #3 and #4 — is that we only intermittently see atrial activity (and we really only see atrial activity in lead V1).
  • I suspect Dr. Smith is correct that atrial activity continues throughout both rhythm strips — but we really are not able to consistently follow such atrial activity (ie, RED arrows show those regular P waves that we can see in the 2nd half of ECG #3 — and in the 1st half of ECG #4 — but there really is no "telltale notching" under the PINK arrows — so can we really be certain that atrial activity stays regular throughout these tracings?).

  • BLUE arrows in ECG #4 suggest continuation of regular atrial activity — BUT — note that while the PR interval for RED arrow P waves appears to be constant — this PR interval is different than the PR interval of every-other-BLUE-arrow P wave that appears to be conducting.
  • Finally — the YELLOW arrow P wave appears to conduct — and sets up return of 1:1 conduction with the same RBBB morphology that was seen at the beginning of ECG #3.
BOTTOM LINE: Other than the 2 PVCs (ie, beats #23 and 26 in ECG #3) — I suspect all beats in Figure-2 are supraventricular. ECG #3 begins with the RBBB conduction induced by Adenosine — until finally, Adenosine's effect begins to act on the AV node with beat #22.
  • Perhaps the unusual action of Adenosine in today's patient — that is acting on both bundle branch tissue and AV nodal tissue — accounts for the 3:1 AV block with a different (wider) QRS morphology at the end of ECG #3 and the beginning of ECG #4?
  • There then follows normal QRS conduction with 2:1 block during the period of BLUE arrow P waves.
  • ECG #4 then finishes with the YELLOW P wave that initiates 1:1 conduction with the original RBBB morphology for beats #12-thru-23 in ECG #4.

Metoprolol was then added (3 doses of 5 mg IV over 10 minutes) — and ECG #6 was recorded (Figure-3):

Figure-3: ECG #6 was obtained followed 3 doses of IV Metoprolol.


The Response to IV Metoprolol:
Note in ECG #6 that atrial activity is only seen in lead V1 (colored arrows in this lead)It would be easy to overlook the presence of P waves if you did not carefully scrutinize lead V1!
  • Note that the overall ventricular rate has slowed. In addition — the effect of Adenosine has worn off by this time. As a result — the QRS complex is narrow!
  • We have deduced that the rhythm in today's case is ATach.
  • Note that there is group beating in parts of the long lead II rhythm strip in Figure-3 (ie, a number of bigeminal beats spread out over the long lead rhythm strip).

  • PEARL #1: ATach frequently manifests Wenckebach conduction. Because we don't see atrial activity in lead II — the long lead rhythm strip is of little use to us in assessing the mechanism of this rhythm. But the 5 beats we do see in lead V1 are revealing — as there is 3:2 Wenckebach conduction (Each cycle begins with the shortest PR interval [RED arrows] — followed by lengthening of the PR interval [BLUE arrows] — and then the dropped beat [WHITE arrows] to complete the Wenckebach cycle).

  • PEARL #2: A characteristic of ATach — is that P wave morphology of the atrial focus is often quite different from the morphology of sinus P waves. Note in the last tracing shown above (after electrical cardioversion) — that a normal upright sinus P wave is now seen in lead II.


KEY Lessons to Be Learned:
The management course outlined above by Dr. Smith was appropriate and effective! As per Dr. Smith — Adenosine is often the optimal choice in the ED for initial management of the regular SVT rhythm.
  • Adenosine effectively slowed the rhythm in today's case — thereby allowing identification of the correct etiology ( = ATach).
  • That said — Adenosine did not convert the rhythm to sinus.
  • It appears that Adenosine produced the unusual effect of inducing RBBB conduction (at the identical rate as the initial narrow SVT rhythm). Awareness that this side effect can be seen with Adenosine is important — as is recognition that persistence of the identical 215/minute heart rate essentially ruled out VT as the cause for QRS widening.
  • Along the way (during the 1-2 minutes that IV Adenosine was active) — a variety of unusual arrhythmias (with different QRS morphologies and changing PR intervals) were seen. As fascinating as this mixture of arrhythmias was — there is no need for in-depth arrhythmia analysis during the time that Adenosine is active because: i) Adenosine-induced arrhythmias are often complex and "don't read the textbook"; and, ii) Adenosine-induced arrhythmias almost always resolve when the drug wears off.

  • When the SVT rhythm persisted in today's case despite Adenosine administration — We can take comfort knowing that another antiarrhythmic and/or electrical cardioversion will almost always work.


Friday, August 19, 2022

60 year old with vomiting, diarrhea, and syncope: is this Wellens? Is this type 2 MI?

 Written by Jesse McLaren, with edits/comments by Smith and Grauer


A 60 year-old patient with diabetes and ESRD presented with 24 hours of vomiting, diarrhea, weakness and then a syncopal episode. Vitals: RR 18, sat 98%, HR 103, BP 124/71 and temp 38.0. Here’s their ECG: is this Wellens?


There’s borderline sinus tach, normal conduction, normal axis, and low voltages in the limb leads. The anterior leads have loss of R waves, mild convex ST segments and primary T wave inversion. In the context of QS waves, T wave inversion indicates old or subacute infarct, or reperfusion after significant infarction. Below is the old ECG:


This confirms the anterior changes are new--but is this from type 1 or type 2 OMI? The patient was diagnosed and treated for sepsis and DKA, and the only interpretation of the first ECG by the emergency physician was that it didn't meet STEMI criteria.


Smith

1) Some type 1 MI only present with atypical symptoms, especially in diabetics. Such atypical symptoms include vomiting, but not diarrhea.  

2)  Type 2 MI requires a supply demand mismatch.  Low supply: hypotension, hypoxia, anemia, dyshemoglobinemias.  High demand: tachycardia, hypertension, dilated LV (wall stretch).  This patient has no evidence of supply demand mismatch.

3) The ECG suggests a nearly completed LAD infarct due to the QS-waves in V2 and V3.


The first troponin returned at 68,000 ng/L, which was attributed to type 2 MI (though this is not a simple dichotomy, as Dr. Grauer explains in his comments below.) The patient was referred to cardiology, who found an anteroseptal wall hypokinesis on bedside echo. The patient had a prior stress echo with preserved EF but inducible ischemia in the LAD territory. As they noted, "Not for urgent cath in context of septic/DKA picture clouding assessment for type 1 MI, but definitely requires cath and medical treatment for ACS." So they initiated on dual antiplatelets and heparin with a plan for angiogram the next day after treatment for sepsis/DKA.


Smith: the extremely elevated troponin also in consistent with a subacute and completed (transmural) or nearly completed infarct.


Unfortunately, 12 hours after arrival, the patient had a VF arrest. Here’s their post-cardioversion ECG.


Anterior STEMI(+)OMI, so cath lab activated: the LAD had a 100% occlusion but this was chronic, with collaterals from an intact RCA and circumflex that had a 90% stenosis.


Smith: The anterior wall has clearly been supplied through collaterals from the RCA and circ since there is a chronic LAD occlusion.  The circ has a tight stenosis, but is open.  Thus the anterior wall is susceptible to supply demand mismatch, but (as above) we don't have any evidence of that.  Just because the RCA and circ are open now does not mean they were open 20 hours ago.  And the angiogram frequently does not identify a culprit.  So I suspect that one or both of these were occluded within the past 24 hours, resulting in a large anterior infarct.


There was an unsuccessful attempt to stent the chronic occlusion. Peak troponin was 95,000, EF was reduced to 45% with anterior wall motion abnormality, and below is the discharge ECG showing shallow anterior T wave inversion:


As this post explains, Wellens syndrome describes

1.     patient: anginal symptoms which have resolved

2.     ECG: primary reperfusion T wave inversion in LAD distribution but intact R waves, indicating reperfusion before significant infarction

3.     Troponin: mildly elevated

4.     Angiogram: critical lesion in LAD which is now open, or reperfused by collaterals, but is at high risk of-reocclusion


But in this case

1.     patient presented with sepsis vs anginal equivalent: sepsis can cause diffuse ST depression and reciprocal ST elevation in aVR (which is not a “STEMI equivalent” but a sign of diffuse subendocardial ischemia), but should not cause focal ECG changes that mimic OMI

2.     ECG showed primary T wave inversion in LAD distribution, but also loss of R waves indicating significant infarction

3.     Troponin was massively elevated

4.   Angiogram showed chronic total occlusion (CTO) of LAD and limited collateral circulation, which was compromised


As the EXPLORE trial explained, "Concurrent CTO lesions are found in 10% to 15% of patients with STEMI...Because of the procedural complexity and below-average success rate, PCI is attempted only in 10% of all CTO lesions, commonly in an elective setting...In patients with STEMI and concurrent CTO, we did not find an additional benefit for CTO PCI in terms of LVEF or LVEDV. However, a subgroup analysis suggests that patients with CTO in the LAD may benefit from early additional CTO PCI." (Henriques et al. Percutaneous Intervention for Concurrent Chronic Total Occlusions in Patients with STEMI: the EXPLORE trial. JACC 2016)


For patients with CTO, collateral circulation is crucial. As another study found: "In CTO lesions, the antegrade blood flow is completely interrupted, leaving the myocardium entirely dependent on collateral flow...If the collateral to the collateral-dependent myocardium of the CTO area originates directly or distally from the IRA, the myocardium could be endangered in case of blockage during STEMI. This could result in an increase in infarct size and a decrease in LVEF leading to a higher mortality. In our cohort there was a trend for higher mortality in patients with well-developed retrograde collaterals to the CTO, originating from the IRA, which were blocked during STEMI."(Elias et al. Impact of collateral circulation on survival in ST-segment elevation myocardial infarction patients undergoing primary percutaneous coronary intervention with a concomitant chronic total occlusion. JACC 2017)


While this describes collateral circulation compromised by acute thrombus (type 1 MI), it can also be compromised by supply-demand mismatch (type 2 MI). See this post on type 2 posterior OMI secondary to pneumonia and severe anemia: "An emergency formal echo showed an inferolateral wall motion abnormality.  In the record, an old angiogram reported a chronically occluded obtuse marginal (OM).  The previous echo was normal, but a stress echo had shown induced inferolateral hypokinesis.  Thus, there was prior proof that this area was vulnerable to stress; the territory of this artery was reliant on collateral circulation for oxygen delivery."


Take home

    1. Wellens syndrome describes LAD type 1 OMI with spontaneous reperfusion, but

         loss R waves, especially QS-waves, imply there has already been a large infarct

    2. spontaneous reperfusion can occur from the artery opening or recruitment of

        collaterals, i.e. reperfusion can occur with arteries that remain occluded (acutely or

         chronically) if there is sufficient collateral circulation - which is tenuous

    3. Patients with CTO rely on collaterals, which can be compromised by type 1 MI

     (thrombus) or type 2 MI (supply/demand mismatch): treatment is directed at

     restoring supply/demand mismatch, reperfusing acutely occluded coronary arteries

     +/- revascularizing CTO


====================================

MY Comment, by KEN GRAUER, MD (8/19/2022):

===================================

Today's case by Dr. McLaren prompts consideration of the relationship between Acute Infection and Myocardial Infarction. A recent article by Musher et al with this exact title reviews a series of fascinating features of this relationship (Musher et al — N Engl J Med 380:171-176, 2019 — with Free-Access summary of KEY Points by Hayek in ACC: Latest in Cardiology, 2019).
  • Today's case by Dr. McLaren recounts the hospital admission of a patient with sepsis and DKA — with a complicated course including VFib arrest, massively elevated troponin and ultimately an anterior STEMI.
  • Among the points brought out by the above NEJM Review — is the fact that the association between acute infections and acute MI has only been appreciated during the past few decades. A growing body of literature now documents the relationship between viral and bacterial infections such as influenza, pneumonia, urinary tract infections, septicemia, and many others. The finding that risk of acute MI is greatest at the onset of infection — and is proportional to infection severity — strengthens the premise of a cause-and-effect relationship.

  • Surprisingly — the NEJM Review authors contend that demand ischemia (ie, Type 2 Acute MI) should explain no more than a minority of infection-related MI events. Instead — they feel the cause of most infection-related MIs is acute coronary occlusion ( = Type 1 Acute MI).

  • Mechanisms proposed to explain how acute infection may result in acute coronary occlusion include (among others): i) Destabilization of existing atheromatous plaque by acute inflammatory factors (ie, cytokines, interleukins, tumor necrosis factor); ii) Increased thrombogenesis with platelet activation that is associated with acute infection; iii) Gene expression linked to platelet activation, endothelial dysfunction and hypercoagulability that may be promoted by certain viruses.
  • Mechanisms proposed to explain how acute infection may result in Type 2 MI (from demand ischemia) include: i) Impaired coronary perfusion despite increased metabolic needs from acute infection (ie, compensatory tachycardia shortens ventricular filling time during diastole — thereby reducing coronary perfusion); ii) Toxin-mediated vasoconstriction from acute sepsis; iii) Hypoxemia with ventilation-perfusion mismatch (especially with severe respiratory infections); iv) A direct myocardial depressor effect from circulating toxins liberated by acute infection; v) Cytokine "storm" — with sudden release of these substances that may provoke a life-threatening systemic inflammatory syndrome leading to multi-organ failure.

The message from this NEJM Review is clear — A variety of mechanisms account for depressed ventricular function and potential for inducing either Type 1 or Type 2 acute MI as a direct result from almost any serious acute infection.
  • We need to remain alert to this possibility!


Recommended Resources