Friday, September 29, 2023

Proportionality and Serial ECGs Make the Diagnosis. What does the Queen say?

This case comes from Jason Winter, of The Facebook Clinical Electrocardiology ECG Page.

A 60-something woman called EMS for chest pain.

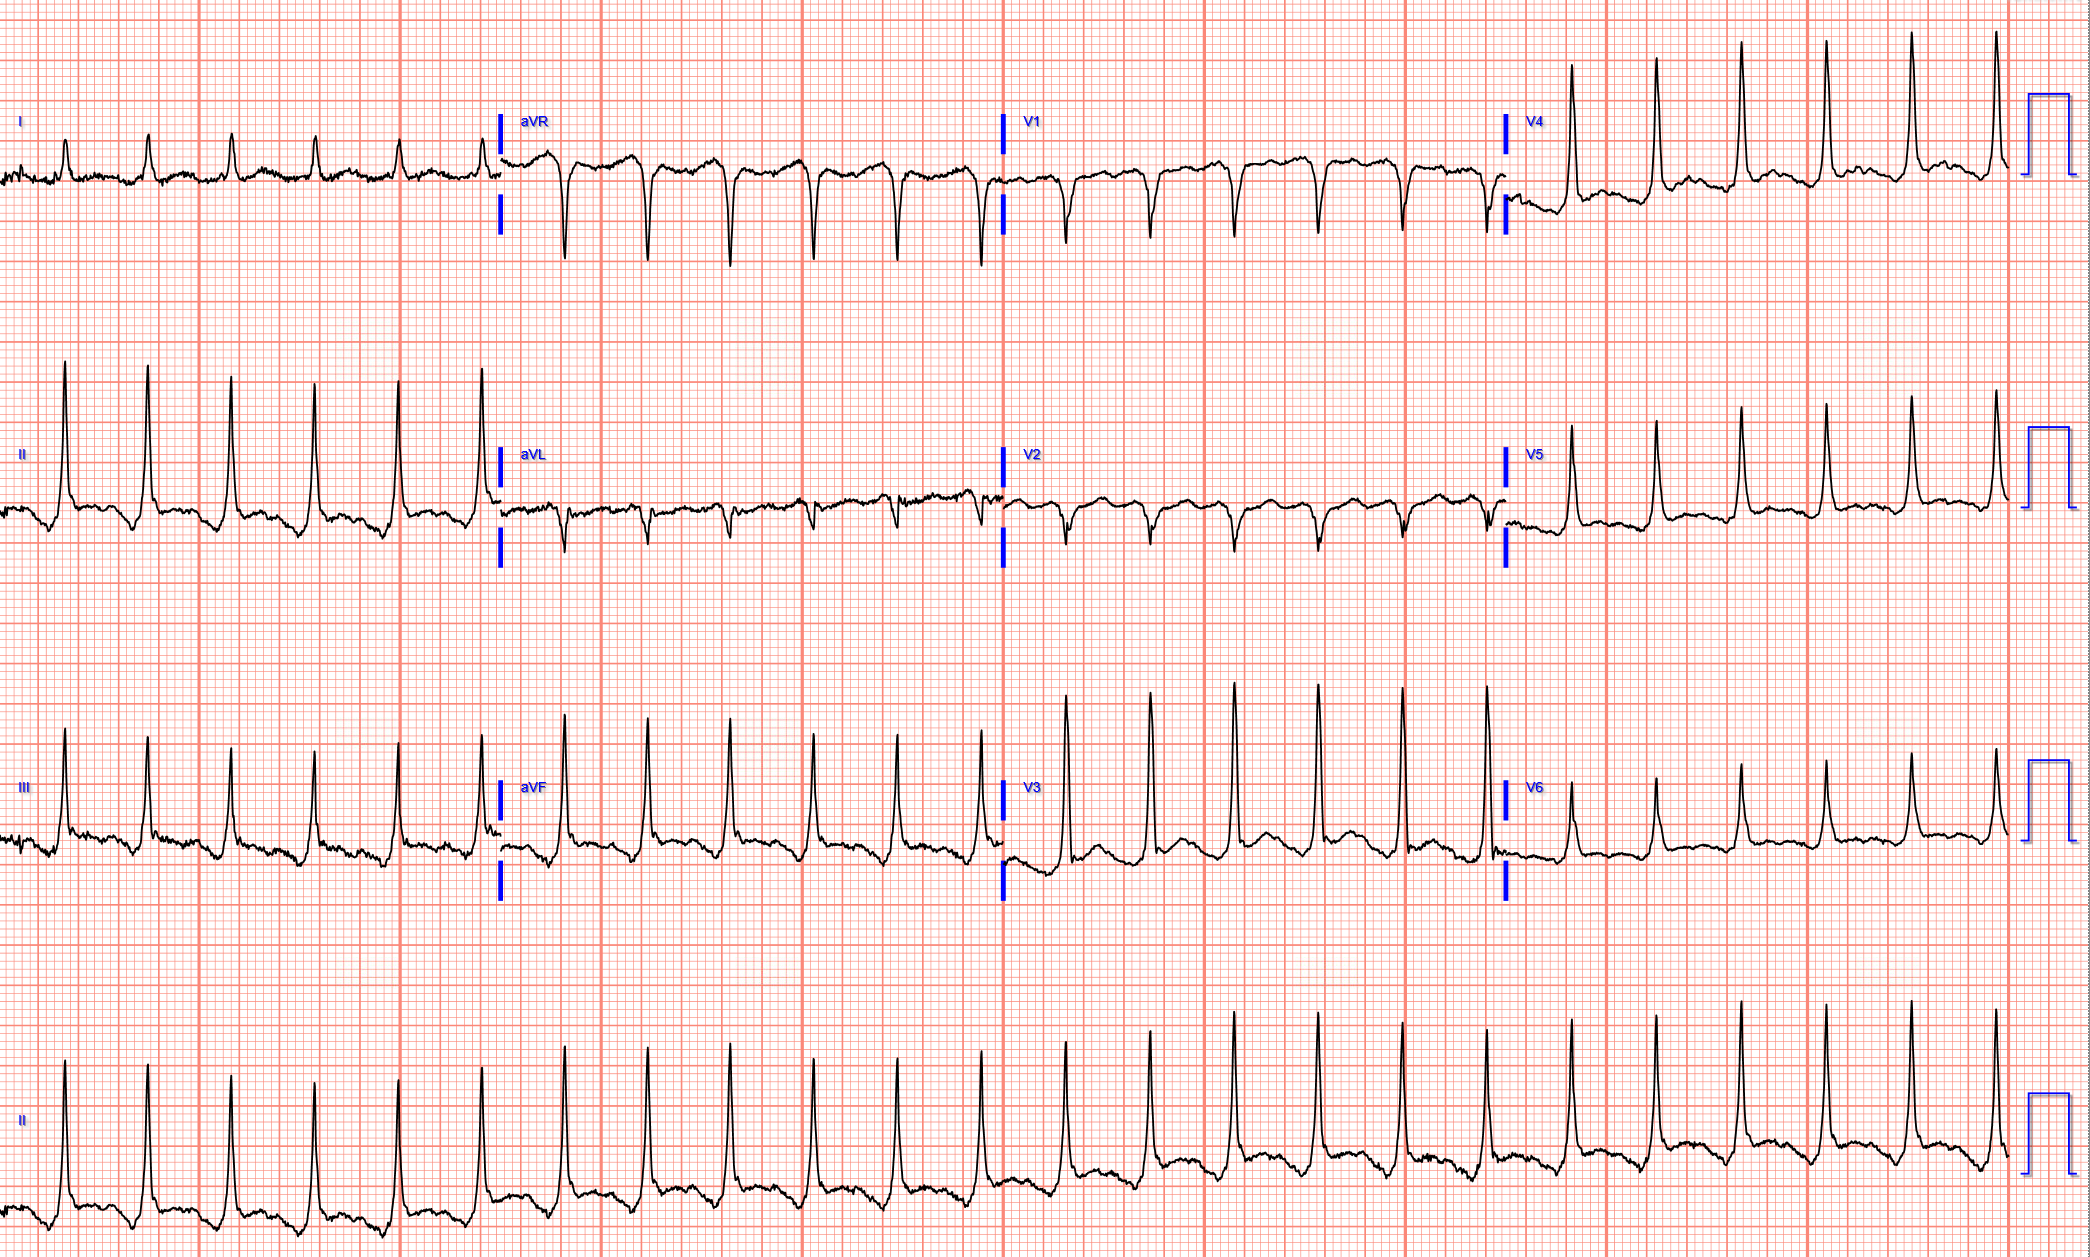
Here is her first prehospital ECG:
What do you think?


There is very low voltage in the precordial leads, with a total QRS amplitude of only 3.5 mm in V2 and 4 mm in V3.  

In spite of this low voltage, there is ST elevation (as measured at the J-point and relative to the PQ junction, and as measured by the computer and shown on the right), of 0.54 mm in V2 and 0.65 mm in V3.   

The ST/QRS ratios in V2 and V3 are, respectively, 0.154 and 0.162.  These are a high ST/QRS ratios.  
In our study of subtle LAD occlusion vs. early repolarization, the mean ratio of ST/QRS was:

-- 0.215 and 0.195 for V2 and V3 in LAD occlusion vs. 
-- 0.077 and 0.081 for V2 and V3 in early repolarization.

The specificity of a value in V2 greater than or equal to 0.154 was 90% (90 of 100 cases).
The specificity of a value in V3 greater than or equal to 0.162  was 84% (79 of 94 cases).

However, we did not include cases with less than 1 mm of ST elevation, so strictly speaking, one should be circumspect about applying such ratios.  Nevertheless, these high ratios certainly suggest that there is abnormal ST elevation in the leads of the LAD territory.

How about if we apply the LAD occlusion/early repol formula?  
STE60V3 = 1
QTc = 397
RAV4 = 0.5 
This produces a value of 24.46 (greater than 23.4 is nearly diagnostic of LAD occlusion).  However, again, the formula was developed only in ECGs with at lead 1 mm of STE in V2 and V3, so does it apply?

Here is the same ECG stretched vertically so that the QRS amplitude is closer to normal:
Now one can appreciate the ST elevation a bit better.


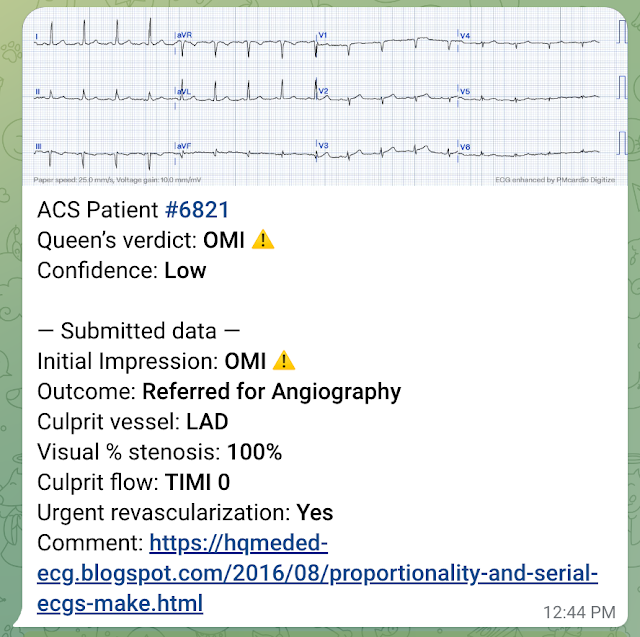
I sent this to the Queen of Hearts PMCardio AI app and the Queen diagnosed it (but with low confidence).


YOU TOO CAN HAVE THE PM Cardio AI BOT!!  (THE PM CARDIO OMI AI APP)

If you want this bot to help you make the early diagnosis of OMI and save your patient and his/her myocardium, you can sign up to get an early beta version of the bot here.  It is not yet available, but this is your way to get on the list.


Clinical Course

I don't know if the medics noticed these ECG findings or not, but if not, they recognized the value of serial ECGs in a patient with chest pain.

Here are these serial ECGs, starting with the first one again:

#1: Time zero:
STE in V2 and V3 = 0.54 and 0.65

 #2: 27 seconds later:
STE in V2 and V3 = 0.70 and 0.79

#3: 74 seconds after #2
STE in V2 and V3 = 1.11 and 1.21

#4: 56 seconds after #3:                 [157 seconds (2 min 37 sec) after the first]:
STE in V2 and V3 = 1.57 and 1.73


The medics administered aspirin (no Nitroglycerine), and the pain resolved.


#5: 18 minutes after #4:
STE is resolved

#6: 4 minutes after #5:
And remains resolved

Case Outcome

Because of ST resolution, the patient was not taken that night to the cath lab.  She was treated for NonSTEMI with antiplatelet and antithrombotic agents and went to cath the next day, where an where multiple LAD thrombi were found and the lesion will be stented.

Waiting to cath a transient STEMI can be hazardous.  See this case in which I made that mistake.


Learning Points:

1.  Repolarization (ST-T) is proportional to depolarization.  All ST elevation (and T-wave size) should be assessed relative the QRS amplitude.

2.  Serial ECGs improve the sensitivity of ST elevation on the ECG for MI.  In the only ED study of its kind, sensitivity increased from 46% to 62%.


Here they all are together:


A man in his 40s with acute chest pain. What do you think?

Sent by anonymous, written by Pendell Meyers, reviewed by Smith and Grauer

A man in his 40s presented to the ED with HTN, DM, and smoking history for evaluation of acute chest pain. He was eating lunch when he had sudden onset chest pressure, 9/10, radiating to his back, with sweating and numbness in both hands.


Triage ECG:

What do you think?


It's a very "fun" ECG, with initial ectopic atrial tachycardia (negative P waves in inferior leads conducting 1:1 with the QRSs), followed by spontaneous resolution to sinus rhythm. In the available view of the sinus rhythm, we see normal variant STE which probably meets STEMI criteria in V4 and V5. In the limb leads, where we can see the ectopic atrial rhythm in this ECG, we see the classic situation of ectopic atrial P waves causing the illusion of inferior ST elevation which is more likely due to exaggeration of atrial repolarization ("Ta waves"). This situation has been named "Emery phenomenon."

In other words, the inferior "ST elevation" is due to the abnormal rhythm, and does not signify OMI or STEMI in any way. It is a known OMI mimic that we have shown on the blog many times.

See these similar cases:


Here is the Queen of Hearts interpretation of the ECG above:


The patient had a baseline available for comparison:


The patient went back and forth into the abnormal rhythm during the initial ED course, and here is a full 12-lead of the abnormal rhythm:


It appears this one has barely managed to trick QOH. That is likely because she has not had many of these Emery phenomenon in her training yet. 


Unfortunately, this fooled the Emergency Physician and Cardiologist into an emergent angiogram for perceived "inferior STEMI." 

The angiogram showed completely normal coronary arteries.

They rhythm returned to sinus reportedly after metoprolol IV was given.

The emergent echocardiogram showed normal EF, no WMA, and normal valve function.

Three serial high sensitivity troponins were below the limit of detection.


Next day ECG:

Normal variant STE, which of course casually meets STEMI criteria in some combination of leads V3-V6 at baseline, like many normal patients do.


YOU TOO CAN HAVE THE PM Cardio AI BOT!!  (THE PM CARDIO OMI AI APP)

If you want this bot to help you make the early diagnosis of OMI and save your patient and his/her myocardium, you can sign up to get an early beta version of the bot here.  It is not yet available, but this is your way to get on the list.


Electrolytes and TSH were normal.

No use of drugs, stimulants, etc. was discovered.

Unfortunately the patient was erroneously diagnosed with "SVT / atrial fibrillation" and put on apixaban!!!

Hopefully his outpatient EP appointment will understand and correct that.


===================================

MY Comment, by KEN GRAUER, MD (9/28/2023):

===================================
If I had to choose a title for today's case — it would be, "A Tale of 2 Findings". I found this fascinating case by Dr. Meyers unique in telling 2 storie lines:
  • Story Line #1: Why is the inferior lead and chest lead ST elevation that is so evident on the initial ECGnot indicative of an acute STEMI?

  • Story Line #2: What is the fast rhythm that kept occurring until the patient was treated with IV metoprolol?

For clarity in Figure-1 — I've adapted my figure in the February 23, 2023 post of Dr. Smith's ECG Blog, in which I illustrated the Emery Phenomenon that Dr. Meyers alludes to in his excellent discussion.

Figure-1: Illustration of the Emery Phenomenon (adapted from My Comment in the February 23, 2023 post in Dr. Smith's ECG Blog — and — from the 2015 post by Dr. Bojana Uzelac on Armel Carmona’s ECG Rhythms website). The 2 sets of limb leads shown are from this Feb. 23, 2023 post — in which there is inferior lead ST elevation with the low atrial rhythm (to the LEFT) — with resolution of ST elevation after sinus rhythm was restored (to the RIGHT).
=  =  =  =  =  =  =
NOTE: The reason for the different sequencing of the limb leads in this Figure (which use a -aVR lead, that is sandwiched between leads I and II) — is that these 2 tracings were recording using the Cabrera Format (which I review in My Comment at the bottom of the page in the April 24, 2022 post).

=====================================

What Happens with the Emery Phenomenon?
The top 2 schematic illustrations in Figure-1 — explain the theory involved in the Emery Phenomenon.
  • An atrial repolarization wave (ie, the T of the P wave) is always present on ECG. With sinus rhythm, the timing of the Tp will largely coincide with the timing of the QRS complex — and therefore not be noticed on the ECG (dotted RED half circle, seen in the upper RIGHT schematic illustration in Figure-1).
  • Note that the Tp is oppositely directed to the P wave. Therefore, with normal sinus rhythm (in which by definition, the P wave will be upright in lead II) — the TP will be negative, and be contained within the QRS complex.

  • BUT — IF the P wave in lead II is negative (as may occur with either a low atrial or junctional rhythm) — then the Tp will be upright (dotted RED half circle, seen in the upper LEFT schematic in Figure-1). If the Tp wave is large in size and upright — it may distort the end of the QRS complex. And IF the PR interval of a large, negative P wave is short (ie, shorter than is shown in the upper LEFT schematic illustration) — then the upright Tp will be displaced to the right, producing the false impression of "ST elevation".

These effects of a large, negative P wave with a short PR interval on the subsequent ST segment — are seen in ECG #1 of Figure-1 (adapted from the February 23, 2023 post).
  • The angled BLUE lines to the LEFT in Figure-1 — show ST segment straightening, and what looks to be significant ST elevation in the inferior leads of ECG #1.
  • Later on in this Feb. 23, 2023 case — sinus rhythm resumes (RED arrow in the RIGHT figure, highlighting the upright P wave in lead II — with near resolution of the ST segment straightening and inferior lead ST elevation that had been seen in the LEFT figure).
=====================================

Application of the Emery Phenomenon to Today's CASE:
For clarity in Figure-2 — I've reproduced and labeled the initial ECG in today's case by Dr. Meyers. Note that I also added to this the long lead II rhythm strip done a little later in today's case, when the tachyarrhythmia recurred.
  • The "beauty" of ECG #1 from today's case — is that it captures 7 beats of tachycardia with negative P waves in each of the inferior leads (YELLOW arrows) — after which sinus rhythm resumes, with upright P waves beginning with beat #8 in the long lead II rhythm strip (RED arrow over the upright P wave in front of beat #8).
  • Note that the negative P waves in each of the inferior leads during the first 7 beats — manifest a fairly large negative deflection with a very short PR interval.
  • Note especially that what appears to be "ST elevation" in each of the inferior leads during these first 7 beats — abruptly resolves the moment sinus rhythm resumes (seen wonderfully here by following the ST segment in the long lead II rhythm strip of ECG #1). This is the Emery Phenomenon. There was no true ST elevation in the inferior leads — only "pseudo-ST elevation" produced by the large upright Tp during the first 7 beats in which inferior leads had a large negative P wave with short PR interval!

  • Finally — Note the very prominent J-point notching, with upward-sloping ST elevation in lead V4, that is virtually diagnostic of a benign repolarization variant.
  
Figure-2: I've reproduced and labeled the initial ECG from today's case — to which I've added below the long lead II rhythm strip done a little later in today's case, when the tachyarrhythmia recurred.

=====================================
What About the Tachycardia?
The question arises as to what is the recurrent tachycardia seen in today's case, up until treatment with IV metoprolol suppressed this rhythm?
  • As always — I favor assessment of the 5 Parameters contained within the Ps, Qs, 3R Approach as the most user-friendly, time-efficient system for accurate rhythm interpretation (For more on the Ps,Qs,3Rs — See my January 26, 2023 post in Dr. Smith's ECG Blog).

Applying the Ps,Qs,3R Approach to the long lead II rhythm strip that appears at the bottom of ECG #1 in Figure-2:
  • The first 7 beats seem to show a fairly Regular rhythm — with narrow QRS complexes — at a Rate of ~115/minute (R-R interval of ~2.6 large boxes in duration) — with negative P waves that are Related to neighboring QRS complexes with a short and constant PR interval.

PEARL #1: There is a differential diagnosis for the regular SVT (SupraVentricular Tachycardia) rhythm that we have just described — which in large part is based on the presence and nature of atrial activity (For more on distinguishing the various SVT rhythms — See My Comment at the bottom of the page in the March 6, 2020 post in Dr. Smith's ECG Blog).
  • Today's regular SVT rhythm could be an ectopic atrial tachycardia (ATach) — or an automatic junctional tachycardia(NOTE: Automatic junctional tachycardia is not common. ATach will be seen much more often in a nonselected practice. The fact that the PR interval of this negative P wave in lead II is short does not distinguish between these 2 entities. Initial emergency management is similar for both entities).

  • Alternatively — Today's regular SVT rhythm could be the much less common "fast-slow" form of AVNRT (as I illustrate with laddergram in Figure-3 of My Comment in the March 6, 2020 post). And while initial treatment of all 3 of these SVT rhythms may be similiar (ie, The IV metoprolol that was successful in today's case will probably work for any of these SVTs) — the longterm management of ATach vs the "fast-slow" form of reentry SVT may differ.

PEARL #2: Did YOU notice HOW the 7-beat run of SVT in the long lead II rhythm strip of ECG #1 began? One of the most commonly overlooked Pearls of tachycardia interpretation — is the failure to look at HOW the tachycardia begins and ends. Admittedly — we often are not privileged to see this information. However, in ECG #1 — We see both the onset and offset of the SVT!
  • The BLUE arrows that I drew in at the very beginning of leads II and III of ECG #1 — highlight that beat #1 in the long lead II rhythm strip is different! Because of where this ECG begins to record — we unfortunately do not see the QRS complex that occurs just before beat #1. But it is clear that the deflections under these BLUE arrows in leads II and III are different than the deflections under the 2 YELLOW arrows that follow. (QRS morphology of beat #1, especially in lead III — is also different than QRS morphology of beats #2-thru-7 that follow).
  • The different QRS morphology of beat #1 is probably the result of aberrant conduction.
  • The different deflection ( = T wave and/or T wave with PAC superimposed) under the 2 BLUE arrows to me suggested abrupt onset of today's SVT, most likely by a PAC. Initially this suggested to me that rather than ATach — the mechanism of today's SVT might be the fast-slow" form of AVNRT.

  • BOTTOM Line: The above are advanced points that are academic because we cannot know what happened with beat #1 since we don't see the QRS before this beat. MY point that is relevant to optimal arrhythmia interpretation — is to always look to see if there is a "break" in the rhythm at the onset or offset of the tachycardia — since if present, this will often tell you the specific diagnosis!

PEARL #3: Ectopic ATach arises from an independent atrial focus. It is characterized by: i) P wave morphology different than morphology of sinus P waves (YELLOW vs RED arrows in ECG #1)ii) As opposed to the common reentry SVT rhythms (ie, "slow-fast" and "fast-slow" forms of AVNRT; and AVRT) that typically begin with one or more PACs — ATach often begins with a "warm-up" phenomenon (ie, gradual acceleration of the ectopic atrial focus) — and ATach often ends with a "cool-down" phenomenon (ie, gradual slowing of the ectopic atrial focus).
  • Did YOU notice that the rate of today's SVT was significantly faster during the sustained SVT episode (ie, ~140/minute in the long lead II done later in the ED — compared to ~115/minute for the 7-beat run in ECG #1)? 

  • The fact that the rate of today's SVT was faster when the rhythm was sustained — but slowed down right before conversion to sinus rhythm (ie, with beat #8 in the long lead II of ECG #1) — suggests there was a "cool-down" phenomenon, as today's SVT gradually slowed until spontanenous conversion to sinus rhythm. This is much more consistent with ectopic ATach as the etiology of today's SVT. 

Wednesday, September 27, 2023

Very fast regular tachycardia: 2 ECGs from the same patient. What is going on?

This was written by Magnus Nossen, from Norway, with comments and additions by Smith


A 50 something smoker with no previous medical hx contacted EMS due to acute onset chest pain. Upon EMS arrival the patient appeared acutely ill and complained of chest pain. An ECG was recorded immediately and is shown below. How do you interpret the ECG?

ECG#1

There is a regular tachycardia with a ventricular rate of about 180 bpm. 

Smith comment: When there is a regular wide complex tachycardia, first assess whether it is sinus or not.  At a rate of 180, this is unlikely.  The patient is unstable.  Therefore, the first step is to cardiovert.  This can be done with adenosine or electricity.  After cardioversion, if successful, you can take a few moments to assess the 12-lead in more detail and assess the post conversion ECG.  In this analysis, it is critical to assess whether the initial depolarization is rapid or slow.  If rapid, that means that the depolarization is rapidly advancing and that it must be using conducting fibers (Purkinje fibers), and is therefore supraventricular.  Is it sinus or is it a supraventricular dysrhythmia?  Other important considerations are 1) whether is looks like a typical RBBB, LBBB, 2) whether it looks "bizarre" (meaning there are no RS complexes and, if not, whether the unipolar complexes are "concordant' (all with the same precordial polarity), and 3) whether there is a "northwest" axis (between -90 and 180).  Analysis: In V1, there is an RS and it is rapid, just over 40 ms from the onset of the r-wave to the nadir of the s-wave.  This means it is supraventricular.  It is not VT.  


Magnus explains more here:

In the limb leads there is leftward axis consistent with LAFB. What appears to be very wide QRS complexes is in fact huge ST-segment deviations. This will become more apparent if you zoom in on lead V1 or lead aVL were the J point is most easily identified. Then imagine drawing a vertical line intersecting the other QRS complexes. The ST elevation in V2-V6 as well as in I and aVL becomes easily recognizable. There are retrograde P waves visible in the ST segment of the inferior leads, most easily seen in lead II. Thus the above ECG shows a supraventricular tachycardia with retrograde P waves visible in the ST segment in the inferior leads and massive current of injury in the anterior and lateral leads consistent with extensive OMI.  Put shortly is SVT with "Shark Fin STE" and not ventricular tachycardia.

Is there OMI?  How did the PM Cardio Queen of Hearts perform: OMI with low confidence.


Within a moment of recording the first ECG the patient had loss of consciousness and the ECG on the monitor changed. 

ECG#2
What do you think?


Smith: The rate is faster.  There is no longer an RS in V1. There is now concordance.  Not only that, but the time from QRS onset to peak is now nearly 120 ms, which tells us that this is VT.

Magnus: The ECG now shows a wide complex tachycardia with a ventricular rate of about 210 bpm, which is  faster than on the initial ECG. There is definite change in the morphology of the waveforms and there is also significant change in the polarity of the QRS complexes in the precordial leads. In ECG #1 there was monophasic R-waves V2-V6. In ECG#2 there is no longer concordance of QRS complexes V2-V6. There is a gradual shift of polarity occurring throughout the precordial leads. There also is slight QRS morphologic variation during the recording making the ECG recording consistent with that of a pleomorphic VT. Resuscitation efforts were undertaken. The patient went in and out of ROSC.

The ECG below (recorded during brief ROSC) shows both normal ventricular activation (in the beginning of the recording there is sinus rhythm) and polymorphic ventricular tachycardia (second half of the tracing) In other words the ECG below proves that the first ECG does show some type of supraventricular tachycardia based on QRS morphology and QRS axis.

Is there OMI?  How did the PM Cardio Queen of Hearts perform: Not OMI with low confidence.

ECG#3

Resuscitation efforts were ongoing. ROSC was achieved shortly before new episodes of ventricular tachycardia. After amiodarone and several defibrillations and about 20 minutes after initial arrest, stable ROSC was achieved. The patient was air lifted to PCI center. The following two ECGs were recorded during transport

Is there OMI?  How did the PM Cardio Queen of Hearts perform: OMI with low confidence.


ECG#4

The ECG above and below both were recorded after ROSC was achieved. Both of the ECG essentially show the same thing. An electrocardiographically huge OMI with Shark Fin ST-elevations. The above ECG has ventricular bigeminy with RBBB and LAFB morphology. The ECG below show a very clean and text book example of triangular QRST waveform also know "Shark Fin". Added on the right is the J-point marked with vertical red line.

Is there OMI?  How did the PM Cardio Queen of Hearts perform: OMI with high confidence.


ECG#5

There was acute 100% occlusion of the proximal LAD. 

Other coronaries were normal. The hospital stay was complicated by aspiration pneumonia, recurring ventricular tachycardia and a mural thrombus. Echocardiography showed and anterior and apical WMA with estimated LVEF 40%. An ICD was placed. Troponin T peaked at "only" just above 2000 ng/L. The patient ultimately did well. 

Is there OMI?  How did the PM Cardio Queen of Hearts perform: OMI with high confidence.


Learning points from Smith:
1. Sinus tachycardia, or other SVT, with aberrancy or bundle branch block can mimic VT.
2. Sinus tach, or other SVT, with Shark Fin can also mimic VT
3. If the first part of the QRS is fast, the rhythm is likely suparventricular (including sinus)
4. If the rate is 180 or greater, it is probably not sinus.
5. If the patient is unstable, and there is a regular tachycardia, whether narrow or wide, immediate cardioversion with either adenosine or electricity is indicated.


Bonus:  What is this here?


===================================

MY Comment, by KEN GRAUER, MD (9/27/2023):

===================================
Fascinating series of tracings by Dr. Nossen — that illustrate dramatic shark fin morphology from acute LAD OMI. The patient required resuscitation for recurrent polymorphic VT — but fortunately was successfully transferred to the PCI center, where reperfusion was achieved.

Of academic interest — are the arrhythmias that developed. I focus my comment on problem-solving distinction between supraventricular vs ventricular rhythms.
  • To facilitate visualization — I have consolidated in Figure-1 today's 5 tracings into 5 2-lead rhythm strips, labeled sequentially from the 5 ECGs in today's case.

Figure-1: To facilitate visualization (and to consolidate today's case) — I look at leads I and II, taken from each of the 5 ECGs in today's case.


What is the SupraVentricular Rhythm?
As I emphasize above — my discussion regarding rhythm problem-solving is academic, in that fast rhythms associated with hemodynamic instability in today's case needed electricity, without need to specify all details of the rhythm. This was the case in ECG #2 — in which this monomorphic, extremely wide and fast VT rhythm was associated with loss of consciousness.
  • The patient was shocked — and then began a long intensive process of resuscitation.
  • Some time after electrically converting the VT rhythm in ECG #2 — the rhythm shown in ECG #3 was recorded, in which RED arrows highlight sinus P waves for the first 4 beats in this tracing (before the rhythm deteriorated to PolyMorphic VT for the remainder of the tracing).

  • Although I initially was uncertain about the etiology of the rhythm in ECG #1 — the finding of a virtually identical QRS morphology for the 4 sinus-conducted beats that are clearly seen at the beginning of the lead II rhythm strip in ECG #3 — strongly suggested that the rhythm in ECG #1 was supraventricular! Shark fin ST elevation (well seen in lead I of ECG #1) gave the false appearance of QRS widening. This meant that the negative deflections seen just after the QRS in lead II of ECG #1 had to represent retrograde P waves with a fairly long RP' interval. Thus, retrospectively— the rhythm for ECG #1 (at least for beats #5-thru-16 in ECG #1) had to represent a reentry SVT at ~170-180/minute, with retrograde P waves.

  • VT recurred a number of times — and IV Amiodarone was given. At some point during this process, ECG #4 was obtained. Once again — knowledge of what sinus-conducted QRS complexes look like (made evident by the first 4 beats in ECG #3) — facilitated my being able to walk out regular sinus P waves (RED arrows) throughout the entire lead II rhythm strip in ECG #4. As it can be seen that the QRS complex of each even-numbered beat is wider, and has a PR interval too short to conduct — the rhythm in ECG #4 has to represent ventricular bigeminy.

  • Finally — normal sinus rhythm was achieved and maintained in ECG #5. Note that the shark fin ST elevation persists in lead I of ECG #5 — and the QRS complex of the sinus-conducted beats in this tracing can clearly be seen in lead II to be narrow.

The Arrhythmia Lesson to be Learned:
I was not initially confident about my interpretation of the rhythm in today's 5 tracings. Sometimes — a "tincture of time" with access to additional tracings is needed to "put together" the pieces of the arrhythmia puzzle.
  • In today's case — Seeing those 4 sinus-conducted beats at the beginning of ECG #3 — confirmed to me that the rhythm in ECG #1 was a reentry SVT with retrograde P waves — and that the rhythm in ECG #4 was ventricular bigeminy.


Recommended Resources