A 60 yo with 2 previous inferior (RCA) STEMIs, stented, called 911 for one hour of chest pain. He had no h/o heart failure.
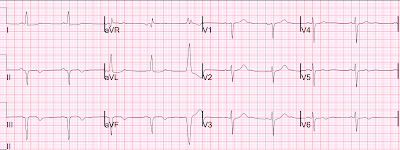
Here is the first prehospital ECG (time 0, after one hour of pain):
Here is the 2nd prehospital ECG (time 10 minutes, after 70 minutes of pain):
On arrival, the first ED ECG was recorded 20 minutes after the last one (90 minutes after pain onset):
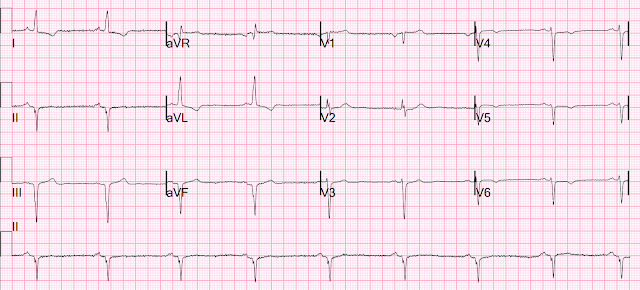
Here is his most recent previous ECG:
This was recorded after intervention for inferior STEMI (with massive ST Elevation, see below), and shows inferior Q-waves with T-wave inversion typical of completed inferior OMI. Peak troponin at that time was 32.5 ng/mL (quite large). The ejection fraction after this infarction was 60%; it had been 70% prior to the infarction.Here is the presentation ECG for that inferior STEMI:
This looks like a large infarct on ECG. The inferior STEMI 3 years prior to this had a similar ECG.The ST depression in V2 is diagnostic of posterior OMI, especially when you can see that it is change from 20 minutes prior.
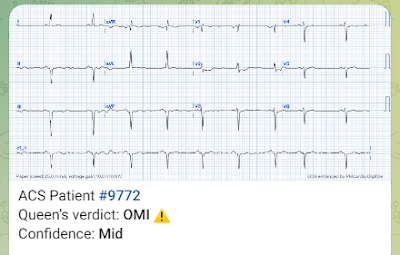
Here is the Queen's interpretation (she has no access to prior or serial ECGs -- that is something we plan to add in the future):
Unlike a lot of deep convolutional neural network artificial intelligence, which is a black box and thus engenders mistrust of the results (is she hallucinating, like chatGPT?), the Queen of Heart has explainability. Here she explains why:
80 minutes after first ED ECG, patient's pain was much better:
Here is the explanation (explainability in AI)
Case continued
The cath lab was activated rapidly. DBT was 120 minutes, pretty good for a Non-STEMI OMI.
The first hs troponin I returned at 1100 ng/L
Angiogram
Lesion on 1st Obtuse Marginal: Proximal subsection = 90% stenosis Stented. Pre procedure TIMI III flow was noted. Post Procedure TIMI III flow was present. So the artery had completely spontaneously reperfused prior to intervention; the duration of occlusion was perhaps 2 hours
The troponin peaked at 60,000 ng/L (a very large infarction)
Formal bubble contrast echocardiogram
--The estimated left ventricular ejection fraction is 46%.
--Regional wall motion abnormality-inferior.
--Regional wall motion abnormality-inferolateral. (This means posterior in common terminology)
--Normal LV cavity size with moderately increased thickness.
Previous echo:
Normal estimated left ventricular ejection fraction - 60%.
Regional wall motion abnormality, inferior and probably inferolateral.
So he has lost 25% of his ejection fraction in the acute phase.
Here is the next day ECG:
2 years later, in the chronic phase, his ejection fraction after remodeling was 15-20%. This is without any intervening infarction. He has "ischemic cardiomyopathy" and "congestive heart failure." And this is after undergoing very rapid intervention.
What may appear to be a small "Non-STEMI" on the ECG is a very large OMI. From this most recent "NSTEMI" he developed heart failure, in spite of rapid treatment.
This is why NSTEMI is a worthless term. It has no function. It should be abandoned.
NSTEMI is a huge spectrum from tiny infarcts to massive OMI. ST Elevation or its absence does not tell you whether there is acute occlusion or not and does not tell you how much myocardium is at risk.
This graphic shows this spectrum:
The vertical axis is infarct size as measured by peak troponin.
From:
Meyers, Bracey, Smith, et al. Journal of Emergency Medicine. Comparison of the ST elevation myocardial infarction (STEMI) vs. NSTEMI and Occlusion MI (OMI) vs. NOMI paradigms of acute MI
- For clarity — I've selected just 2 of today's tracings, and have put them together in Figure-1. As noted on the repeat tracing — the patient's CP was much improved at the time this 2nd ED ECG was obtained, which was ~80 minutes after ECG #3.
-USE.png) |
| Figure-1: The 3rd and 4th ECGs recorded in today's case (which were the 1st and 2nd ECGs recorded in the ED). |
- As highlighted within the colored rectangles — the KEY lead in both of the ECGs shown in Figure-1 is lead V2.
- The initial ECG recorded in the ED shows early transition (with a predominant R wave already by lead V2) — and a positive "Mirror Test" in the form of the "shelf-like" shape of abnormal ST depression in lead V2 (For more on "My Take" regarding the Mirror Test — See My Comment in the September 21, 2022 post of Dr. Smith's ECG Blog). Other ECG changes in this initial ED tracing primarily consist of nonspecific ST-T wave flattening in most of the remaining leads. It is because of lead V2 in this patient with new CP — that the diagnosis of acute posterior OMI is made.
- The diagnosis of acute posterior OMI is solidified by the repeat ECG in the ED, that was done ~80 minutes after ECG #3. As shown within the RED rectangle — the shelf-like ST depression has virtually resolved in ECG #4 — which when correlated with marked reduction in CP — confirms the diagnosis of dynamic ST-T wave changes, with need for prompt cath with PCI. The remaining leads in this repeat ECG show subtle changes consistent with reperfusion — but in the absence of the above described dynamic change in lead V2, the ECG findings in other leads would be non-diagnostic.
- Appreciation of the modest-but-definitely-identifiable ST-T wave changes highlighted within the colored rectangles in Figure-1, when correlated to the presence and severity of the patient's symptoms — is a skill that can be taught to clinician's receptive to these ECG findings that are diagnostic of acute OMI.


-USE.png)
.png)
.png)
.png)


-USE.png)