Written by Bobby Nicholson MD, with edits by Meyers, Smith, Grauer
A woman in her early 40s presented to the emergency department for evaluation of palpitations. She reported that she has been experiencing this since she was diagnosed with COVID a little over 1 week ago. She reported a prior history of SVT and has previously performed vagal maneuvers at home with symptom resolution. She reports that she is now unable to vagal out of her palpitations and is having shortness of breath and dull chest pain. Her initial EKG is below.
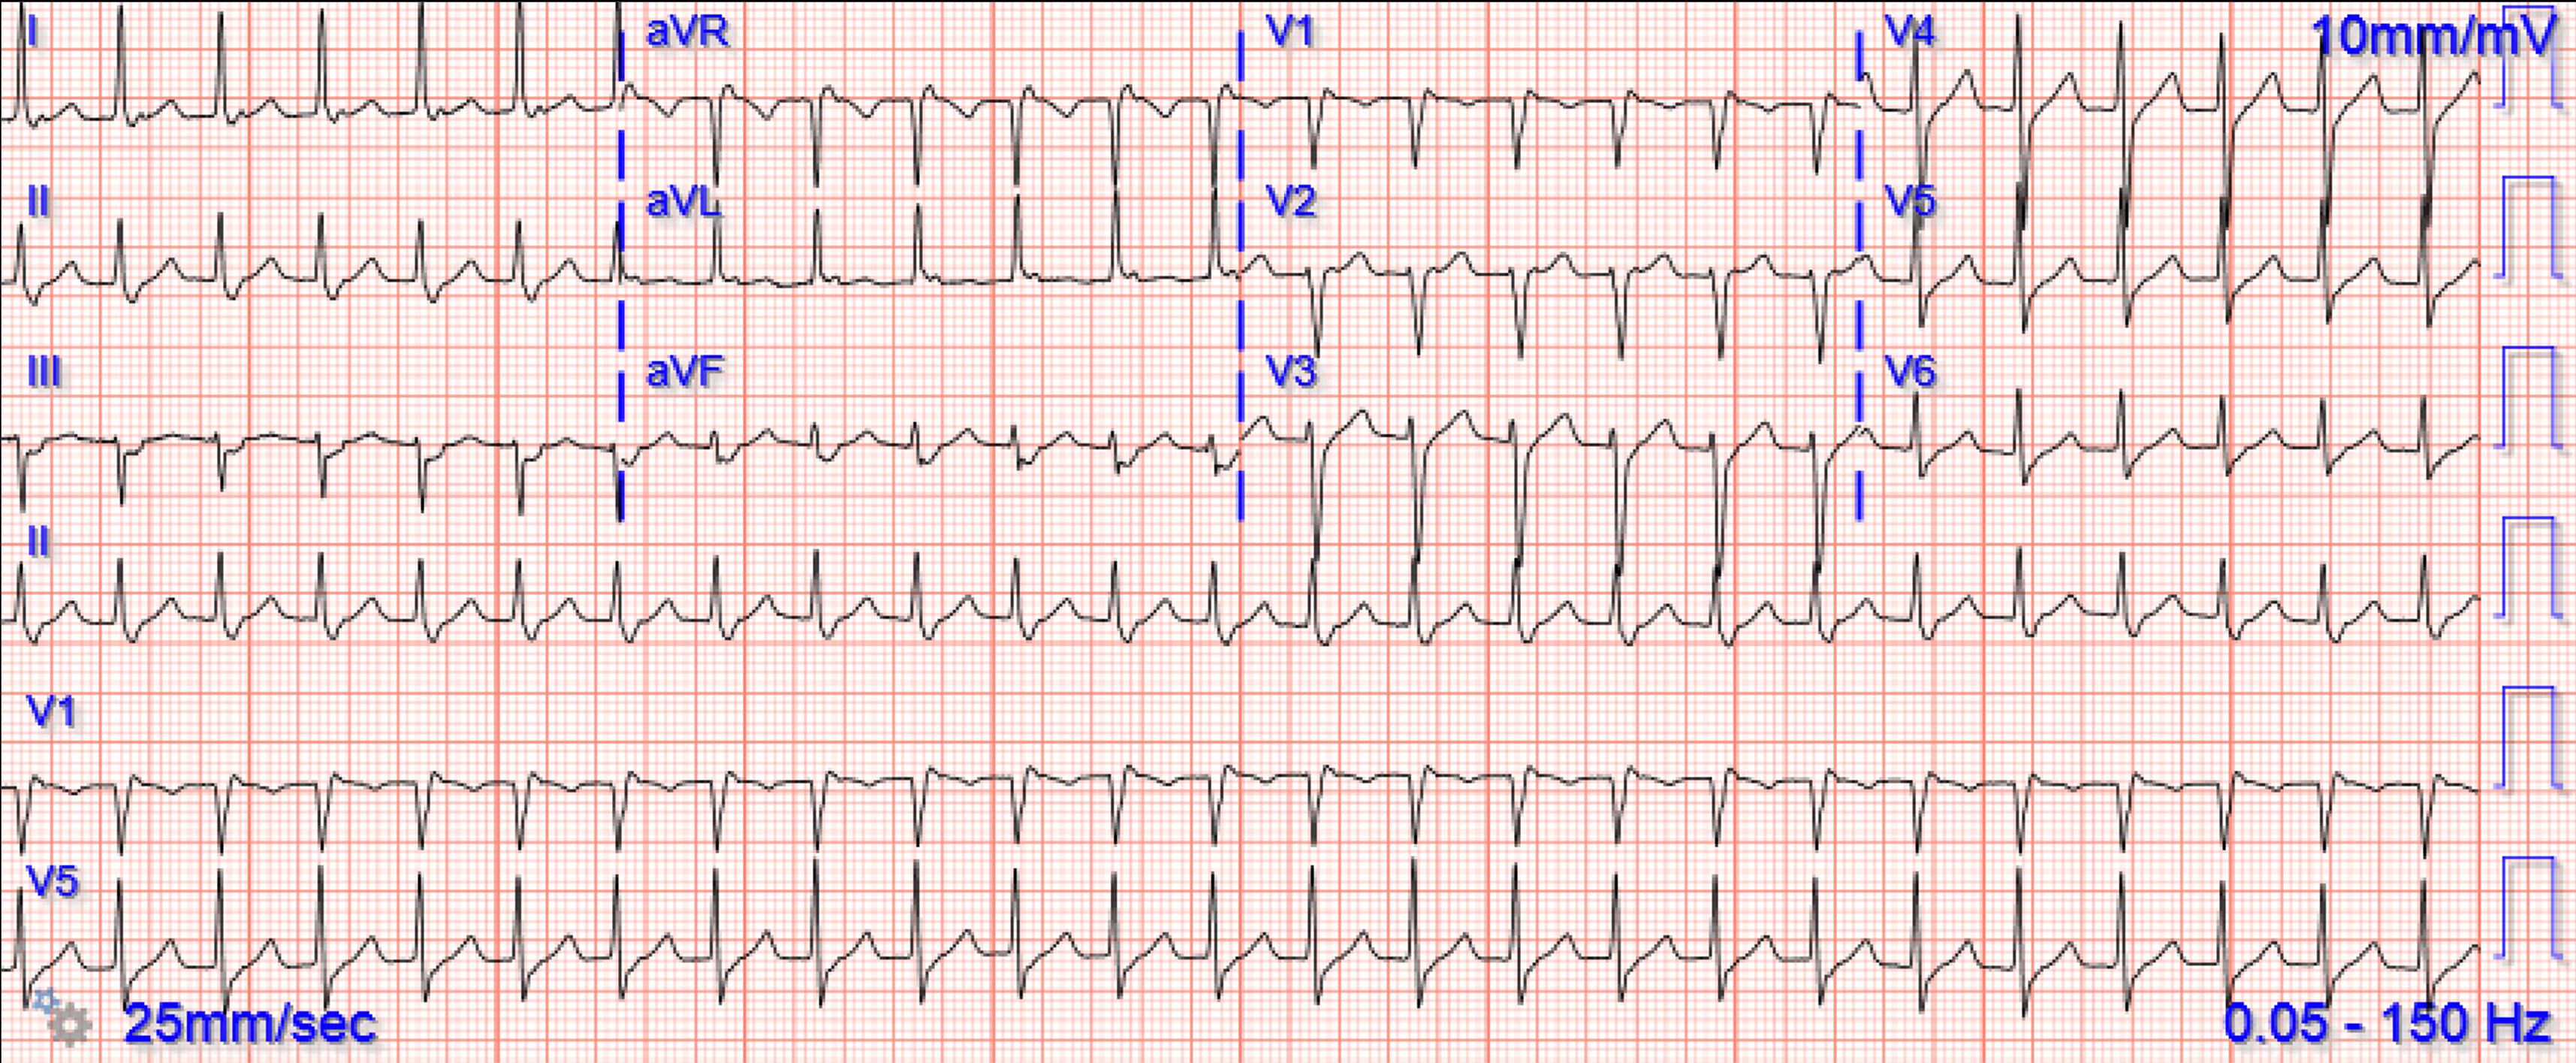
We see a regular tachycardia with a narrow QRS complex and
no evidence of OMI or subendocardial ischemia. The differential of a regular narrow QRS tachycardia is sinus tachycardia, SVT, and atrial flutter with regular conduction. There are no P waves preceding the QRS complexes, and no clear flutter
waves. SVT is by far the most likely rhythm in this case.
There are retrograde P waves seen immediately after the QRS complex in most leads. They are inverted in lead II, for example.
She was treated with 6mg adenosine rapid IV push. The following EKG was obtained after administration
of adenosine.
Now the patient is in sinus tachycardia. Unfortunately, shortly after
this EKG was obtained, the patient returned to SVT.
 |
| Same as initial ECG. |
Smith: should we give adenosine again?
Smith: No! Adenosine worked. It converted the rhythm. But adenosine only lasts for seconds, and if the dysrhythmia recurs, then the adenosine is gone.
We need to do one or both of two things:
1. Prevent the initiation of the dysrhythmia -- this can be done with a beta blocker by prenenting PACS
2. Have a long acting AV nodal blocker -- this can be done with a longer acting AV nodal blocker: both a beta blocker or calcium channel blocker.
Metoprolol (beta blocker) thus does BOTH
1. Prevents the PAC that initiates SVT2. Blocks the AV node to prevent propagation.Diltiazem and Verapamil (Calcium channel blockers) block AV conduction
Dosing
Metoprolol
5 mg IV q 5 minutes x 3 (max 15 mg), then 25-50 mg orally. Verapamil
Dosed at 2.5-5 mg IV over 2 min (over 3 min in elderly patients).
A follow-up dose of 5-10 mg (0.15 mg/kg) IV is administered 15-30 min later if the SVT persists and no adverse reaction occurs. The maximum dose is 20-30 mg.
This may be followed by an infusion of 0.005 mg/kg/min.
Diltiazem
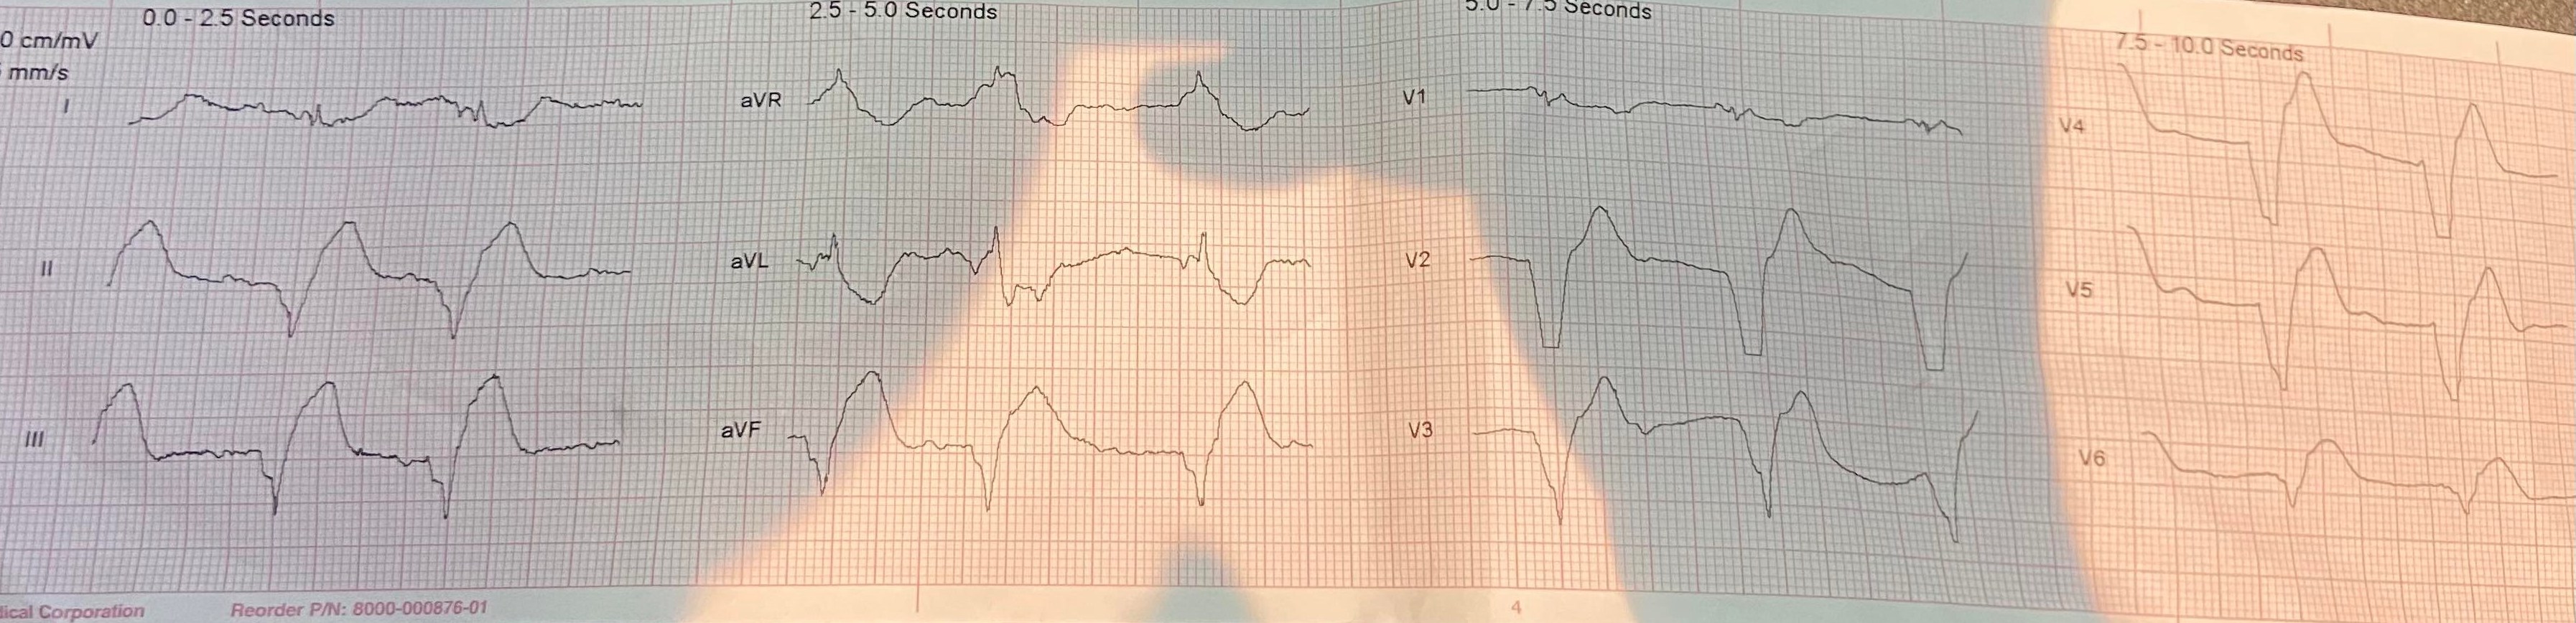
She
remained hemodynamically stable and was treated with 10 mg of IV diltiazem. The
following EKG was obtained
After treatment with diltiazem, the patient remained in
normal sinus rhythm with a rate persistently in the 80s and 90s.
Given recurring SVT without obvious resolution of its cause, she was admitted for further observation and did not have any recurrence. She had an echocardiogram which was normal. She was prescribed oral diltiazem to prevent recurrence and was discharged.
===================================
MY Comment, by KEN GRAUER, MD (10/25/2022):
===================================
Today’s blog post reviews the important topic of how to approach the patient who presents with palpitations from an SVT (SupraVentricular Tachycardia) rhythm. I focus my comments on a number of additional points aimed at supplementing the above excellent discussion by Drs. Nicholson and Meyers.
- Today’s patient is a 43-year old woman with a history of intermittent “SVT” that in the past has responded to vagal maneuvers that she performed on herself at home.
Some General Thoughts on SVTs:
I’ve previously reviewed in detail an approach to the regular SVT (Please see My Comment — at the bottom of the page in the March 6, 2020 post in Dr. Smith’s ECG Blog). Relevant points from that discussion that relate to today’s case include the following: - Knowing that today’s patient had a history of intermittent “SVT” does not tell us the specific rhythm involved. Even experienced providers make the mistake of using the term, “SVT” as a specific diagnosis — when in fact this generic term includes all arrhythmias in which the rate is “tachycardic” (ie, ≥100 in an adult). This includes sinus tachycardia, atrial fibrillation or flutter, MAT, and others. Causes and treatments for these various forms of “SVT” may differ.
- The above said — the fact that today’s patient describes success with home vagal maneuvers strongly suggests that we are dealing with some type of reentry SVT rhythm.
- For optimal initial and longterm care of today’s patient — additional features in the History to inquire about include the following: i) How long this patient has had SVT? — How often she gets it? — and — How long it takes vagal maneuvers to work?; ii) Are there any specific precipitating factors? (ie, dehydration, periods of increased stress or anxiety, stimulants such as caffeine, alcohol, recreational drugs, etc.); iii) How often has she had to go to the ED for her SVT?; and, iv) Previous treatments tried?
Diagnosis of Today’s Rhythm:
I favor a systematic approach to rhythm interpretation — in which the memory aid, “Watch your Ps, Qs and 3Rs” reminds me of the 5 KEY parameters to assess (CLICK HERE — if interested in more on this Ps, Qs, 3R approach). - For clarity in Figure-1 — I’ve reproduced and labeled the initial ECG in today’s case, with the follow-up 12-lead after administration of 6 mg IV Adenosine.
- Applying the Ps, Qs, 3R Approach to ECG #1 — there is a regular SVT ( = narrow QRS) rhythm at a rate of ~140/minute, without sign of sinus P waves.
- PEARL: It’s important to keep in mind the importance of the rate of a regular SVT rhythm — since since entities such as sinus tachycardia (with sinus P waves hidden within preceding T waves) and atrial flutter (with 2:1 AV conduction) become become far less likely when the rate of a regular SVT exceeds ~170/minute.
- In contrast, a regular SVT rhythm at a rate between ~130-160/minute (as in today’s case) — includes a differential diagnosis of i) Sinus tachycardia; ii) AFlutter (Atrial Flutter); iii) ATach (Atrial Tachycardia); and/or, iv) A “reentry” SVT rhythm (with AVNRT and orthodromic AVRT being the most common forms of this).
CHALLENGE:
Compare QRS morphology for the 2 ECGs shown in Figure-1. With attention to the RED arrows in ECG #1 — What is the difference in QRS morphology between these 2 tracings?
- Clinically — What is the significance of this difference?
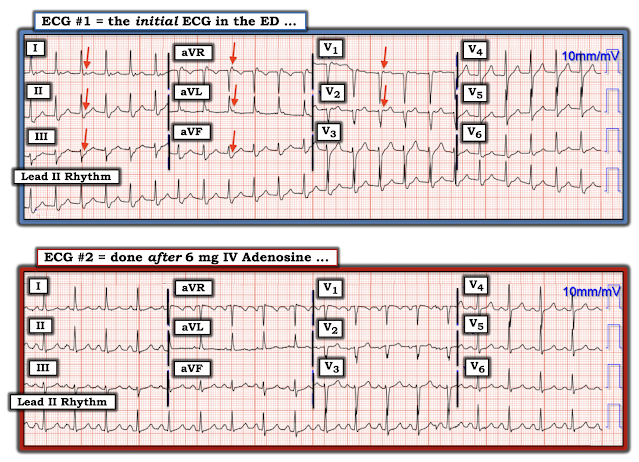 |
| Figure-1: The first 2 ECGs in today’s case. What is the clinical significance of the RED arrows in ECG #1? |
Those RED Arrows in ECG #1:
The RED arrows in Figure-1 highlight 7 leads in ECG #1 that show retrograde atrial activity during the tachycardia.
- PEARL: The clinical significance of identifying retrograde atrial conduction during a regular SVT rhythm (such as the one in today’s case) — is that it confirms the diagnosis of a reentry SVT rhythm! Sinus tachycardia, AFlutter and ATach do not do this.
- To Emphasize — It is not common to see clear evidence of retrograde conduction in as many leads as shown by the RED arrows in ECG #1. The reason I highlight this finding — is that knowing how to look for retrograde atrial activity is helpful when its presence is far more subtle. This is because once we can confirm the diagnosis of a reentry SVT — we know what optimal treatment in the ED will be if our initial dose of Adenosine is ineffective (ie, repeat Adenosine and/or Diltiazem, Verapamil or a ß-Blocker).
How to Confirm Retrograde Conduction:
Retrograde conduction produces a negative P wave that appears after the QRS in the inferior leads. This is because the retrograde impulse is traveling away from the direction of lead II, which is positively oriented at +60 degrees.
- As a result, when looking for retrograde atrial activity — I first focus my attention on the very last part of the QRS in the inferior leads (II,III,aVF) — looking for a negative notch or deflection in one or more of these leads. The wide, “pseudo-S wave” seen in each of the inferior leads in ECG #1 is distinctly unusual, especially given the absence of RBBB conduction. Proof that this truly represents retrograde atrial conduction in ECG #1 — is forthcoming by comparison of these leads in ECG #2, in which this negative “pseudo-S wave” deflection in the inferior leads after conversion to sinus rhythm is much narrower.
- After the inferior leads — I look next at right-sided leads aVR and V1 — which commonly show retrograde conduction as a short positive “pseudo-r’ deflection” (RED arrows in leads aVR and V1 in ECG #1). Note that this pseudo-r’ deflection is no longer present in ECG #2 after conversion to sinus rhythm.
- Sometimes lead aVL shows retrograde conduction as a positive deflection after the QRS (as seen in ECG #1).
- In my experience — it is less common to see retrograde conduction in other leads.
- HINT: The way to get good at recognizing retrograde conduction during regular SVT rhythms — is to routinely go back and compare deflections that you thought looked suspicious during the tachycardia — with QRS morphology in those same leads after conversion to sinus rhythm. BOTTOM Line: It’s nice to be able to definitively diagnose that the cause of the regular SVT rhythm in front of you is a reentry SVT. Identifying retrograde atrial conduction during a regular SVT rhythm allows you to do so.
- CAVEAT: The opposite is not necessarily true — because some cases of AVNRT manifest such a short RP’ interval, that the retrograde P wave is hidden within the terminal part of the QRS (and therefore not visible on ECG).
PEARL: The RP’ interval (ie, distance of the retrograde P wave from the preceding R wave) — can provide a clue to the mechanism of the reentry SVT. For example — very short RP’ intervals (in which the retrograde P wave notches the terminal portion of the QRS complex) — suggest that the reentry circuit is contained within the AV node. In contrast — longer RP’ intervals (in which the retrograde P wave notches a portion of the ST segment) suggest that an AP (Accessory Pathway) which is located “further away” (ie, outside of the AV node) may be participating in the reentry circuit.
- The RED arrows in today’s case suggest a fairly short RP’ interval — that is more consistent with AVNRT.
- For more on the concept of retrograde conduction during a regular SVT rhythm — Please see My Comment at the bottom of the page in the March 6, 2020 post of Dr. Smith’s ECG Blog.
Some Final Thoughts on Today’s Case:
It is not at all surprising that the reentry SVT rhythm in today’s case recurred shortly after IV Adenosine (ie, the half-life of IV Adenosine is less than 10 seconds!). As a result — it should be expected that a longer-acting agent may need to be added to maintain sinus rhythm (as was done with Diltiazem in today’s case). Among considerations that arise following hospital discharge of today’s patient are the following:
- Awareness that in a younger adult without underlying heart disease (ie, unremarkable Echo) — a reentry SVT is a non-life-threatening and usually fairly benign rhythm disturbance. As a result — the main indication for treatment is to control symptoms. How best to do this depends on answers to the series of questions in the History that I suggested above (under Some General Thoughts on SVTs).
- There is no need to immediately refer today’s patient to EP for ablation. Although treatment of reentry SVTs by ablation is highly effective, with an excellent safety record when done in a center with quality results — there remains potential for a small-but-real incidence of complications with this procedure. Patients should be offered a choice for a trial of medication vs ablation for this non-life-threatening arrhythmia. Clearly, EP ablation becomes indicated in patients with frequent refractory SVT recurrences — but not necessarily before.
- The “best” treatment of recurrent reentry SVT is to find and fix a precipitating cause, when one is present. I’ve had pregnant patients who only got their reentry SVTs during their pregnancy. I’ve had other patients who would have frequent SVT recurrences during periods of intense stress/anxiety — with their reentry SVT episodes controlled when these precipitants were controlled. Excess caffeine or OTC sympathomimetics are other potential precipitants that may be easily controlled once identified.
- Commonly used medications to suppress recurrent reentry SVT episodes include Diltiazem, Verapamil or a ß-Blocker. These medications do not necessarily need to be used continually on an indefinite basis. Life circumstances change. My patient with stress-induced SVT did well for months at a time when her stress was controlled. She stopped her daily Diltiazem during lower-stress periods — and then resumed daily Diltiazem when life stressors resurged.
- For patients with infrequent recurrences that are easily controlled with AV nodal blocking agents — use of “prn medication” (ie, with permission for home use by the patient of a dose of Diltiazem, Verapamil, or a ß-Blocker) at the time of a recurrence, and then going into a quiet room — may resolve the SVT within 30-120 minutes, thereby avoiding an ED visit.
- BOTTOM Line: Longterm management of the patient with a reentry SVT should be individualized for the life circumstances of the patient at hand.


-USE%20copy.png)


-USE.png)