Thursday, March 31, 2022

Chest pain + troponin of 1600 + LBBB + 6mm ST elevation = occlusion MI, right?

This case is by Jesse McLaren (@ECGCases), with comments by Smith and Grauer


A 50 year-old with CAD and ESRD went to their regular hemodialysis appointment complaining of two days of exertional chest pain. The patient was sent to the ED when high-sensitivity Troponin I returned at 1,526 ng/L (normal <26 in males, <16 in females). They were painfree on arrival, with BP 180/70 and other vitals normal. What do you think?


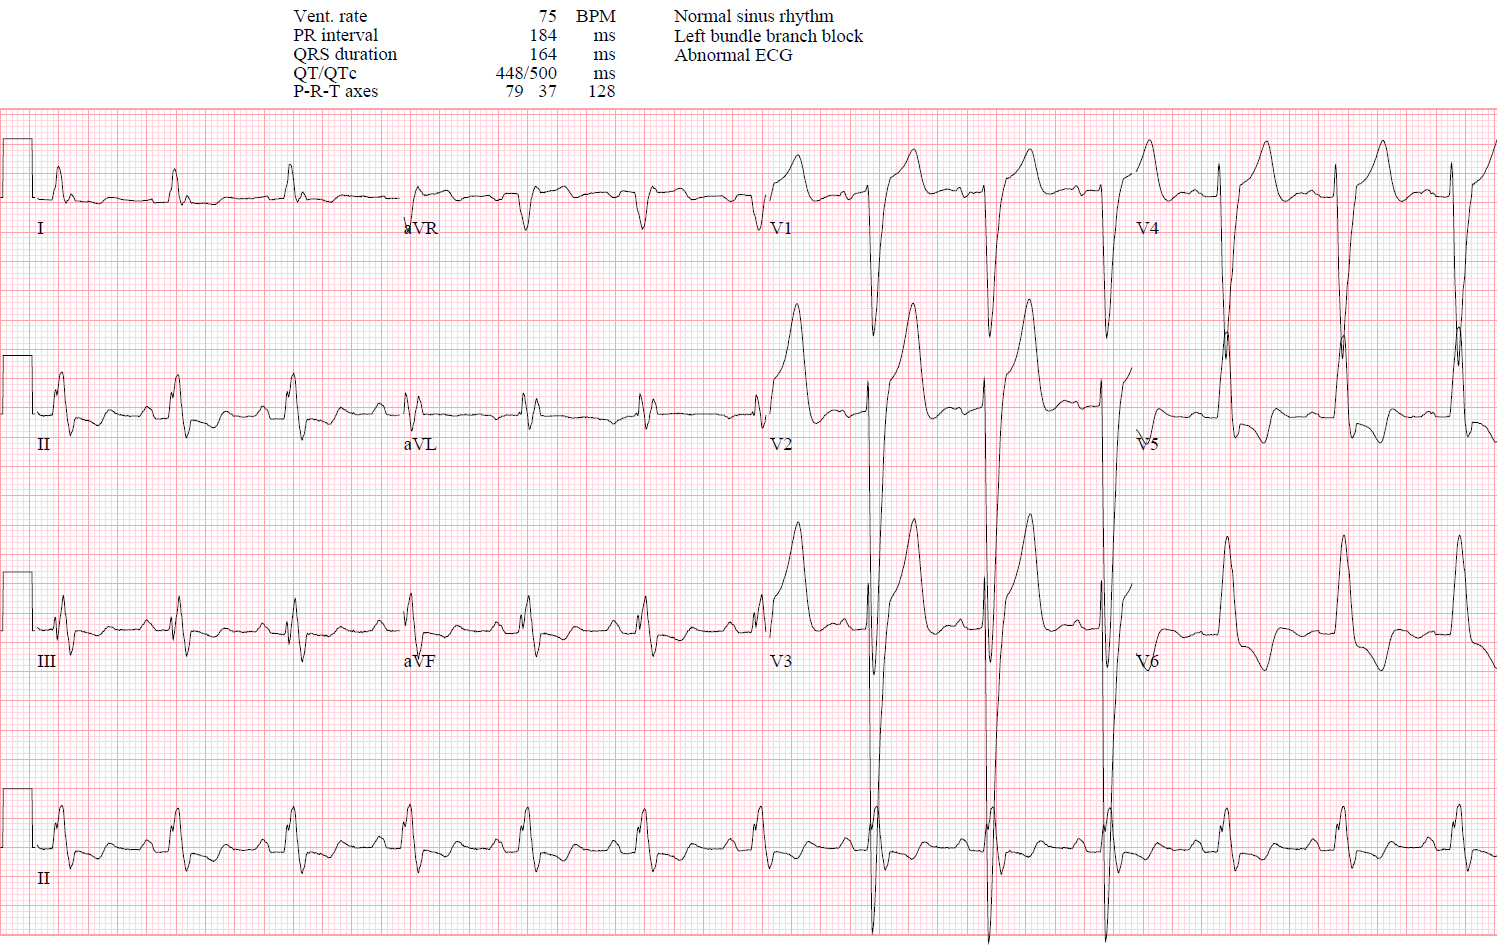
There’s sinus rhythm with LBBB and appropriate discordant ST changes: there’s no concordant ST elevation, no concordant ST depression in V1-3, and no excessive discordance.


Because of the chest pain and positive troponin the patient had a stat cardiology consult in the ED, which noted that the ECG revealed “known LBBB now with >5mm discordant ST elevation V2-3, positive by Sgarbossa criteria”. The cath lab was activated, and a 70% circumflex lesion was stented. The troponin in the ED three hours after the initial troponin was 1509, and continued to fall. The patient had chest pain + ST elevation + elevated troponin + culprit lesion, so was discharged with a diagnosis of “STEMI”. But did they have an Occlusion MI?


Acute coronary occlusion is diagnosed based on clinical presentation (ischemic symptoms), ECG evolution (occlusion and reperfusion), angiographic findings (TIMI 0-2 flow), and significant troponin elevation. But no factor alone is sufficient: patients can have resolved symptoms but ongoing ECG evidence of occlusion, or refractory ischemia with electrocardiographically silent occlusion, or an open artery by the time of the angiogram with a massive troponin from prior occlusion, or a small troponin elevation after rapid reperfusion with ECG signs of occlusion/reperfusion.


Clinical: if the patient presented with refractory ischemia or hemodynamic instability they would have required urgent angiography regardless of ECG findings. But they were pain free and hemodynamically stable.


ECG: they were noted to have a known LBBB. But whether the LBBB is new or old is not relevant, as “ED patients with new or presumed new LBBB are not at increased risk of AMI.”[1]. They were also noted to meet Sgarbossa criteria with >5mm of discordant ST elevation. But the original Sgarbossa criteria applied to any AMI as diagnosed by CK-MB, not occlusion MI diagnosed by angiography and troponin—and even this definition required a score of 3 whereas discordant STE >5mm only gave a score of 2. [2] Unweighted application of the Sgarbossa criteria results in lower specificity, but the Smith-modified Sgarbossa criteria are both sensitive and specific. It defines excessive discordance relative to the QRS (STE/S>25%), and is based on OMI defined by angiography and troponin level.[3] In the validation study, STE/S>25% had a positive likelihood ratio of 99.6, and negative likelihood ration of 0.20; using STE/S>20% still had a positive likelihood ratio of 15, which can be helpful in high pretest likelihood patients, while the negative likelihood ratio was 0.16.[4]


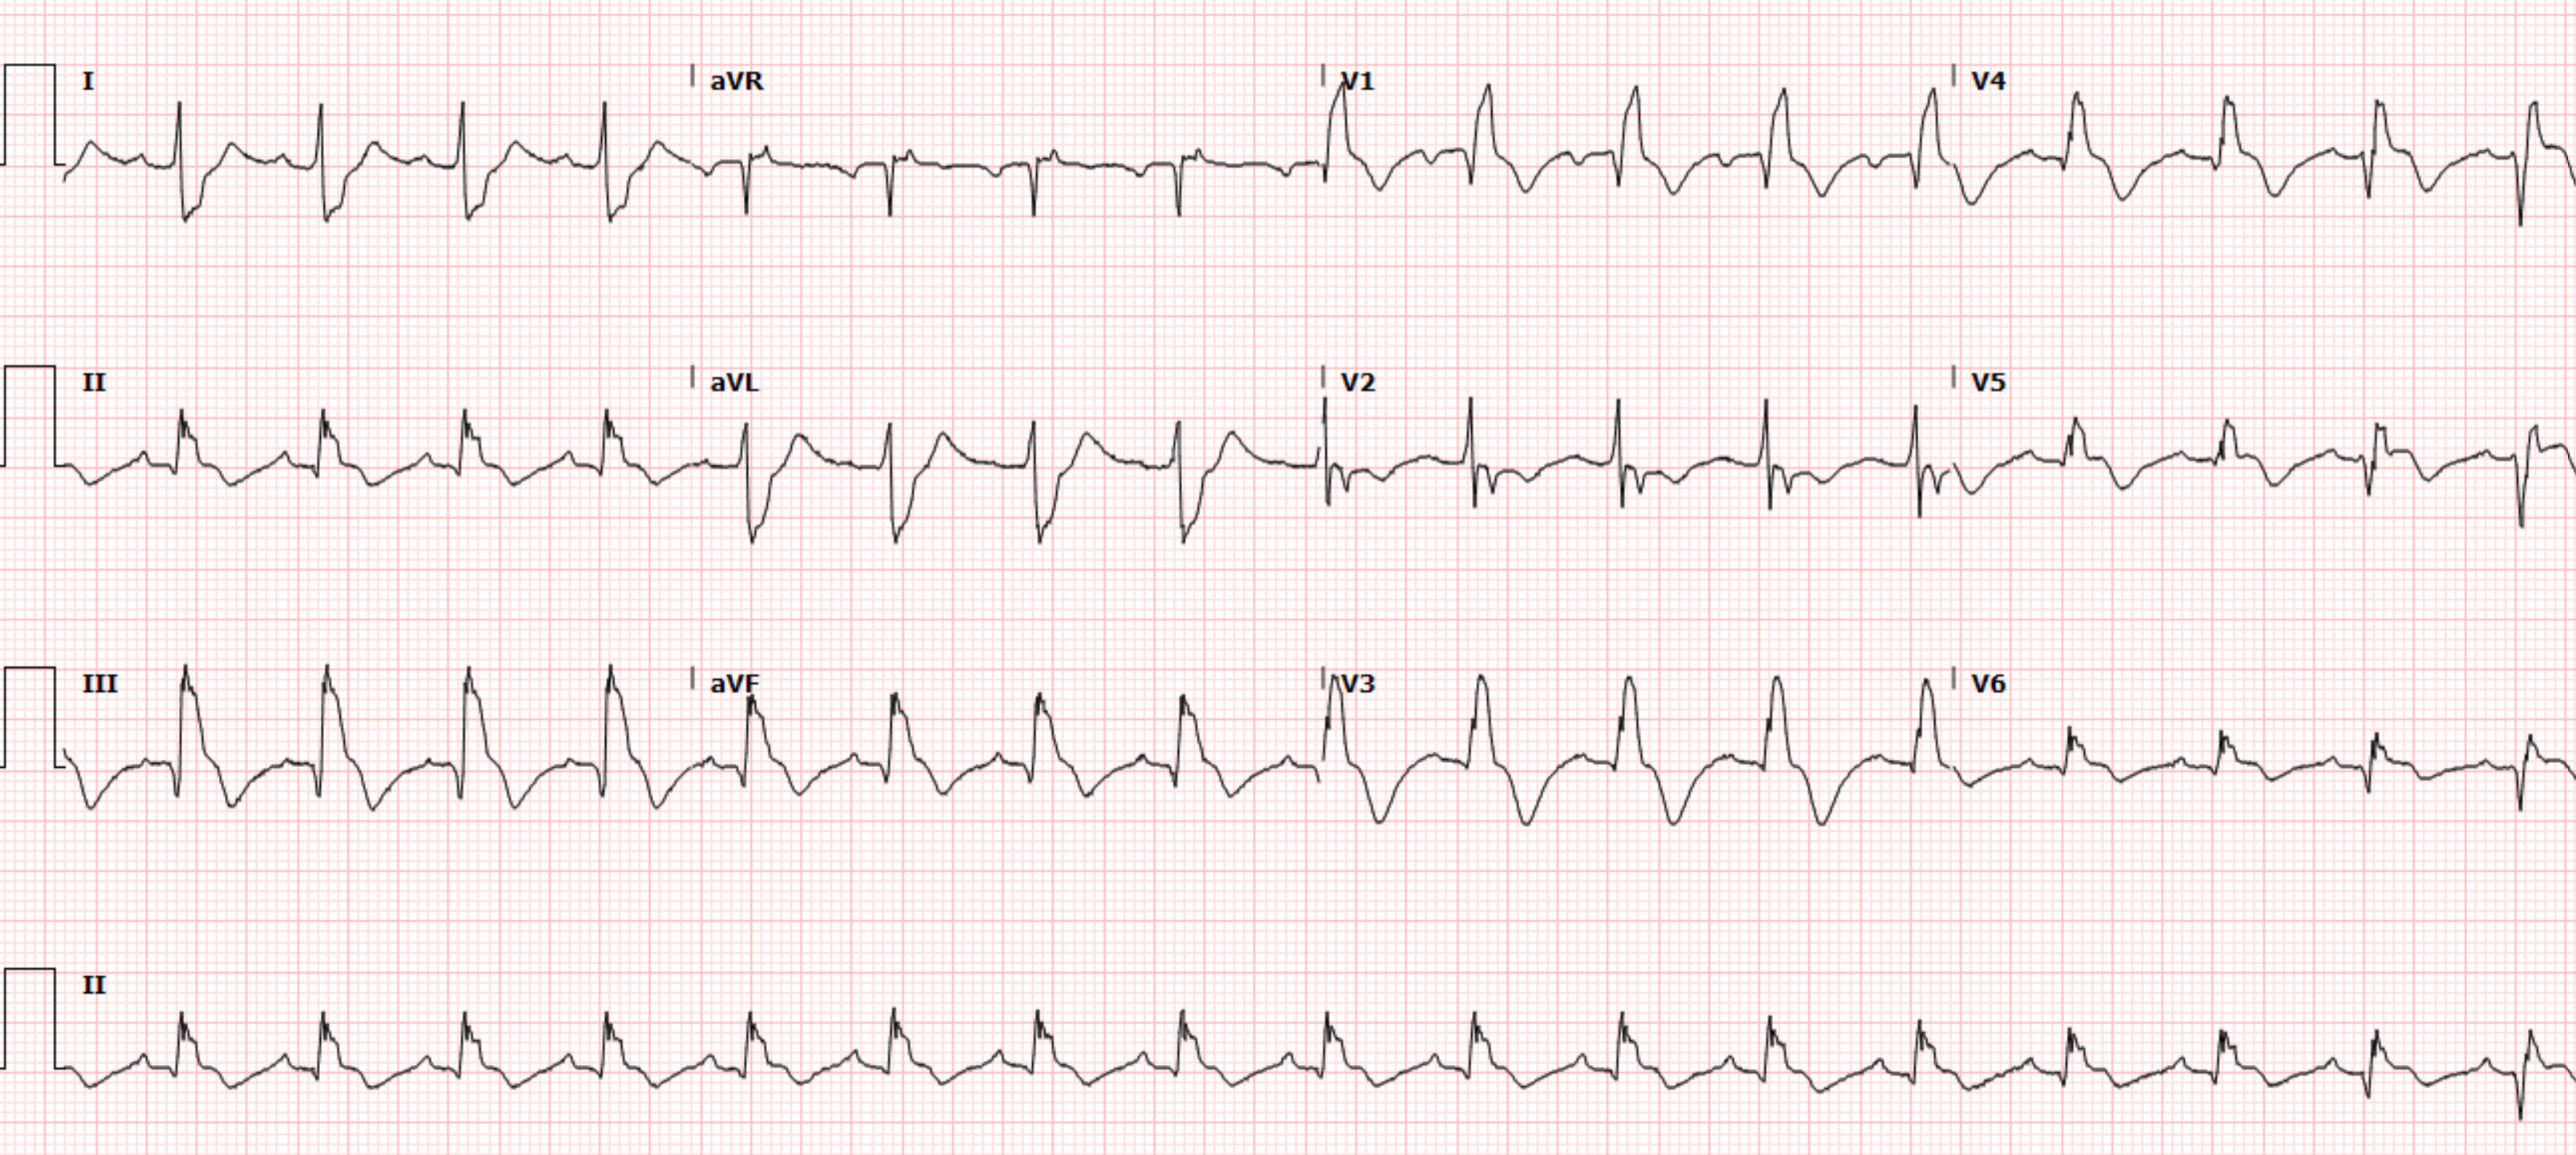
Below are the old, new, and discharge ECGs of the patient above. 


In the ECG on presentation the STE was >5mm but this was proportational to massive S waves: ST/S in V2 = 6/43 =14%; and in V3 = 6/53 = 11%, both well below the 20% cutoff even if high pre-test likelihood. Not only was there no sign of occlusion on the initial ECG, but there was no subsequent evolution of occlusion/reperfusion on follow up ECGs.


Angiogram: there was a hazy 70% circumflex lesion which was stented, along with a 60% LAD stenosis and 40% RCA stenosis. This confirms that the concerns for anterior ST elevation were unwarranted. The patient had the cath lab activated for anterior ST elevation but there was no LAD occlusion. Circumflex occlusions can be electrocardiographically silent, but if they manifest on ECG will produce concordant ST depression (from posterior MI), or concordant ST elevation (from lateral MI), neither of which were present on ECG. A 70% culprit lesion could still be compatible with an OMI that has reperfused by the time of the angiogram, but there was no ECG evolution to suggest this and no significant troponin elevation (e.g. >10,000 ng/L).


Troponin: in OMI the initial troponin can be normal but can soar into the tens of thousands (ng/L for high sensitivity assay). A rapidly reperfused OMI can have a lower peak troponin. But this patient's mildly elevated troponin was already starting to fall by the time they arrived in the ED, which correlates with their resolved symptoms and lack of ECG changes.


In summary, this patient was diagnosed as "STEMI" because of chest pain + ST elevation + troponin + culprit lesion. But the pain had resolved, the ST elevation was proportional, the artery was open and the troponin elevation was mild. This "STEMI" was a NOMI. The patient was taken for urgent cath based on false positive Sgarbossa criteria and elevated troponin level, and diagnosed with “STEMI” based on a culprit lesion that was stented. But they did not have clinical or ECG evidence of an acute coronary occlusion on presentation; and the ECG evolution, angiographic findings and peak troponin confirmed the diagnosis of NOMI.


Contrast with this case, where a patient had clinical and ECG evidence of OMI—with refractory ischemia and positive Modified Sgarbossa Criteria—but did not initially meet traditional Sgarbossa criteria and died after delayed cath lab activation. This shows that the OMI paradigm can optimize cath lab decisions to target those with occluded arteries in need of emergent reperfusion, and differentiate them from those with non-occlusive MI.


Take home:

1.     OMI is based on clinical factors, timing of symptoms with ECG findings, ECG evolution, angiographic findings, and troponin levels

2.     Patients with LBBB don't need the cath lab for ‘new’ LBBB or discordant STE >5mm if this is proportional to the preceding QRS

3.     Patients with LBBB do need the cath lab for refractory ischemia or hemodynamic instability, Smith-modified Sgarbossa (concordant STE, concordant STD in V1-3, or excessively discordant STE defined as STE/S>25% or >20% in high-pretest probability patients

4.     Type 1 MIs should be categorized as OMI vs NOMI not STEMI/NSTEMI in order to optimize reperfusion decisions


References

1.     Chang et al. Lack of association between left bundle-branch block and acute myocardial infarction in symptomatic ED patients. Am J Emerg Med 2009

2.     Sgarbossa et al. Electrocardiographic diagnosis of evolving acute myocardial infarction in the presence of left bundle branch block. NEJM 1996

3.     Smith et al. Diagnosis of ST-elevation myocardial infarction in the presence of left bundle branch block with the ST-elevation to S-wave ratio in a modified Sgarbossa rule. Ann Emerg Med 2012

4.     Meyers et al. Validation of the modified Sgarbossa criteria for acute coronary occlusion in the setting of left bundle branch block: a retrospective case-control study. Am Heart J 2015


================================

One last comment by Smith about Jesse's case, the Smith Modified Sgarbossa Criteria, and about Ken's comment below: 


The diagnosis of OMI, even in LBBB, goes way beyond ST Elevation, and that means that it goes way beyond just measuring the ST/S ratio, or concordance, in LBBB.  In Ken's case below, he gives an example of lead aVF being diagnostic due to the hyperacute T-wave, and also a hyperacute T-wave in V6.  But in that ECG, the case is POSITIVE by the Smith modified criteria: the ST/S ratio in aVF is 1/4 or 1/3.5, either of which are ≳ 0.25 and definitely greater that 0.20.  It only takes one lead to be above the given ratio!  


When I try to get into nuance of the ST/S ratio on the criteria, I tell people that our data shows that the highest NORMAL ST/S ratio among the 12 leads is, on average, 0.11.  And I say I get worried about any value above 0.15 and that 0.20 is VERY specific for Occlusion, and even more sensitive than 0.25.


We found that the Smith Modified criteria are far better at diagnosing OMI in LBBB than ST Elevation criteria are at diagnosing OMI in normal conduction (which to most who know the history of LBBB should be shocking), and this is because the latter do not take proportionality into account.


See this amazing case: 

A Fascinating Demonstration of ST/S Ratio in LBBB and Resolving LAD Ischemia


===================================

MY Comment by KEN GRAUER, MD (3/31/2022):

===================================

Excellent presentation by Dr. Jesse McLaren — which illustrates "the art of electrocardiography" in assessing the patient with chest pain and underlying LBBB. As emphasized by Dr. McLaren — determining whether or not acute OMI has occurred in such a patient consists of much more than simply "the sum of its parts".

  • I first learned to appreciate qualitative aspects for assessing the acuity of ST-T wave changes with LBBB in the 1980s from my mentor, Dr. Barney Marriott. Dr. Marriott showed us numerous examples of LBBB tracings with primary ST-T wave changes more than what should be expected with simple LBBB. Although some examples were subtle — others were obvious — yet generally ignored by the cardiology community.
  • I remember waiting for years in the hope that some literature would be forthcoming to justify recognition of acute MI in association with LBBB. Finally, a decade later (in 1996) — Sgarbossa et al published their NEJM article with his now well-known and frequently cited critieria (NEJM 334:481-487, 1996).
  • As helpful as the original Sgarbossa criteria were for recognition of acute coronary occlusion — these criteria failed to incorporate the concept of proportionality. For this, we are indebted to Dr. Smith for developing Modified Smith-Sgarbossa Criteria — for which, instead of using an absolute measurement of 5 millimeters of ST elevation as the criterion for "abnormal" — a ratio of the amount of J-point ST segment elevation compared to S wave depth was used. The beauty of this addition to the original Sgarbossa criteria — is that it facilitates assessment of LBBB tracings with extremely deep anterior S waves.

Today's initial ECG provides a superb example for applying Modified Smith-Sgarbossa Criteria. To facilitate identifying the measurements cited above by Dr. McLaren — I've colored in the huge, overlapping QRS complexes in leads V2 and V3, and have added arrows to indicate the location of J-point ST elevation (TOP tracing in Figure-1).
  • As per Dr. McLaren — the ratios of 6/43 (14%) and 6/53 (11%) respectively, allow instant dismissal of the amount of anterior J-point ST elevation as not at all suggestive of acute coronary occlusion.

Figure-1: TOP — I've labeled the 1st ECG shown by Jesse McLaren in today's case. BOTTOM — I've reproduced the initial ECG shown in the September 17, 2020 post in Dr. Smith's ECG Blog (See text).


As helpful as the Modified Smith-Sgarbossa Criteria are in assessing LBBB tracings in patients with chest pain — I favor in addition, a qualitative approach that is based on ST-T wave appearance rather than measurements. I fully acknowledge that this approach is experiential. Combining it with the concept of proportionality inherent in Modified Smith-Sgarbossa Criteria has worked well for me over the years.
  • PEARL: As helpful as Smith-Sgarbossa Criteria can be — I like to look for ST-T wave changes that I know are not normal in a patient with LBBB. To illustrate this concept — I've reproduced the initial ECG in the September 17, 2020 post in Dr. Smith's Blog (BOTTOM tracing in Figure-1). The patient complained of new chest pain. The ECG showed sinus rhythm with LBBB. 
  • I've enclosed within dotted RED rectangles QRST complexes in the 2 leads that most caught my eye. Fully aware that assessment of ST-T wave changes is often extremely challenging with LBBB — there is no way that the J-point notch, with straightened ST segment takeoff and disproportionately "fattened" T wave peak in lead aVF is normal. In view of the tiny QRS amplitude in this lead — the ST-T wave in lead aVF is clearly hyperacute!
  • The other QRST complex in ECG #2 that is clearly not "normal" for LBBB — is in lead V6. With typical LBBB — the ST-T wave should be oppositely-directed to the last QRS deflection in lateral leads I and V6. The T wave should not normally be upright in lateral lead V6 when the last QRS deflection is positive (as it is in ECG #2).

  • Knowing that there are hyperacute T waves in leads aVF and V6 in this LBBB patient with new chest pain facilitates recognition of other less obvious but clearly abnormal ST-T wave findings in neighboring leads. As per the RED arrows that I've added to ECG #2 — the other 2 inferior leads also show abnormalities (ie, more-than-expected J-point ST elevation in lead III — and a T wave in lead II that is unexpectedly positive and looks hyperacute). Although in isolation, I might not be impressed by the J-point ST depression in high lateral leads I and aVL — in the context of new chest pain and hyperacute inferior T waves — I interpreted this J-point depression in leads I and aVL as consistent with reciprocal ST depression.
  • Similarly, by the concept of neighboring leads — the hyperacute T wave in lead V6 is flanked by more-voluminous-than-they-should-be T waves in leads V4 and V5 — which makes for 3 consecutive leads showing hyperacute T waves in the lateral chest leads.
  • BOTTOM LINE: In this patient with new chest pain and LBBB — no less than 8/12 leads in ECG #2 show ST-T wave abnormalities that suggest acute OMI. Cardiac cath confirmed 100% occlusion of the RCA, which was stented.

  • NOTE: For those interested in a user-friendly approach to the ECG diagnosis of the Bundle Branch Blocks (including a 13-minute ECG Video and PDF download) — Please check out ECG Blog #282
  • Additional posts in Dr. Smith's Blog, in which I've commented on qualitative aspects of LBBB tracings include — the April 7, 2019 post — the December 16, 2019 post — 


Return for a moment to ECG #1 — in which I colored in the huge QRS amplitude in lead V2 and V3. When I first saw this ECG, after determining that Modified Smith-Sgarbossa Criteria were not satisfied — I looked for qualitative features in this LBBB tracing.
  • I thought the downsloping ST segments with biphasic terminal T waves in each of the inferior leads looked unusual — but nonspecific. From this single tracing — I couldn't tell if this was a new or old finding.
  • The 1 lead in ECG #1 that most caught my eye was lead V5. As per the RED arrow in this lead — there is J-point ST depression with ST segment coving and T wave inversion. On the one hand — I thought this potentially could represent an acute finding. On the other hand (as suggested by enclosure within the dotted BLUE rectangle) — this might simply be a "transitional lead" finding — as ST-T wave morphology in lead V5 appeared to be intermediate between the very large, upright ST-T wave in lead V4 — and the deep ST-T depression in lead V6.
  • BOTTOM LINE: I was uncertain if the ST-T wave in lead V5 did or did not represent an acute finding. That said — I saw no acute ST elevation in ECG #1, so there was no indication of an acute OMI on ECG. Subsequent astute analysis by Dr. McLaren made it apparent that the infarct in today's case was a NOMI, and not the result of acute coronary occlusion.

======================

Final PEARL: Assessment for LVH is clearly more difficult in the presence of LBBB. Since LBBB changes the sequence of ventricular depolarization — the usual voltage criteria for LVH diagnosis do not pertain. In addition, the sequence of ventricular repolarization is also changed. As a result — asymmetric (slower downslope; more rapid upslope) ST segment depression is an expected finding with LBBB that cannot be assumed due to LV “strain” or ischemia.
  • Virtually all patients with complete LBBB have some form of underlying heart disease. As a result — statistically, patients with LBBB make up a high-prevalence population for LVH.
  • The presence of very deep S waves (ie, >25-30mmin one or more anterior leads (ie, V1, V2 and/or V3is highly correlated with LVH in patients with LBBB. LVH was almost certainly present in the TOP tracing in Figure-1.


Monday, March 28, 2022

A woman in her 50s with shortness of breath

 Case written by Neha Ray, MD, with edits by Meyers, Smith, Grauer


A woman in her 50s presented for evaluation of multiple episodes of syncope with shortness of breath. On EMS arrival, she was GCS 15 with HR 110s. En route to the ED, the patient had 4 more episodes of syncope and became hemodynamically unstable with SBP in the 80s and HR 160s. The first recorded SpO2 was 73%. On arrival to the ED, patient was diaphoretic and in extremis. Her initial EKG is below. Paramedics arrive to the ED and state that they are worried about inferior STEMI. 

What do you see? 

What do you think?


The ECG shows sinus tachycardia with prominent T-wave inversions in the inferior and anterior leads. The patient also has right axis deviation, and an S1Q3T3 pattern. There is a hint of inappropriate STE in III, with reciprocal STD in I and aVL.  

It would be easy to mistake this ECG for inferior OMI (STE in III with reciprocal STD in aVL). But several features give it away as a mimic of OMI and instead all but diagnostic of right heart strain.  Most important is tachycardia, which should always make you doubt the diagnosis of OMI.  When there is tachycardia, there is either OMI with cardiogenic shock (which should have poor LV function on echo or valvular dysfunction) or there is another etiology. T-waves: 1) when inverted in both anterior and inferior leads, PE is far more likely than ACS. 2) Domed T-wave inversion 3) T-wave inversion during pain, in contrast to post-pain, as seen in reperfusion and Wellens syndrome.


While no prior was available, the providers correctly identified findings consistent with acute right heart strain. A beside TTE was performed, see images below.

The TTE shows a dilated right ventricle with D-sign on the parasternal short view. On the apical 4 view, you can see septal bowing and McConnell’s sign (right ventricular free wall akinesis with apical sparing). The IVC also appeared plethoric concerning for elevated right atrial pressure. While RV dilation with D-sign and elevated RAP can occur in both acute and chronic right heart strain, McConnell’s sign is more specific for acute pulmonary embolism (though data is conflicting). The providers performed a lower extremity US showing a left popliteal vein DVT, further confirming the diagnosis of acute massive PE. The patient was given an initial 10 mg bolus of alteplase.

Shortly after this, and 15 minutes after the initial ECG, the patient develops agonal breathing and has a PEA arrest. Patient is administered and additional 40 mg of alteplase and ROSC is obtained. The patient was placed on an epinephrine drip and intubated. Her repeat ECG post-ROSC is shown here:


This ECG shows continued sinus tachycardia, persistent T-wave inversions in the inferior and anterior leads with an S1Q3T3 pattern. However, the patient has also developed a new complete right bundle branch block, thought to be predictive of more severe pulmonary hypertension. There is also concordant STE in III and aVF, with reciprocal STD in I and aVL. This is likely due to an element of type 2 STEMI or type 2 OMI pattern which can occur when massively increased demand outstrips very low supply to the point that the supply/demand mismatch effectively resembles the same physiologic state as OMI, with transmural injury.

The patient has another brief arrest during which she received an additional 50 mg of alteplase, but is ultimately is taken to CT scanner which demonstrates pulmonary emboli in the main pulmonary arteries bilaterally with elevated RV/LV ratio. 


She is admitted to the ICU and undergoes pulmonary artery aspiration thrombectomy. After a prolonged hospital stay, she is ultimately able to be discharged home with intact neurologic function.

First troponin I on arrival was 91 ng/L (upper reference limit for women 12ng/L for this assay). No further troponins were ordered.


Two days later:


Two months later:


See more cases of PE:


A crashing patient with an abnormal ECG that you must recognize


Chest pain, ST Elevation, and tachycardia in a 40-something woman


Learning Points:

Pulmonary embolism is overall rare in patient’s presenting with syncope, with an estimated prevalence <1%. However, syncope in the setting of PE has been shown to have higher 30-day mortality compared to patient with PE without syncope. In this patient, quick identification of abnormal ECG and bedside US findings allowed for a life-saving resuscitation.

You must learn this acute right heart strain pattern if you want to save these lives.

Type 2 STEMI or OMI patterns occur in situations with severely mismatched regional supply and demand. The affected myocardium experiences the same transmural injury regardless of the etiology.


References:

1.       Mcconnell MV, Solomon SD, Rayan ME, Come PC, Goldhaber SZ, Lee RT. Regional right ventricular dysfunction detected by echocardiography in acute pulmonary embolism. Am J Cardiol. 1996;78(4):469-73.

2.     Avila J. Is McConnell’s sign useful for APE? 5 minute sono - 5 Minute Sono Blog. https://blog.5minsono.com/mcconnells-sign/. Accessed March 2, 2022.

3.       Petrov DB. Appearance of right bundle branch block in electrocardiograms of patients with pulmonary embolism as a marker for obstruction of the main pulmonary trunk. J Electrocardiol. 2001 Jul;34(3):185-8. doi: 10.1054/jelc.2001.25132. PMID: 11455507.

4.       Prandoni P, Lensing AW, Prins MH, et al. Prevalence of Pulmonary Embolism among Patients Hospitalized for Syncope. N Engl J Med. 2016;375(16):1524-1531. PMID: 27797317

5.       Roncon L et al. Impact of Syncope and Pre-Syncope on Short-Term Mortality in Patients with Acute Pulmonary Embolism. Eur J Intern Med 2018; 54: 27-33. PMID: 29655808


===================================

MY Comment, by KEN GRAUER, MD (3/28/2022):

===================================

Over the years, I have found acute RV (Right Ventricular) “Strain” to be among the most challenging of ECG patterns to recognize. The reasons for this are simple: i) True acute RV “strain” is not a common diagnosis; andii) There is no one single ECG finding that is diagnostic. Instead — it is a combination of ECG findings that are seen in association with a suggestive clinical history that is needed for the ECG diagnosis of acute RV “strain”, with or without RVH (Right Ventricular Hypertrophy).

Today’s case was typical of the challenges posed by this clinical diagnosis. Despite an absence of chest pain in the history of this acutely ill woman (who presented with multiple episodes of syncope and shortness of breath) — her initial ECG was misinterpreted by the EMS team as most suggestive of acute inferior MI because of the following ECG findings:

  • Q waves, ST elevation and T wave inversion in leads III and aVF.
  • ST depression in leads I and aVL.
  • Chest lead T wave inversion.

I focus my comments regarding today’s case on highlighting some additional points to enhance the excellent presentation by Drs. Ray and Meyers. For clarity — I’ve reproduced the first 2 ECGs in this case, which I’ve put together in Figure-1.


Figure-1: The first 2 ECGs in today’s case (See text).


MY Initial Thoughts on Today’s Case:
It’s easy to understand how the EMS team might have thought this acutely ill patient was having an acute infarction. That said — there are a series important clues that taken together, should immediately prompt emergency providers to consider a large acute PE (Pulmonary Embolus) as the diagnosis until proven otherwise.

  • Fortunately, ED (Emergency Department) providers quickly recognized the correct diagnosis — and promptly initiated appropriate therapy. Despite this — the patient experienced a PEA arrest. As per Drs. Ray and Meyers — the patient was successfully resuscitated.


Clues to the Diagnosis of Acute PE:
The 1st big CLUE to the correct diagnosis in today’s case is the History. This patient did not present with chest pain. Instead, this woman in her 50s had multiple episodes of syncope associated with shortness of breath.

  • In the context of this clinical history — the initial ECG should strongly suggest the diagnosis of a large acute PE until you prove otherwise. In my experience — syncope caused by acute PE is a potentially ominous sign — especially given the multiple recurrences of this symptom in today’s case.
  • As emphasized by Drs. Ray and Meyers — prompt ordering of Stat Echo at the bedside allowed confirmation of acute massive PE within the space of a few minutes! The value of Stat Echo in the ED for confirming our clinical and ECG suspicion of acute PE cannot be overstated!


What is it about ECG #1 that Suggests a Large Acute PE?

We have presented numerous cases of acute PE in multipe posts in Dr. Smith’s ECG Blog. I’ve previously reviewed specific ECG findings to look for (See My Comment at the bottom of the page in the September 1, 2020 post — and, in the March 6, 2022 postamong others). As emphasized in my introduction — there is no single ECG finding that is diagnostic of acute PE. That said — the combination of multiple abnormal findings in ECG #1 should immediately suggest acute RV “strain”. These ECG findings (which I have summarized in Figure-2 belowinclude:

  • Sinus Tachycardia: While not absolutely essential for the diagnosis, a rapid heart rate (usually to at least 90/minute) is a common and expected finding in patients with hemodynamically significant acute PE. The heart rate in today’s case is extremely rapid! (ie, at ~135/minute in ECG #1).

  • S1Q3T3: In my experience, it is rare (if ever) that the isolated finding of an S1Q3T3 pattern will make the diagnosis of a new significant PE. That said, this ECG sign may be extremely helpful IF seen in association with other ECG evidence of acute PE. Such is the case in today’s tracing.

  • Acute RV “Strain”: Awareness of ECG evidence of RV (Right Ventricular) "Strain" is one of the most important ECG indicators of acute hemodynamically significant PE. Unfortunately, this sign remains all-to-often unappreciated and misinterpreted as coronary ischemia. RV “strain” manifests as ST depression and/or T wave inversion that typically occurs in anterior leads (V1,2,3) — and/or — in inferior leads (II,III,aVF). Abnormal ST-T wave changes consistent with this finding are seen in both of these lead areas in ECG #1.
  • NOTE #1: There is something about lead V2 in ECG #1 that is “off”. The much larger QRS amplitude and different morphology seen in lead V2 (compared to QRS morphology in neighboring leads) just does not make physiologic sense. The lack of the symmetric T wave inversion in lead V2 is also incongruous with the picture we see in other chest leads (ie, T wave inversion begins in lead V1 — and becomes quite marked in leads V3, V4, V5). Precordial lead electrode placement should be verified on future ECGs.
  • NOTE #2: The “shape” of the coved ST segments that lead into deep symmetric T wave inversion with an associated prolonged QTc interval in both inferior and chest leads presents a picture that “looks” more typical in morphology of RV “strain” than of acute MI from coronary occlusion.

  • RAA (Right Atrial Abnormality): RAA is another ECG indicator of acute right heart strain. RAA is most often diagnosed by the finding of a tall, peaked and pointed P wave (≥2.5 mm) seen in one or more of the inferior leads. Less commonly — RAA may be suggested by the finding of a pointed upright P wave in lead V1 and/or V2. Even though amplitude of the P wave seen in lead II may not quite attain a height of 2.5 mm — the multiple P waves seen in the artifact-laden long lead II are definitely “pointed” — to in my opinion, diagnostic of RAA. Given that the only condition in medicine known to enlarge the RA without also enlarging the RV is tricuspid stenosis — recognition of RAA in today’s tracing carries important diagnostic value.

  • The Abnormal Frontal Plane Axis: Reference is often made to RAD (Right Axis Deviation) as a sign of acute PE. But in addition to RAD — an indeterminate frontal plane axis carries similar diagnostic value. RAD is not present in ECG #1 — because the QRS complex is not predominantly negative in lead I. Instead — the QRS complex is nearly isoelectric in each of the 6 limb leads — which defines the frontal plane axis as indeterminate, adding further support to the diagnosis of acute RV "strain".
  • Poor R wave Progression: Note persistence of sizeable S waves across the precordium (ie, the finding of fairly deep S waves in leads V5 and V6 suggests significant forces away from these left-sided leads — which in this tracing means there is probably an increase in right-sided forces).
  • Among the unappreciated benefits of lead aVR in ECG interpretation, is awareness that acute right heart “strain” (as seen with large acute PE) may often produce ST elevation in right-sided lead aVR. Although subtle — there is ST elevation in lead aVR in ECG #1. A similar pattern of ST elevation may also be seen in right-sided lead III.


KEY Point: Awareness of the constellation of ECG findings shown in Figure-2 (many of which are present in subtle or less-subtle form in ECG #1) — is why within seconds of hearing the history in today’s case, we should immediately suspect massive acute PE as the cause.


Figure-2: ECG findings associated of acute PE. There is no single ECG finding that is diagnostic of acute PE. Instead, the diagnosis may be suggested by the presence of at least several of these ECG findings when they occur in the “right” clinical setting (See text).


-----------------------------------------------------------
NOTE: The ECG is far less likely to help in the diagnosis of relatively small (ie, subsegmental) PEs that are not hemodynamically significant, and which are often only discovered on Chest CT performed on patients with less convincing symptoms. This is probably a “good thing” — since evidence is lacking that treatment of incidentally discovered, non-hemodynamically significant subsegmental PEs is beneficial (and it certainly is not without potential for harm). Perhaps it is a “benefit-in-disguise” that the ECG is unlikely assist in detection of relatively smaller pulmonary emboli.
-----------------------------------------------------------


MY Thoughts about the Post-Resuscitation ECG #2:
Drs. Ray and Meyers expand on the likelihood of a Type 2 STEMI (due to severely mismatched supply-demand) as the reason for the findings we see with ECG #2 (as shown in Figure-1 above).

  • It should be noted that we were already seeing the beginning of these changes in the limb leads of ECG #1 (ie, Q waves, ST elevation and T wave inversion in leads III, aVF — with mirror-image ST depression in leads I and aVL).
  • Otherwise, as mentioned above — there is now complete RBBB (Right Bundle Branch Block).
  • Once again — something about lead V2 doesn’t “fit”, because of how different QRST morphology in lead V2 of ECG #2 looks compared to QRST appearance in each of the other 5 chest leads. Since ECG #2 was also obtained in the ED, not long after ECG #1 — I suspect the same person may have recorded both of these initial 2 ECGs (potentially committing the same lead V2 electrode placement error).

  • Confession: If I would have been shown ECG #2 alone, without information about the clinical history — I would probably have diagnosed acute or recent STEMI, possibly in the reperfusion T wave stage. After all, there are inferior lead Q waves plus small-but-real q waves in multiple chest leads. And in each of these leads with Q waves — there remains some ST elevation with surprisingly deep T wave inversion well beyond that expected from the RBBB.

  • KEY Point: More than just development of RBBB on this post-ROSC tracing — is the QR morphology in lead V1. In patients with mitral stenosis from rheumatic heart disease — this ECG finding is highly predictive of markedly elevated pulmonary pressure. There is a physiologic reason why pulmonary hypertension from advanced mitral stenosis commonly results in a qR pattern in lead V1 (Figure-3). Given the "D-shaped" deformity on Echo in today's case — I think it highly likely that the same physiology applies in this patient with massive acute PE and associated pulmonary hypertension.


Figure-3: With permission, I've adapted Figure-2 from a slide sent to me by Dr. Balasubramanian (from Pondicherry, India). 

 LEFT: The circular configuration of the normal left ventricle in this short-axis view — with corresponding rS morphology in lead V1 (WHITE arrow illustrating septal depolarization that is initially oriented toward lead V1)

— RIGHT: Increased RV pressure (with associated RV dilatation) is transmitted to the interventricular septum, and produces a "D-shaped" deformity of the LV (as seen here, in this short-axis view). Flattening of the septum in this manner alters the direction of initial septal activation, that is now oriented away from lead V1 (WHITE arrow), thereby producing the qR pattern in lead V1 that is seen with RVH + pulmonary hypertension. 


Saturday, March 26, 2022

Is there evidence of OMI on this ECG?

This is another one from Amandeep ("Deep") Singh, with many comments by Smith.  

Dept Emergency Medicine, Highland Hospital, Oakland.

Case

67yo male with h/o schizophrenia and who has become increasingly distrustful of Western medicine presents with chest pain radiating to the right shoulder associated with shortness of breath for 24 hours duration.  He states that he was unable to sleep secondary to the pain.  The patient seems very worried about his right shoulder and is requesting a x-ray.  An x-ray was obtained, as well as an ECG and a troponin.  

Prior to the troponin result, the RN notes that the patient was "pacing at the doorway, stating he wants to leave and be called with lab values.  Pt. does not want to wait any longer.  MD aware."

Here is the initial ECG.  

Would you allow this patient to leave the ED?


I sent this ECG without any clinical information to Steve Smith, and he responded: 

"Ischemic ST depression in V4 and V5.  So if this is someone with symptoms compatible with ACS, this ECG is diagnostic of ACS."

Analysis of 2 issues: STD V4-5, and Delayed Activation Wave

Despite baseline wander, the initial ECG shows subtle ischemic ST depression in V4-V5.  

1. ST Depression in V4, V5 (by Smith):


In this analysis,  if the ST depression was maximal in V1-V4, that was 96% sensitive for OMI requiring PCI.  

In 196 cases, the STD was maximal in V5-6; 97 of these (51%) were ischemic (other STD max in V5-6 was due to LVH and other causes).   

48/97 (25% of 196, 50% of ischemic ST Depression), were due to OMI, and 22 of the 48 had STEMI as seen in other leads.  

Thus, of those ischemic STD in V5-6 not due to an obvious STEMI, 26 of 75, or about 1/3, were due to subtle OMI.  The remainder of the ischemic STD was due to subendocardial ischemia.  

In other words, if the ischemic ST depression was maximal in V5, V6, without STEMI elsewhere, then such subtle OMI was only present in about 1/3 of cases; 2/3 were subendocardial ischemia.

However, we can get even more granular:  
There were 7 borderline cases: Suspected Ischemic STD Borderline/ Equal Between V4 and V5: 

Quote from the article: "Although the determination of STDmaxV1–4 versus STDmaxV5–6 was dichotomized for all other analyses presented, there were 7 patients with STD for which the interpreter noted that STD was basically equal in leads V4 and V5, making this distinction especially difficult in this small subset. All 7 underwent angiography, 5 had culprit lesions (all LCX), 4 had OMI, and 3 received PCI.

2. Delayed Activation, or "N" terminal wave (by Deep).

In addition, there are "N" terminal or delayed activation waves in leads II, III, and aVF.  

The "N" wave is defined as a notch or deflection in the terminal QRS complex and is typically seen in leads II, III, aVF or I, aVL in association with occlusion of the left circumflex artery.  In the original description, four criteria were required to define an "N" terminal wave: 

1) a notch (or deflection) in the terminal QRS complex
2) the height of the notch > 2mm (compared to PR segment)
3) disappearance of the notch within 24 hours, and 
4) slight QRS prolongation in leads with the notched wave 
--Niu et al. (see references below)

A recent study comparing outcomes between patients with left circumflex occlusion showed equivalent clinical outcomes between STEMI patients and NSTEMI patients with an "N" terminal wave.  The "N" terminal wave in our case may have been possibly resolving, explaining why it doesn't meet the 2mm criteria mentioned above.


The "N" terminal wave differs from the J wave.


Case continued

The patient eloped prior to any discussion about leaving against medical advice.
About 1 hour later, his first (4th generation, not high sensitivity) troponin I returned at 11.3 ng/mL (this is a level consistent with OMI, including STEMI).  He was contacted by phone and agreed to return to the emergency department for evaluation.  

A repeat ECG was obtained at 1am when the patient returned to the hospital. 

In this ECG, there has been loss of QRS voltage and resolution of the ST segment depression in leads V4-V5.  The "N" terminal wave is no longer present in the inferior leads.  Lead III appears to have more QRS fragmentation compared to the presenting ECG.


Cardiology was consulted and recommended medical management overnight with a plan for coronary angiography in the morning.  A repeat troponin returned at 14.9 ng/mL, which prompted cath lab activation at 4am (about 3 hours after he re-presented to the emergency department).  Cardiac cath showed a 100% proximal left circumflex occlusion.


References


===================================

MY Comment by KEN GRAUER, MD (3/26/2022):

===================================

Insightful recognition of some extremely subtle but important findings by Drs. Singh and Smith! For clarity — I’ve put the 2 ECGs in this case together in Figure-1 — to which I’ll add the following comments:


Figure-1: The 2 ECGs in today’s case (See text).


MY Thoughts on the Initial ECG:
This is a challenging ECG to interpret because: i) The ischemic findings highlighted above by Dr. Smith are subtle!; ii) There is baseline artifact that makes it difficult to know which of the 2 or 3 complexes in each simultaneously-recorded lead set are “real”; andiii) Entities other than ischemia may produce similar findings:

  • In the limb leads — baseline artifact is most marked in leads II, III and aVF — and absent in lead I — therefore most likely caused by “something” going on in the Left Leg (CLICK HERE — for Review on HOW to identify the “culprit” lead producing baseline artifact). Rapid identification of the “culprit” lead producing the artifact is relevant in today’s case — since I would have really liked to see a better quality tracing given subtlety of the abnormal findings — and a quick look at this paient’s left leg might have solved this problem.

  • In addition to the inferior lead N waves and localized ST depression identified by Drs. Singh and Smith — there is an overall picture of nonspecific ST-T wave flattening on this tracing and fairly prominent U waves are seen in the mid-precordial leads (BLUE arrows in ECG #1). Knowing serum K+ and Mg++ levels is therefore highly relevant to optimal interpretation in this case — since low levels of these electrolytes might produce similar ECG findings (See My Comment at the bottom of the page in the March 18, 2022 post for more on ECG findings with low K+/Mg++).

  • In my opinion — the History is the most important piece of information in today’s case. This patient is clearly “old enough” (67 years old) to have coronary disease — and the reason this man who is “distrustful of Western medicine” nevertheless presented to the ED  — is new chest pain that was severe enough to prevent him from sleeping. The fact that his symptoms had been ongoing for 24 hours is relevant — because this may indeed account for why findings in ECG #1 are so subtle (ie, this tracing might reflect “pseudonormalization” following resolution of OMI-related ST elevation that was in-process of evolving to reperfusion T wave inversion).
  • Awareness of this history is why despite an ECG picture suggestive of low K+/Mg++ in ECG #1 — our attention needs to be focused on considering acute coronary disease until proven otherwise.


It is because the History in today’s case has us focused on thinking, “this patient has had a coronary event a day ago until we prove otherwise” — that my “eye” focused on several additional subtle findings suggestive of postero-lateral localization from a LCx (Left CircumfleX) “culprit” artery:

  • There is early transition in ECG #1 — as the initial R wave in the small-amplitude QRS complex in lead V1 is relatively tall (considering small size of the S wave in this lead) — and the R wave becomes predominant already by lead V2. Among the causes of early transition are posterior MI (CLICK HERE — for Review of the Causes of a Tall R Wave in lead V1).

  • Although ST-T wave morphology varies in each of the 3 simultaneously-recorded complexes in leads V1,V2,V3 of ECG #1 — the “theme” that I see is that of uncharacteristic ST segment straightening and flattening — which in association with early transition (taller-than-expected R waves in V1,V2,V3) — is a "picture" that to me suggests posterior MI of uncertain age in a patient with symptoms (NOTE: I've commented on this "picture" of a positive "Mirror Test" multiple times in Dr. Smith's ECG Blog — See My Comment in the January 3, 2022 post — the September 28, 2020 post — and the October 11, 2020 post — to name just a few).

  • There is an imbalance of precordial T waves” — in that T waves in lateral chest leads (ie, in V5,V6) are of very low amplitude or flat — and, the T wave in lead V1 is actually taller than the T wave in lead V6. This finding is not seen very often — and in the “right” clinical setting, has been associated with recent OMI from a LCx culprit artery (See Manno et al: JACC 1:1213, 1983 — and the July 17, 2013 post by Salim Rezaie in ALiEM).


MY Thoughts after seeing ECG #2:
The etiology of today’s patient’s symptoms of course became clear when he returned to the hospital at 1 am with worsening symptoms — and — with return of positive troponin values. But from an ECG perspective — a number of confirmatory findings stand out when one carefully compares ECG #2 with ECG #1 (See Figure-1):
  • As noted by Drs. Singh and Smith above — there has been loss of QRS voltage, as well as resolution of the localized ST depression that was initially seen in leads V4-5. As I’ve emphasized in previous posts — among the entities to consider for acute loss of QRS amplitude is myocardial “stunning” from a large infarction (See My Comment in the August 28, 2020 post in Dr. Smith’s ECG Blog). Loss of the localized ischemic ST depression in V4,V5 suggests there have been “dynamic" ST-T wave changes.

  • Despite overall loss of QRS amplitude in ECG #2 compared to ECG #1 — there has been an increase in R wave size in lead V1, such that the R in V1 is now predominant. In addition — T wave amplitude in leads V1,V2 has clearly increased — whereas the T wave in lead V6 has remained flat. These findings confirm ongoing “precordial T wave imbalance” — and are highly correlated with a LCx “culprit”. As noted by Drs. Singh and Smith — cardiac cath confirmed 100% proximal LCx occlusion.

===================================

“Take-Home” PEARL: When T waves in each of the chest leads are upright (or at least not inverted) — the T wave in lead V1 is usually not taller than the T wave in lead V6. 
  • NOTE: This is not to say that tall, upright T waves in lead V1 might not sometimes be the result of a repolarization variant or a mirror-image reflection of LV “strain” that can sometimes be seen in anterior leads. Instead — it is simply to say that on occasion — I have found that recognition of a tall, upright T wave in lead V1 that is clearly much taller than the T wave in lead V6 is a CLUE to an acute coronary syndrome that I might not otherwise have recognized. 
  • The “culprit” artery in such cases is likely to be the LCx (Here is another case = ECG Blog #182).


Recommended Resources