
Case submitted by Dan Singer MD and Ryan Barnicle MD, Written by Pendell Meyers
A woman in her 60s with history of smoking presented to the ED with left sided chest pain radiating to the left arm and back, starting at about 1330. She described the pain as a "heaviness," without exacerbating or alleviating factors. Her pain at the time of arrival was 10/10.
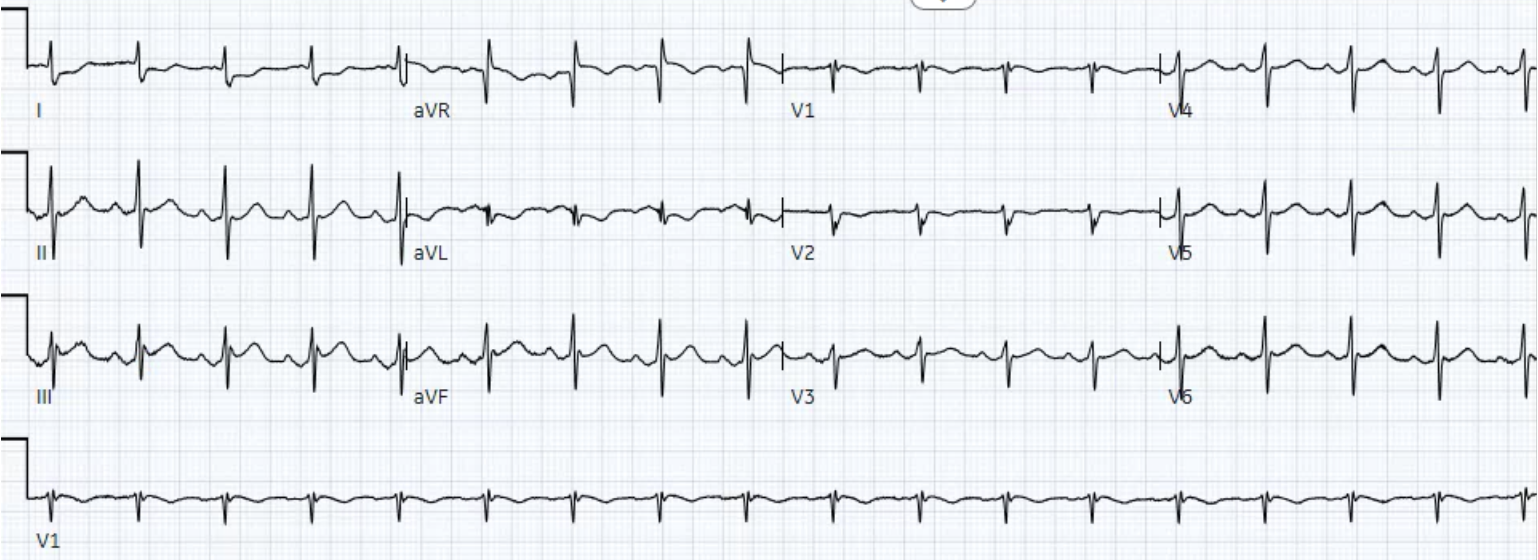
Here is her triage ECG (no prior for comparison):
 |
| What do you think? |
Findings:
- Sinus rhythm at around 100 bpm
- Grossly normal QRS complex
- 1.0 mm STE in lead III, and just a hint of STE in aVF (both of which have to be measured just after significant J waves)
- STD and T wave inversion in lead I and aVL
- A suggestion of almost STD in V2, with negative T wave in V2
Interpretation:
Diagnostic of inferior (and likely also posterior) STEMI(-) OMI. Although J waves (J-point notching) are usually considered a morphologic feature that makes STE less likely to be due to OMI, we have many examples of OMI with J waves on this blog (just like every other ECG rule of thumb you've ever learned). If the inferior leads were viewed in isolation, I would be suspicious of the volume underneath the T waves especially in lead III, but I would not be 100% certain that they are hyperacute. However, lead aVL solves the case as usual, confirming inferior OMI: lead aVL has a narrow normal QRS complex followed by STD and large-volume T wave inversion. Lead aVL makes STE and T waves in lead III extremely likely to be due to OMI. The slight STD and T wave inversion in V2 support the diagnosis as these very likely represent posterior extension. Notice also that there is reciprocal STE in aVR (this is very slight and to some extent is due to baseline wander).
These findings were immediately recognized by Drs. Singer and Barnicle, and the cath lab was activated.
The cardiologists agreed with their concern and took the patient immediately to the lab (long before the first troponin T would return positive at 0.24 ng/mL). Despite the fact that it does not meet STEMI criteria, the cardiologists interestingly documented it as a STEMI (some people who have no other way to express the concept of OMI simply use the word "STEMI" incorrectly in place of the concept of OMI).
They found complete (TIMI 0) thrombotic occlusion of the OM1, opened successfully with one stent.
 |
| Before intervention: OM1 occlusion in center image |
 |
| Before intervention: occlusion annotated |
 |
| After intervention: full course of the OM1 running from center screen to bottom right corner. |
 | ||
Soon after intervention, showing almost complete resolution of inferior STE and reciprocal findings in aVL. Interestingly, there are no longer any J waves in this ECG except lead V6.
|


===================================
MY Comment by KEN GRAUER, MD (9/23/2020):
===================================
I thought this was a fascinating case for a number of Reasons!
- Reason #1: Drs Singer, Barnicle and Meyers all diagnosed acute OMI primarily on the basis of the reciprocal ST-T depression in lead aVL — rather than by ST elevation in the inferior leads. Most often with OMIs, our attention is captured by that lead area that shows ST elevation rather than ST depression.
- Reason #2: This case illustrates the concept of “inter-cardiologist variation in terminology”. As per Dr. Meyers — Despite not satisfying “millimeter-criteria” for a STEMI — the cardiology team documented this case in their notes for the record as a “STEMI”, perhaps because they promptly decided to take the patient for emergency catheterization. Although I am GLAD the cardiology team appropriately intervened with prompt cath and PCI (complete occlusion of the 1st-Obtuse Marginal branch of the LCx was found) — the optimal terminology (as per Dr. Meyers) should have been to call this an OMI ( = Occlusion-based MI, not clearly satisfying STEMI criteria). As we’ve shown many times on Dr. Smith’s ECG Blog — different cardiologists tend to define acute coronary syndromes using different terminology. The terminology that should count is being able to recognize acute occlusion of a major coronary artery — regardless of whether or not millimeter-criteria for a STEMI are met (SEE My Comment in the July 31, 2020 post on Dr. Smith’s ECG Blog).
- Reason #3: The prominent J waves seen in multiple leads in the initial ECG for this case evolve over the course of the 3 serial ECGs that are presented. I would call these Osborn waves — and they provide a significant clue, not only to active ischemia — but also to potential risk of developing malignant ventricular arrhythmias! ( = another reason it was fortunate that this patient was catheterized and reperfused so promptly!).
For clarity and EASE of viewing — I have reproduced the 3 ECGs in this case in Figure-1.
- WHAT changes do YOU see occurring over the course of these 3 tracings?

MY Thoughts on ECG #1: As per Dr. Meyers — the diagnosis of acute OMI in the initial ECG ( = ECG #1) would have been equivocal based on the ST-T wave appearance in the inferior leads. That’s because there is only 1 mm of ST elevation in lead III — no more than a “hint” of ST elevation in lead aVF (when one discounts the J wave) — and no ST elevation at all in lead II.
- Dr. Meyers highlights the abnormal appearance in ECG #1 of lead aVL (which shows ST depression and large-volume T wave inversion) as the KEY for strongly suggesting OMI.
- While I completely agree with Dr. Meyers’ assessment — it’s helpful to remember that sometimes the T wave in lead aVL may be negative not due to ischemia, especially when the QRS complex is not predominantly positive (as seen here).
- PEARL #1: I’d add that in addition to lead aVL — it is the ST-T wave appearance in lead I of ECG #1 that convinced me 100% that something acute was actively ongoing in this 60-something woman with new-onset chest pain. The straightening (flattening) of the depressed ST segment in lead I is unmistakable — and combines with the ST-T wave appearance in lead aVL to remove any doubt about the acute nature of what we see in the inferior leads.
Dr. Meyers also highlighted the presence of significant J waves in ECG #1.
- Did YOU notice WHAT HAPPENS to these prominent J waves over the course of the next 2 ECGs that were done? (Figure-1).
OSBORN Waves: The Osborn wave has been described as a deflection with a dome or hump that occurs at the point where the end of the QRS complex joins with the beginning of the ST segment. This is the J-Point (ie, it Joins the end of the QRS with the beginning of the ST segment) — so Osborn waves are exaggerated “J waves” or J-point waves. They’ve also been called the “camel-hump” sign.
- First described in 1953 (by Dr. John Osborn) — these Osborn waves are most commonly associated with significant hypothermia (usually not seen until core temperature is below 90°F).
- PEARL #2: It is important to appreciate that other conditions may also be associated with this prominent J-point deflection. Osborn waves have been reported with hypercalcemia, brain injury, subarachnoid hemorrhage, Brugada syndrome, cardiac arrest from VFib — and — severe, acute ischemia resulting in acute MI (SEE My Comment in the November 22, 2019 post on Dr. Smith’s Blog).
- Rituparna et al describe an interesting case in which the most notable initial ECG change in a patient with acute coronary occlusion was development of localized and prominent J waves (Pacing Clin Electrophysiol 30[6] 817-819, 2007). They acknowledge the paucity of data in the literature regarding the occurrence of J waves as a result of acute ischemia — and they go on to propose development of a transmural voltage gradient during the early phases of ischemia as the mechanism for ischemic-induced J waves. With persistence of ischemia — J waves disappear and/or are integrated into the more typical acute infarction sign of ST elevation.
- PEARL #3: Rituparna et al — as well as Chauhan and Brahma (Int. J. Crit. Illn. Inj. Sci 5[4] 268-270, 2015) both highlight a likely association between acute development of ischemic J waves — and high risk of developing malignant ventricular arrhythmias. Fortunately, the patient in today’s case was promptly catheterized and reperfused before malignant arrhythmias developed.

Figure-2: I've labeled J waves for the 3 ECGs in today's case (See text).
The Evolution of J Waves in Today’s Case:
To facilitate recognition of J waves in today’s case — I drew a vertical RED line up from where the most prominent J wave was seen in the initial ECG (See Figure-2). This identifies the precise location of J waves in the simultaneously-obtained long lead V1, that corresponds to the timing of J waves in other leads (as per the vertical BLUE lines that I drew for the other lead groupings).
- The RED arrow in lead III of ECG #1 highlights the most prominent J wave in this initial ECG.
- BLUE arrows in ECG #1 highlight other notable J-point deflections.
- GREEN arrows in ECG #1 highlight negative notching that I thought looked unusual (ie, it looks like there is a 4-phase complex = rSr’s’ in lead V1 — and I don’t remember the last time I saw a qrs complex in lead aVL of the shape like the one we see in ECG #1).
- NOTE: I would have loved to see a baseline tracing on today’s patient — to determine IF all J points (and if the other unusual notching) were new findings in today’s initial ECG.
- KEY Point: Shortly after the cardiac catheterization (ie, shortly after reperfusion by PCI) — Note how 5 of the 6 leads that had manifested J waves in ECG #1 no longer do so in ECG #2! Note especially that despite virtually no change in QRS morphology or axis in the 6 limb leads — those overly prominent J waves that were seen in leads III and aVF in ECG #1 have disappeared.
- As a “side note” — the extra negative terminal notch in lead V1 of ECG #2 has resolved (perhaps buried within the slurred S wave in V1). We still see that terminal negative notch in lead aVL (GREEN arrow in ECG #2).
- Finally, in ECG #3 — those terminal negative notches in leads aVL and V1 are gone. There now is a J point in lead I — and hint of terminal QRS slurring (GREEN arrows in ECG #3) — but clearly, there is a notable reduction in J wave presence following acute reperfusion of the occluded coronary artery.
BOTTOM Line: Even without a baseline tracing on this patient — the fact that J wave prominence promptly diminished following acute reperfusion in this patient to me suggests that the prominent J waves in this case were an important manifestation of the acute ischemic process.
- While clearly not common to see new development of prominent J waves as a manifestation of acute ischemia — it is good to be aware of this possibility. Appreciation of this potential relationship between new prominent J waves and OMI may sometimes serve as an important early marker of acute coronary occlusion.
- As noted earlier — recognition of this unusual ECG finding takes on added importance given its predictive value for increased risk of impending malignant arrhythmias.

Great case. I wonder why we do no longer use lead V7, 8 and 9 whi h were touted as adding 15% to the diagnosis of LCX related MI'S. I USED TO DO Right sided leads to better diagnose TVMIs. Perhaps we also need more sophisticated equipment that will also eliminate baseline wander and electrodes that can stay in the same place for several days.
ReplyDeleteTHANK YOU for your comment! Please cite me the reference whereby 15% more LCx occlusions are diagnosed by the use of leads V7,V8,V9. As I do not have access these days to PubMed — I’d LOVE to see the actual article — so that I could see the actual 12-lead ECGs that the authors cite are “non-diagnostic” (my email = ekgpress@mac.com).
DeleteFor example — in the article by Gorselen et al (https://www.ncbi.nlm.nih.gov/pmc/articles/PMC1847720/ ), in which the authors laud the benefits of posterior leads for diagnosing posterior MI — the ECG example they give is to my eye MUCH more obviously apparent as acute posterior MI from the standard 12-lead ECG (ie, tall R in V1, but especially by diagnostic positive “mirror test” findings in lead V2, with lead V2 showing maximal ST depression) compared to the modest amount of posterior lead ST elevation seen with V7,8,9. THANKS again for writing! — :)
Thanks for presenting this case.
ReplyDeleteThe distortion of the end of QRS in ECG 3 looks like a N-wave in inferior leads and perhaps DI, aVL.
THANKS so much Gilles for your comment! J’en suis tout à fait d’accord avec toi! ( = I couldn’t agree more!). Apparently there are a number of different terminologies for the deflection in today’s case. Niu et al (Int. J Cardiol 162[2]:107-111, 2013) — define the “N” wave as a notch or deflection in the terminal QRS complex of the surface ECG. They and others have suggested that finding this deflection in one or more inferior leads (sometimes also in leads I and aVL) helped identify the LCx as the “culprit” in patients with NSTEMI.
DeleteThese authors go on to postulate, “The abnormal waveform in terminal QRS complex in NSTEMI is the delayed activation wave of left ventricular basal region which the left circumflex artery supplies”. To this, I ask — But isn’t this deflection an Osborn wave or prominent J wave?
The other question I have is that these authors studied a group of 218 NSTEMI patients — but HOW MANY of these NSTEMI patients really had ECGs that showed OMI? All that said, regardless of what this interesting deflection is called — it is helpful to know we should look for it. I’ll also be trying to correlate what happens clinically if/as these J (or N) waves resolve on serial tracings.
The "N-wave" is the same as the "delayed activation wave" which we discussed in these 2 posts below.
DeleteThis wave in this post does not resemble an N-wave (it is not an N-wave).
Paper: https://www.internationaljournalofcardiology.com/article/S0167-5273(11)00476-1/abstract
Post: Is There a Delayed Activation Wave???
URL of post: http://hqmeded-ecg.blogspot.com/2018/05/is-there-delayed-activation-wave.html
Citations: "Diagnostic of inferior (and likely also posterior) STEMI(-) OMI", "...complete (TIMI 0) thrombotic occlusion of the OM1" and "Echo noted EF 50% with sever hypokinesis of the anterior, lateral, and apical walls".
ReplyDeleteIs this about same patiеnt? Echo is suspicious.
I don't understand the question. Echo is suspicious of what?
DeleteAh thank you. It appears that I had mixed up two echos from two cases I was writing up at the same time. I have verified and corrected the echo findings above. Thanks!
DeleteThank you for great case!
Delete