Monday, February 27, 2023

What are these hyperacute T waves, with STE and T-wave inversion in aVL, and STD in inferior leads?

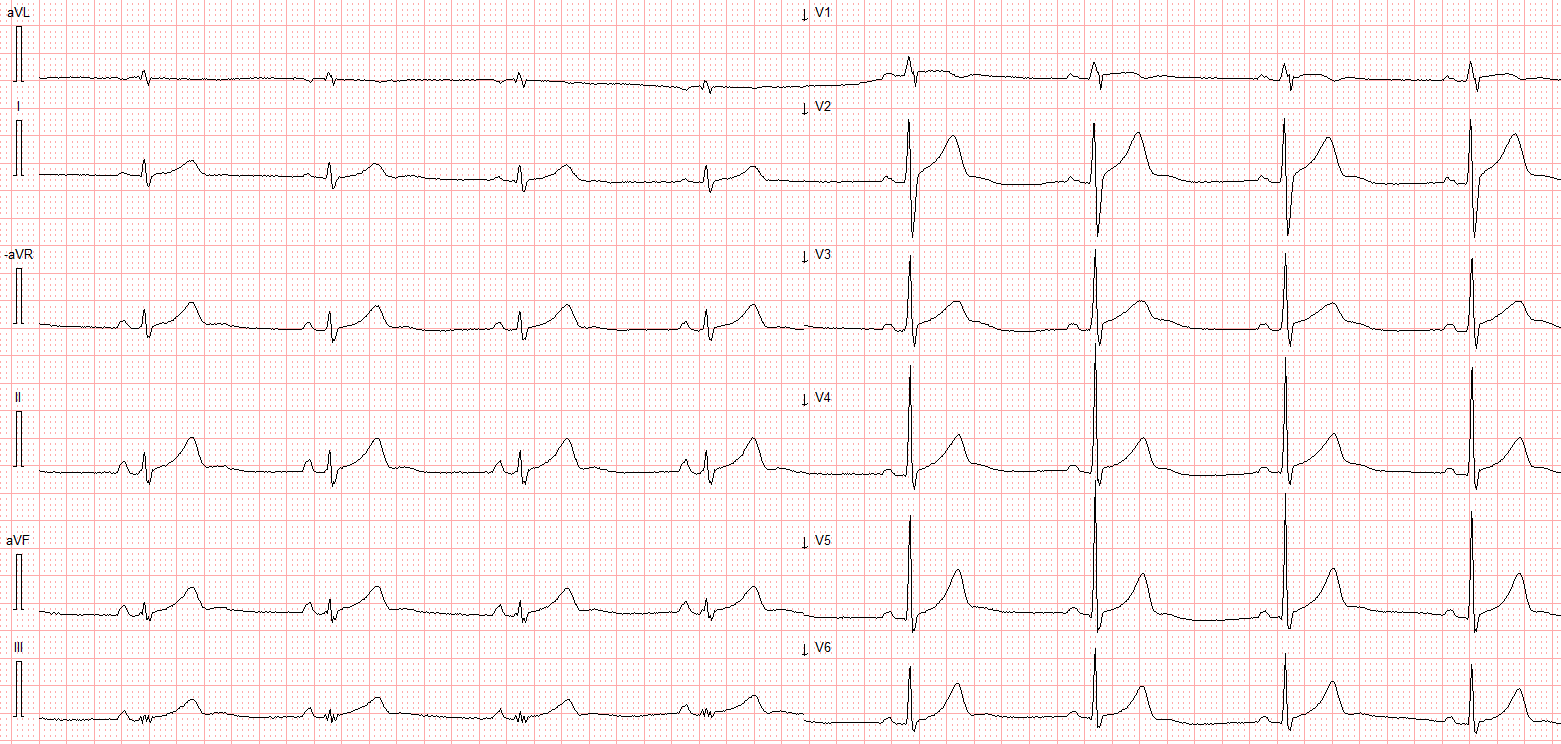
 I was reading EKGs on the system and came across this one:

What do you think?


This is diagnostic of hyperkalemia.  HyperK can result in all sorts of pseudoSTEMI or pseudoOMI patterns, including ST elevation, ST depression, and large T-waves.

These T-waves are tall but have a narrow base and a corresponding flat ST segment (see lead V4).  Also, there are no definite P-waves and this is another result of hyperkalemia.  In fact, sometimes the sinus node is working and acting as a pacemaker but no P waves are visible!!  This is called sino-ventricular rhythm.  See these 3 other posts of sinoventricular rhythm


The K came back at 6.2 mEq/L.

The patient was treated.

He ruled out for MI by troponins.

No followup EKG was recorded!!


See many examples of Pseudo STEMI due to hyperkalemia at these two posts:

Acute respiratory distress: Correct interpretation of the initial and serial ECG findings, with aggressive management, might have saved his life.


===================================
MY Comment by KEN GRAUER, MD (2/27/2023):
===================================
One of the most common "ECG Emergencies" entails prompt recognition of Hyperkalemia — with our goals being: i) Avoidance of misdiagnosis (ie, mistaking tall, peaked T waves for deWinter T waves — as seemed to occur in today's case)and, ii) Prompt treatment of this potentially life-threatening condition (ie, with calcium) — which should often be given prior to lab confirmation of hyperkalemia, because cautious administration of IV calcium is safe — and not-to-promptly treat the patient risks losing the patient.

We've presented numerous examples of hyperkalemia on Dr. Smith's ECG Blog. Today's case presents a few more of the "Many Faces" of Hyperkalemia that are important for us to appreciate. I'd add the following to Dr. Smith's discussion:
  • As always — I favor beginning my assessment with a Systematic Approach. Descriptive analysis of the ECG in today's case reveals a regular, narrow tachycardia at ~130/minutewithout clear sign of sinus P waves. 
  • QRS amplitude appears increased in several chest leads (ie, very deep S waves in leads V1,V2 — large isoelectric complex in V3).
  • There appears to be a Q wave in lead aVL — though limb lead artifact makes this difficult to assess.
  • As per Dr. Smith — T waves in multiple leads are tallpeaked, and manifest a narrow base. This is especially true in leads V2,V3 — in which T wave amplitude exceeds 15 mm! Of note — these T waves are symmetric, with similarly angled ascending and descending limbs of the T wave. 

  • BOTTOM LINE: As per Dr. Smith — this ECG is diagnostic of Hyperkalemia until you prove otherwise.  


QUESTIONS:
  • What is the rhythm?
  • Given how tall the T waves are and the lack of P waves — Why isn't the QRS wide?
  • Why isn't the serum K+ higher than 6.2 mEq/L?
  • Why is there T wave inversion in leads I and aVL?

  • Finally — Could anything else be going on with this patient?

===================================

WHAT is the Rhythm in Today's Case?

Dr. Smith suggests that the rhythm in today's case is sinoventricular rhythm — because it is common with hyperkalemia for sinus node activity to continue (at least for a while) despite the disappearance of P waves on ECG.

  • In today's case — I fully acknowledge that I do not know for certain what the rhythm is. The QRS is narrow — and no P waves are seen. But the rate is ~130/minute — which is a bit fast for sinus tachycardia. So IF this is sinus tachycardia with a sinoventricular rhythm — then we have to explain WHY the rate is this fast.
  • Alternatively — the rhythm could be junctional tachycardia ... 
  • Finally — it almost looks like there are 2 equally spaced upright deflections in lead aVR, which if true might indicate 2:1 AFlutter.

  • BOTTOM Line: Practically speaking — it does not matter what the rhythm in today's case is — because IF this patient would be promptly treated with Calcium — whatever this rhythm was would most probably rapidly resolve.

As a reminder of why determination of the cardiac rhythm can be so challenging when there is significant hyperkalemia — I've reproduced Figure-1 from My Comment in the January 16, 2022 post in Dr. Smith's ECG Blog. 


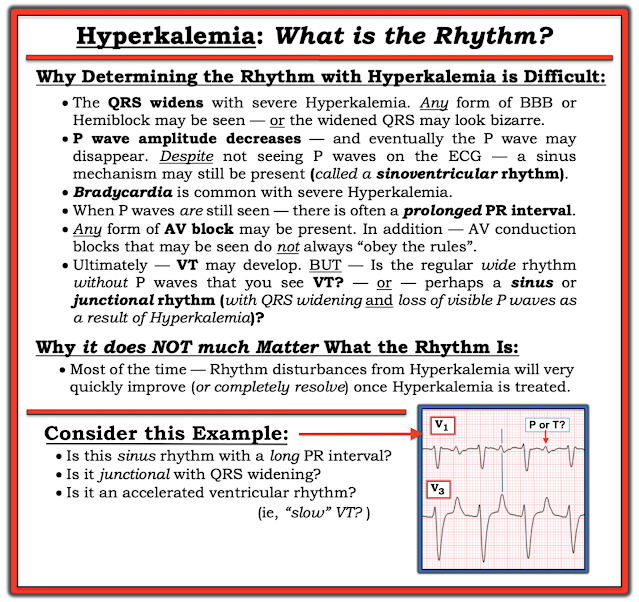
Figure-1: Reasons for the difficulty determining the rhythm with severe hyperkalemia.


WHY Isn't the QRS Wide?
I think it helpful to appreciate the "textbook" sequence of ECG findings seen with progressive degrees of hyperkalemia. While fully acknowledging that "not all patients read the textbook" — I have found awareness of the ECG generalizations in Figure-2 to be extremely helpful.
  • TO EMPHASIZE — Not all patients follow the sequence of ECG changes shown below in Figure-2. For example — some patients may develop everything except QRS widening. Others may not show T wave peaking — or may only show this finding as a later change. And despite marked hyperkalemia — some patients may not show any ECG changes at all
  • The above said — Over the years, I have found Figure-2 to be helpful as a guide that does hold true in a significant percentage of patients.

  • P.S.: There are times when even before the serum K+ value returns from the lab — you know from the ECG that there is severe (life-threatening) hyperkalemia. For example — marked bradycardia with unusual forms of advanced AV block — or marked bradycardia without evident P waves — or marked QRS widening with "shapeless" morphology — are all ECG indication of the need for immediate IV calcium until improvement of these ECG patterns.

Figure-2: The “textbook” sequence of ECG findings with hyperkalemia. (I've reproduced this figure from My Comment in the January 6, 2020 post of Dr. Smith's ECG Blog).


Why Isn't the Serum K+ Higher than 6.2 mEq/L?
Despite the lack of atrial activity and the extremely tall T waves in multiple leads — the serum K+ value of 6.2 mEq/L is not overly high. Judging by the ECG in today's case — I would have anticipated a higher value. Several reasons may explain this lower-than-expected serum K+ value:
  • As emphasized above — the "textbook" sequence shown above in Figure-2 is not perfectly followed by all patients.
  • Certain conditions (ie, DKA) may be associated with rapid intra-extracellular K+ shifts — such that serum values can change quickly.
  • There is often missing documentation as to when which ECG was recorded at the time of which blood draw (and whether any treatment had yet been initiated). So the 6.2 mEq/L K+ value may (or may not) closely correlate to the timing of today's ECG.

Why is there T Wave Inversion in Leads I and aVL?
Much attention focuses on the appearance of tall, peaked and pointed T waves in association with hyperkalemia. Not commonly appreciated — is that sometimes, you may see deep, symmetric and pointed T wave inversion in a number of leads. This is usually not ischemic — but rather another ECG manifestation of hyperkalemia.
  • Aren't those deep, symmetric T wave inversions in leads I and aVL the virtual "mirror-image opposite" of the tall, pointed upright T waves in leads III and aVF?

Could Anything Else Be Going On?
We are told that the patient in today's case was ruled out for MI — but that no follow-up ECG was recorded. In my opinion — Not recording a follow-up ECG after treatment of hyperkalemia was a mistake!
  • The ECG of a patient with hyperkalemia shows the net effect of what underlying ST-T waves looked like before development of the tall, peaked T waves of hyperkalemia. Only after correcting hyperkalemia and repeating the ECG — will you be able to determine whether ischemic ST-T wave changes exist.
  • This point is especially relevant in today's case — because the T waves in many leads are especially tall (and there is also deep T wave inversion in leads I and aVL). TO EMPHASIZE — Although I suspect that all ST-T wave abnormalities will normalize with correction of the hyperkalemia in today's case — we do not know this for certain without repeating the ECG.

  • The other reason why the ECG in today's case should have been repeated after correction of hyperkalemia — is that the only cardiac rhythm documented in this case is an SVT at ~130/minute without sinus P waves. We do not know for certain what the rhythm was? And, there is no documentation that the tachycardia has resolved.

Thursday, February 23, 2023

A man in his 40s with epigastric pain and ST Elevation

Case submitted by Magnus Nossen MD, written by Pendell Meyers


A previously  healthy man in his 40s presented to the ED with epigastric abdominal pain off and on for several days. Vitals were within normal limits.

It is unclear whether he had active pain at the time of the first ECG:

What do you think?


Here is PM Cardio's Queen of Hearts interpretation (AI ECG interpretation trained by Meyers, Smith, and PM Cardio team using thousands of cases and their outcomes):

The output number ranges from 0 to 1, with numbers closer to zero meaning likely NOT OMI, and numbers closer to 1 meaning OMI. This result of 0.0002 is obviously incredibly low and thus the AI is giving a very strong signal against OMI. We are still studying the best cutpoint, and our publications on this are coming soon, but so far it seems to be somewhere in the range of 0.10-0.20 (above which, the ECG likely represents OMI).


The team was concerned about possibly ischemic ST elevations on the ECG above, so they took it to Dr. Nossen for consultation.


Dr. Nossen needed no AI and interpreted this as ectopic atrial rhythm (ectopic atrial escape as the heart rate is in the range of 48 bpm), with normal variant ST elevation likely exaggerated by atrial repolarization (termed "Ta" wave).


Dr. Nossen performed a bedside ultrasound which was interpreted as normal. He then made the patient do some squats in the room, in hopes to make the sinus node increase its rate and usurp the rhythm from the ectopic atrial focus.

After the heart rate increased slightly, here was the repeat ECG:


Sinus bradycardia, only slightly faster rate than prior.


Now that the rhythm is converted back to sinus, we can see that the component of STE and enlarged T wave from the Ta wave has been removed, leaving just normal variant STE and normal T waves.


Troponin was negative.


The patient was worked up for abdominal pain with unclear diagnosis, and he was able to be discharged.


Learning Points:

Ectopic atrial rhythm can produce atrial repolarization findings that can be confused for acute ischemia, STEMI, or OMI.

If you can safely and easily increase the patient's heart rate, you can convert the patient to sinus and repeat the ECG to see if the atrial repolarization wave was the cause of the concern for ischemia. 


See these similar cases:

A man in his sixties with chest pain


Why is there inferior ST elevation, and would you get posterior leads?


==================================
Comment by KEN GRAUER, MD (2/23/2023):
==================================
As today's case was contributed by Dr. Nossen, who practices in Norway — today's ECG uses the Cabrera Format. For readers not familiar with this format — I've reviewed its features in the Addendum at the bottom of the page in the April 24, 2022 post in Dr. Smith's ECG Blog.


The KEY to interpreting today's case — is to be aware of the Emery Phenomenon. As emphasized in My Comment at the bottom of the page of the June 3, 2020 post in Dr. Smith's ECG Blog — Almost everyone gets fooled the 1st time they see this phenomenon. Because of its potential for invoking uneeded cardiac catheterization or hospital admission — it is worth periodically reviewing this ECG pattern.
  • The 1st Clue in today's case that cardiac catheterization was probably not needed — is in the History. The patient was a previously healthy man in his 40s, who presented with intermittent epigastric abdominal pain over the past several days. While exceptions always exist — this clinical setting sounds like a lower prevalence presentation for acute coronary disease.

  • The 2nd Clue — lies with determination of the rhythm. For clarity in Figure-1 — I've put the 2 ECGs in today's case together. I've placed the initial ECG ( = ECG #1) on the BOTTOM of Figure-1. 
  • Note the negative P wave in lead II of ECG #1 (BLUE arrow). In view of the normal PR interval with this negative P wave — this suggests there was a low atrial rhythm (rather than a junctional rhythm) in the patient's initial ECG. Awareness that the presence of a negative P wave in the inferior leads (be this from a low atrial or junctional rhythm) — sets up conditions for the Emery Phenomenon, and serves as the 2nd Clue that there is likely to be some non-ischemic ST elevation.


What Happens with the Emery Phenomenon?
The schematic illustrations to the left in Figure-1 — illustrate what happens with the Emery Phenomenon.
  • An atrial repolarization wave (ie, the T of the P wave) is always present on ECG. With sinus rhythm, the timing of the Tp will largely coincide with the timing of the QRS complex — and therefore not be noticed on the ECG (dotted RED half circle, seen in the TOP schematic illustration in Figure-1).
  • Note that the Tp is oppositely directed to the P wave. Therefore, with normal sinus rhythm (in which by definition, the P wave will be upright in lead II) — the TP will be negative.
  • BUT — IF the P wave in lead II is negative (as may occur with either a low atrial or junctional rhythm) — then the Tp will be upright (dotted RED half circle, seen in the BOTTOM schematic in Figure-1). If the Tp wave is large in size and upright — it may distort the end of the QRS complex, and produce the false impression of ST elevation.

KEY Points:
The size of the Tp wave will be proportional to the size of its P wave. A small P wave will produce a correspondingly small Tp wave. A large P wave will produce a much bigger Tp wave.
  • The effect of the oppositely-directed atrial repolarization wave ( = the Tp — also known as the "Ta" or atrial T wave) will be even larger than shown in the schematic illustrations in Figure-1 — because normal duration of the Ta wave is significantly longer (up to 2-3 times longer) than normal P wave duration (Francis). This may account for an "exaggerated" effect on the ST segment when the negative P wave is large.
The other important factor determining the amount of ST-T wave distortion potentially produced by the Emery Phenomenon — is the duration of the PR interval for the negative P wave that is seen in the inferior leads.
  • If the PR interval of the negative inferior lead P waves is shorter (as is likely with a junctional rhythm) — then the Emery Phenomenon may result in more false-positive ST elevation (with more rightward Tp displacement, as was seen for the ECG from the June 3, 2020 post).
  • In contrast — the PR interval of the negative inferior lead P waves in today's case is longer. I believe this is what accounts for the ST takeoff "straightening effect" of the Emery Phenomenon, with a more modest amount of false-positive J-point ST elevation (ST takeoff straightening shown by the BLUE lines in ECG #1) — compared to the more normal, gradual upsloping ST segments with sinus rhythm (curved PURPLE lines in ECG #2). Because of the Emery Phenomenon — multiple limb lead T waves look hyperacute in ECG #1 (BLUE lines in this tracing).

Figure-1: The initial ECG in today's case ( = ECG #1on the BOTTOM) — compared to the repeat ECG after the patient did squats in the room ( = ECG #2on the TOP). To the left of these tracings is schematic illustration of the Emery Phenomenon (adapted from the 2015 post by Dr. Bojana Uzelac on Armel Carmona’s ECG Rhythms website).


Random Additional Thoughts on Today's Case:
  • The 3rd Clue in today's case that the initial ECG does not represent an acute cardiac event — is the similar pattern of T wave peaking for almost all of the T waves in ECG #1. In contrast, with acute MI — the ST-T waves of concern are much more likely to localize on the ECG, often producing reciprocal changes in opposing leads (and usually not producing a picture were so many T waves on the tracing show similar morphology).
  • By itself — a low atrial rhythm is commonly seen as a normal variant. When intermittently seen in an otherwise healthy and asymptomatic young adult — No evaluation of this rhythm is needed.
  • That said — what is unusual about the rhythm in the initial ECG of today's case — is the marked bradycardia! Whether this is the result of a vasovagal reaction to the patient's abdominal pain? — or whether it is "his normal" heart rate as a result of athletic endurance training? — is not known form the information we were provided. Even after exercising in the ED (which successfully raised heart rate enough for return of sinus rhythm) — the patient's heart rate in ECG #2 is still a bit under 50/minute.
  • The bedside Echo performed by Dr. Nossen in today's case served 2 useful purposes: i) It ruled out an acute wall motion abnormality at the time that some providers were concerned about an acute ischemic process; andii) It ruled out HCM (Hypertrophic CardioMyopathy)! To realize that this patient's baseline ECG is not completely "normal" — in that there is a predominant R wave in lead V1. While this may simply be a normal variant or the result of body habitus — HCM is among potential causes of a Tall R Wave in Lead V1 that today's ECG could be consistent with (For more on the Causes of a Tall R Wave in V1 — Please see My Comment at the bottom of the page in the December 10, 2022 post of Dr. Smith's ECG Blog).

  • BOTTOM Line: Having the patient exercise briefly in the ED, in order to speed up his baseline heart rate enough for return of sinus rhythm was a superb maneuver by Dr. Nossen. As seen by the comparison of today's 2 ECGs (Figure-1) — this maneuver was enough to result in reduction of ST elevation and return of the gentle ST segment upsloping seen in normal tracings (curved PURPLE lines seen in ECG #2). Given the atypical history and negative Echo — false-positive ST-T wave changes from the Emery Phenomenon were confirmed — and the patient could be safely discharged.  


Friday, February 17, 2023

Chest pain, among other symptoms. What do you see?

 This patient had many complaints including chest pain.


The computer called this ***Acute STEMI***
What do you think?


STEMI never has a very short QT.  This QT interval is 320 ms, with a QTc of around 350, depending on which correction formula you use.  (There is Bazett, Fridericia, Hodges, Framingham and Rautaharju -- see here at mdcalc: https://www.mdcalc.com/calc/48/corrected-qt-interval-qtc

If the ST Elevation here were due to STEMI, it would be an LAD Occlusion.  You can use my LAD Occlusion/Normal Variant STE formula on this.  I did, and the result was the lowest value I have ever obtained (10.4).  It is virtually impossible to have an LAD Occlusion with such a low formula value.  

It is the short QT which drives that value down.  

When the QT is very short, there are 2 important diagnoses to consider:

1. Short QT syndrome.  This causes deadly arrhythmias and should be considered in patients with syncope and short QT

2. Hypercalcemia.


I sent this to Jesse McLaren (@ECGCases) and he immediately responded "Hypercalcemia?"


The ioninzed calcium was 6.5 mEq/L (very high).


==================================
Comment by KEN GRAUER, MD (2/17/2023):
==================================
Today’s case is from a patient with “many complaints”, including chest pain — and, an ECG that raised concern about acute anterior OMI. As per Dr. Smith — there are 2 pieces of “good news” regarding this case. These are:
  • On careful review — the patient’s initial ECG is not suggestive of acute OMI.
  • Instead of OMI — the initial ECG strongly is strongly suggestive of hypercalcemia.


The “beauty” of today’s case — is being able to quickly discount acute OMI from likely diagnostic consideration — and — being able to diagnose a metabolic condition from an ECG.
  • For clarity in Figure-1 — I’ve labeled today’s initial tracing.

Figure-1: I’ve labeled the initial tracing in today’s case.


Why Acute OMI is Unlikely:
As per Dr. Smith — the QTc of the ECG in Figure-1 is 350 msec. This is an extremely short QTc value.
  • The QTc is usually increased with acute OMI. Although the QTc can sometimes be normal with OMI — it should not be short (See below from more on specific QTc interval durations).
  • Although there is ST segment coving with some J-point ST elevation in anterior leads V1-thru-V3 — the shape of these ST-T waves does not “look like” acute OMI. Instead — the shape of ST-T waves is unusual for OMI, in that the peak of the T wave occurs early! (See below for more on the timing of T wave peaking)
  • Instead the localization of ST-T wave findings (as typically is seen with acute OMI) — the shape of ST-T waves in ECG #1 looks similar in 10/12 leads (ie, upright ST-T wave with ST takeoff straightening and short T wave peak time).

==================================
As per Dr. Smith — The differential diagnosis for today’s tracing, with its short QTc ~350 msec. is: i) SQTS (Short QT Syndrome)and, ii) Hypercalcemia.

Features of Short QT Syndrome:
From My Comment at the bottom of the page in the September 2, 2019 post of Dr. Smith’s ECG Blog:
  • SQTS is an inherited cardiac channelopathy determined by the presence of symptoms (syncope, cardiac arrest) — positive family history — and the ECG finding of an abnormally short QTc interval.
  • SQTS is a relatively new diagnosis that has only been recognized as a distinct clinical entity since 2000. The disorder is rare — but it takes on importance as a potential cause of atrial and ventricular arrhythmias, including cardiac arrest. Treatment is by ICD (implantable cardioverter defibrillator).
  • Males with a QTc ≤330 ms — and females with a QTc ≤340 ms are defined as having SQTS, even if they are asymptomatic.
  • Males with a QTc ≤360 ms — and females with a QTc ≤370 ms are said to have a short” QTc. Such patients may have SQTS if, in addition to the "short" QTc — there is a history of cardiac arrest, unexplained syncope or atrial fibrillation at an early age.

  • Regarding Today’s Case: We were not told the age or sex of today’s patient. As can be seen from the above cited QTc intervals — this demographic information is relevant to today’s case! That said — the QTc estimated for today's patient = 350 msec., which places the patient (regardless if male or female) — into the classification of a “short” QTc (but not quite short enough to qualify for SQTC). Assuming there was no history of cardiac arrest, unexplained syncope or AFib at an early age — cardiac risk from a “short” QTc is clearly less than for patients with frank SQTC.


The ECG Diagnosis of Hypercalcemia:
From My Comment at the bottom of the page in the October 30, 2020 post of Dr. Smith’s ECG Blog:
  • While the textbook description of ECG findings of hypercalcemia is often limited to “QT interval shortening” — QT shortening is not an easy ECG finding to recognize (even when you are looking for it!). In addition, what is not described in textbooks — is how high the serum Ca++ must go before such QT interval shortening occurs. As Family Medicine Attending (working in and out of the hospital) — I religiously scrutinized the ECGs of all patients I encountered in whom serum calcium levels were elevated. In my experience — NO change in ECG appearance was noted in the overwhelming majority of hypercalcemic patients until their serum Ca++ level was significantly elevated (ie, a total calcium level over 12 mg/dL). KEY Point: — Do not expect to pick up hypercalcemia on ECG unless serum Ca++ is increased by a lot. (The ionized serum calcium level of 6.5 mEq/L in today’s case clearly qualifies as sufficiently elevated to produce ECG changes).

  • PEARL: More than simply QT interval “shortening” — the principal ECG finding of significant hypercalcemia is a short-Q-to-peak-of-T interval. By this I mean that the time it takes for the T wave to attain its peak is shortened with significant hypercalcemia. I know of no measurement to quantify this shortened time-until-T-wave-peak. Instead — it is a subjective judgment — that with experience (armed by an increased index of suspicion for the case-at-hand) YOU can learn to appreciate.
  • Regarding ECG #1 — I chose the lead with the most ST-T wave deviation ( = lead V2 in Figure-1to draw in 2 vertical BLUE lines highlighting the point where I thought definite “peaking of the T wave" is seen. Subjectively — Doesn’t the time until attaining this T wave peak seem short? (with respect to the vertical RED line that marks the end of the T wave in this lead).


The Importance of the History in Today’s Case:
Hypercalcemia to at least a moderate degree (ie, serum calcium level >12 mg/dL) is not a common diagnosis in an unselected ED population.
  • Although there is a fairly long list of potential causes of Hypercalcemia — more than 90% of these patients will have either primary hyperparathyroidism or malignancy. (The relative percentage of patients with hypercalcemia from malignancy — will clearly be much higher in an oncology population).
  • This is where the History in today’s case comes in. Depending on the age and sex of today’s patient, as well as additional historical details — the likelihood of malignancy vs a non-lifethreatening cause of hypercalcemia will be greatly influenced. The cause of hypercalcemia needs to be found.

  • Final Speculation: We are told that today’s patient presented with “many complaints”. Chest pain was just one of these complaints. Significant hypercalcemia is notorious for its potential to produce symptoms affecting multiple body systems — hence the saying “Stones/Bones plus Abdominal and Psychic Groans with Cardiac TonesAmong body systems that may be affected by significant hypercalcemia are GI (abdominal pain; nausea, vomiting; constipation) — Renal (kidney stones; inceased thirst; frequent urination) — Bones and muscles (bone pain; muscle weakness) — Cardiac (chest discomfort; palpitations from induced arrhythmias) — and Psychologic (depression or other psychologic disorders; lethargy; fatigue and/or confusion)THEREFORE: — Perhaps the ED presentation of “many complaints” was the patient’s genuine expression of multi-organ symptoms from the marked hypercalcemia! 


Monday, February 13, 2023

Two 70 year olds with chest pain, and 3 pitfalls of the STEMI paradigm

Written by Jesse McLaren


Two 70 year olds had acute chest pain with nausea and shortness of breath, and called paramedics. Who needs the cath lab?


(photocopy of prehospital ECGs digitized by PMcardio)


ECG #1 (top): there’s normal sinus rhythm, normal conduction, normal axis, normal R wave progression, and normal voltages. There’s inferior ST depression which is reciprocal to subtle lateral convex ST elevation, and the precordial T waves are subtly hyperacute – all concerning for STEMI(-)OMI of proximal LAD.


ECG # 2 (bottom): there’s sinus rhythm with normal conduction, normal axis, loss of R wave in V2, normal voltages. There’s ST elevation I/aVL/V2 that meet STEMI criteria. There’s also hyperacute T waves V2-4, ST depression inferiorly which is reciprocal to lateral ST elevation, and ST depression in V6 reciprocal to subtle ST elevation in V1 (swirl sign). This is obvious STEMI(+)OMI of proximal LAD.


This case illustrates three common pitfalls of the STEMI paradigm, which can be improved by OMI ECG findings:


1. STEMI on serial ECG, or OMI from the start?


According to the STEMI paradigm, ECG #1 is nondiagnostic whereas ECG #2 is STEMI. So the first patient doesn’t need emergent reperfusion whereas the second does. But these ECGs were from the same patient: #1 on paramedic arrival and #2 thirty minutes later. The patient's LAD was occluded from the start even though the first ECG didn’t manifest STEMI criteria.


I sent the first ECG to Dr. Meyers without any information, and he replied, “good one. OMI. Will be missed easily.” Indeed, in his study comparing accuracy of OMI vs STEMI findings, more than half of OMIs were STEMI negative but diagnostic of OMI, and could be identified a median of 1.5 hours earlier, and the two most common OMI ECG findings were "subtle STE not meeting STEMI criteria" and "reciprocal ST depression and/or reciprocal T wave inversion".[1] So even for true positive STEMIs, identifying OMI can help expedite reperfusion.


Thankfully this patient’s second ECG met STEMI criteria, so paramedics brought them as a code STEMI. This seems to validate the STEMI paradigm because serial ECGs arrived at the diagnosis. Looking at ECG #1 and 2 it could look like a simple case of evolving STEMI, even if the first is not recognized as LAD occlusion. But what if the second ECG hadn’t been recorded at that exact moment?


2. Non-STEMI or STEMI(-)OMI?


Three minutes later, paramedics recorded a third ECG. Below is ECG #1 and ECG #3:


ECG #3 no longer meets STEMI criteria, but is still diagnostic of proximal LAD occlusion (and shows subtle loss of R waves V2-4). If the patient only had these two ECGs recorded, it would have missed the transient time between them which were STEMI positive, and the patient would then have arrived at the ED as “serial ECGs STEMI negative." With an elevated troponin, ECGs like are often be misinterpreted as "inferior ST depression" and then labeled "non-STEMI", but ST depression doesn't localize and the inferior ST depression is reciprocal to subtle lateral ST elevation/hyperacute T waves. This puts OMI patients at risk for delayed reperfusion—like more than a quarter of “non-STEMIs” with totally occluded arteries, most of which can be identified by OMI signs.[2]  


Transient STEMI, or ongoing OMI?


If we look at ECG #2 and #3, another pitfall emerges: according to the STEMI paradigm, the patient had a “transient STEMI” because their ECG has gone from STEMI positive (#2) to STEMI negative (#3).   


According to the interpretation of some trials, patients with transient STEMI don’t need emergent reperfusion.[3] But ‘transient STEMI’ requires complete resolution of symptoms and ECG changes, and delaying cath lab for patients with spontaneous reperfusion puts them at risk for reocclusion.[4] But this patient hasn’t even spontaneously reperfused, because their ECG shows ongoing LAD occlusion even though it no longer meets STEMI criteria.


This routine case was a near miss, and shows three common pitfalls of the STEMI paradigm:

1.     ECG #1-2, from STEMI(-)OMI to STEMI(+)OMI: risk of delayed diagnosis of true positive STEMI, when diagnostic of OMI from the start

2.     ECG #1/3, STEMI(-)OMI: risk for false negative STEMI and admission as Non-STEMI, despite serial ECGs showing OMI

3.     ECG #2-3, from STEMI(+)OMI to STEMI(-)OMI: risk of delayed reperfusion for transient STEMI when there’s ongoing OMI


Two factors expedited reperfusion for this patient: ECG #2 met STEMI criteria so code STEMI was activated from the field, and even though STEMI criteria resolved the patient had a VF arrest on arrival, after which they were defibrillated and taken immediately to the cath lab. There was 100% proximal LAD occlusion, EF was 55% with severe hypokinesis to mid-distal septum and apex. First troponin I was 150 ng/L (normal <26 in males and <16 in females) and peak was 7,500.


Post-angiogram ECG showed proximal LAD reperfusion:


Take home

1.     OMI ECG findings can diagnose true positive STEMI earlier

2.     OMI ECG findings can diagnose false negative STEMI

3.     ‘transient STEMI' can have ongoing OMI


References

1.  Meyers et al. Accuracy of OMI findings versus STEMI criteria for diagnosis of acute coronary occlusion myocardial infarction. Int J Cardiol Heart Vasc 2021

2.  Aslanger et al. DIagnostic accuracy oF electrocardiogram for acute coronary OCClusion resulTing in myocardial infarction (DIFOCCULT study). Int J Cardiol Heart Vasc 2020

3. Lemkes et al. Timing of revascularization in patients with transient ST segment elevation myocardial infarction: a randomized clinical trial. Eur Heart J 2018

4. Bergmark et al. Transient ST-segment myocardial infarction: a new category of high risk acute coronary syndrome? Eur Heart J 2019


==================================
Comment by KEN GRAUER, MD (2/13/2023):
==================================
I love cases like this one! They convincingly demonstrate the futility of staying "stuck" in the outdated STEMI paradigm that delays treatment of a significant percentage of acute MI patients.

  • Today's patient is a 70-year old adult who called EMS because of new-onset chest pain, associated with nausea and shortness of breath. This clinical presentation alone immediately places this patient in a "high-prevalence" group for having an acute event even before you look at the ECG! As a result — even subtle ECG findings are likely to be acute until proven otherwise.

Dr. McLaren's excellent sequential presentation of today's case takes us through the course of this actively evolving STEMI. As commonly occurs — the "culprit" vessel may spontaneously reopen — only to reocclude — sometimes repeating this occlusion-reopening process a number of times until the final state of the "culprit" vessel is reached.
  • As per Dr. McLaren — today's patient was clearly in need of prompt cath as soon as the initial ECG was recorded. 
  • That said — the initial ECG alone may not have sufficed to make prompt cath happen, if it were not for the occurrence of 2 additional factors: i) A 2nd ECG recorded 30 minutes later, showed frank STEMI criteria; andii) The patient had VFib arrest on arrival to the ED.

  • In the hope of reinforcing Dr. McLaren's case for immediate cath in today's patient — I thought it worthwhile to take another look at the subtle-but-definitely-present ECG findings that were clearly evident in the initial tracing (Figure-1).

Figure-1: The initial ECG in today's case — recorded by the paramedics on arrival at the scene. (To improve visualization — I've digitized the original ECG using PMcardio).


Another Look at the Initial ECG:
To Emphasize — The patient in today's case is a 70-year old adult who presented with severe new-onset chest pain. As a result — even subtle ECG findings need to be considered acute until proven otherwise.
  • Given this clinical presentation — I like to start by asking myself IF there are any 1 or 2 leads that are definitely abnormal in a patient with severe new chest pain. In view of this clinical scenario — there is no way the coved and slightly elevated ST segment in lead aVL can be considered normal. (QUERY: Given the modest size of the QRS in lead aVL — Isn't the ST segment in lead aVL disproportionately elevated as well as abnormally shaped?).
  • Whether the QS in lead aVL is (or is not) an infarction Q wave — is hard to determine from this single tracing. 

  • Support that the coved and elevated ST segment in lead aVL is real — is forthcoming from the scooped ST depression in each of the inferior leads (with this "scooped" shape being a mirror-image opposite ST-T wave change to the appearance of the coved ST segment in lead aVL).

ST-T wave changes in the Chest Leads are more subtle — but given the context of new severe chest pain + ST elevation in aVL with reciprocal ST changes in the inferior leads — even subtle ECG abnormalities in the chest leads need to be considered real.
  • In the context of the above limb lead abnormalities — I thought the T waves in leads V3 and V4 appeared hyperacute — in that these T waves are fatter-at-their-peak and wider-at-their-base than expected (ie, hypervoluminous).
  • In this context — neighboring leads V2 and V5 are also suspicious (straightening of the ST segment takeoff in lead V2 — and a fatter T wave peak than expected in lead V5).
  • Finally — the T wave in lead V6 is clearly much flatter than it should be (When the QRS is upright in lead V6 — the T wave in this lead should be upright and larger than seen here).

In Conclusion: Millimeter-based STEMI criteria are not met in ECG #1. That said, in this patient with severe new chest pain — the overall ECG picture with ST-T wave abnormalities in 9/12 leads has to be considered (as stated by Dr. McLaren) — as "All concerning for acute LAD occlusion"


Recommended Resources