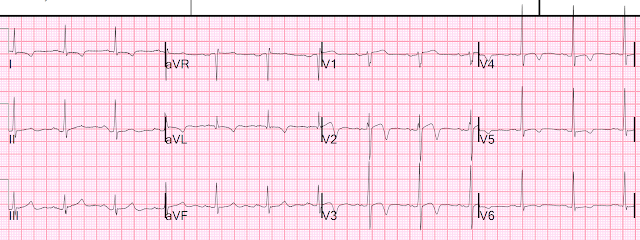
A 50-something male had onset of pain approximately 30 min prior to arrival and was still present on arrival. The pain was described as a pressure with radiation to his back. No nausea or SOB. No diaphoresis. He had never had this pain before.
Computer and physician read:
What do you think?
After looking, compare with the patient's previous ECG (next), and then see what you think.
There is ST Elevation in V2 and V3
Previous ECG from 3 months prior, during a visit for angioedema:
This ECG is normal, with a bit of normal ST elevation in V2 and V3
The first ECG above: ST Elevation, but not enough to meet STEMI criteria of 2 mm in both V2 and V3 (for a male over age 40).
There is also ST depression in II, III, aVF and V5, V6. There are large T-waves.
That first ECG, by itself, without comparing with the previous ECG, is diagnostic of acute LAD occlusion.
ST elevation is sometimes normal and sometimes not. How do you tell the difference? See more complete discussion below.
As for this first ECG:
Normal ST elevation NEVER has associated ST depression. This ECG has ST depression in inferior leads (it also has a touch of ST elevation in aVL) AND there is ST depression in V5 and V6. This is diagnostic of an acute LAD occlusion. Comparison with the previous ECG, which barely has any normal ST elevation, proves that this is New, and ischemic, ST Elevation.
Additionally: the T-waves are hyperacute! Compare with the patient's baseline T-waves.
These findings were not appreciated for variety of reasons. The triage physicians is particularly skilled at ECGs and did not see it. Of course the computer did not see it either.
Patient was given aspirin and the pain resolved.
A 2nd ECG was recorded:
Cath team was called. First (and only) high sensitivity troponin I returned at 53 ng/L.
Angiogram Results:
Culprit Lesion (s): 80% thrombotic stenosis in the mLAD. This was stented.
Subsequent ECGs:
This was at 66 minutes, 33 min after ECG 2:
After PCI at 3.5 hours:
Next day:
Formal Bubble Contrast Echocardiogram:
Normal left ventricular size and systolic function with an estimated EF of 60%.
Small regional wall motion abnormality--apical septal, mid anteroseptal, and apical anterior hypokinesis.
Comment: We don't have good evidence for infarct size (as troponins were not measured to peak), but since the duration of chest pain was very brief, the artery was probably only briefly occlusion, and this is probably a small infarct. Thus, the wall motion abnormality is probably transient ("myocardial stunning") and will recover within days to weeks.
Normal ST elevation in V2-V4 vs. Ischemic ST Elevation:
Normal STE:
--Has upward concavity in all of V2-V6.
--STE should not be more than 5 mm in any lead
--There should be no ST depression in inferior leads.
--There should be no ST depression in any precordial leads.
--There should not be any Q-waves in V2-V4.
--There should be no terminal QRS distortion in V2 or V3 (there must be either an S-wave or a J-wave -- J point notching -- in both leads)
T-waves may be tall, but should not be far taller than baseline
If any of these criteria are met, then the formula (see below) may be falsely negative.
Ischemic STE:
Even if all of the above are met, the STE may still be ischemic, due to LAD occlusion.
At this point, one can use the Formula for differentiating Normal STE from LAD Occlusion.
See this post for complete description of the formula:
12 Example Cases of Use of 3- and 4-variable formulas to differentiate normal STE from subtle LAD occlusion
What would have happened if we applied the formula to this case.
Computuerized QTc was 374 ms.
STE at 60 ms after the J point in lead V3 = 3.5
R-wave amplitude in V4 = 22
QRS amplitude in V2 = 10
Formula value = 15.76 This is a VERY low value and would turn out to be a false negative!!
The most accurate cutpoint is 18.2
17.0 is a very sensitive cutpoint
19.0 is a very specific cutpoint
Beware using the formula in ECGs that have Exclusions!!


another great teaching case... someday i'll get semi-comfortable with all of these..when i first saw the initial ecg, i thought "oh, steve is going to teach us again about the 4-variable formulas".. which you are, but much more.
ReplyDeletethank you again.
i also thought of hyperkalemia with that sharp T in V3...was that wrong?
thank you, Steve
It is never wrong to think about hyperK, and very easy to confirm or refute. But this is not the typical morphology of a hyperK peaked T.
DeleteThanks for another great blog post! A quick question relating to the ECG taken after aspirin and resolution of the pain: is it normal for the ST depression seen in II and aVF to stick around when the Wellens waves have started forming up in V2 and V3, or is that uncommon, or can it go either way? I don't remember typically seeing ST depression along with Wellen's waves in the examples that I've seen, but I may not have been looking at that so much as the "culprit" T-waves.
ReplyDeletevariable
DeleteGood to know. Thanks!
DeleteGreat post. It´s always rewarding to read your posts. Great teaching points. Thanks
ReplyDeleteH Munoz, MD Caracas. Vzla.
Glad you like it!
Delete