
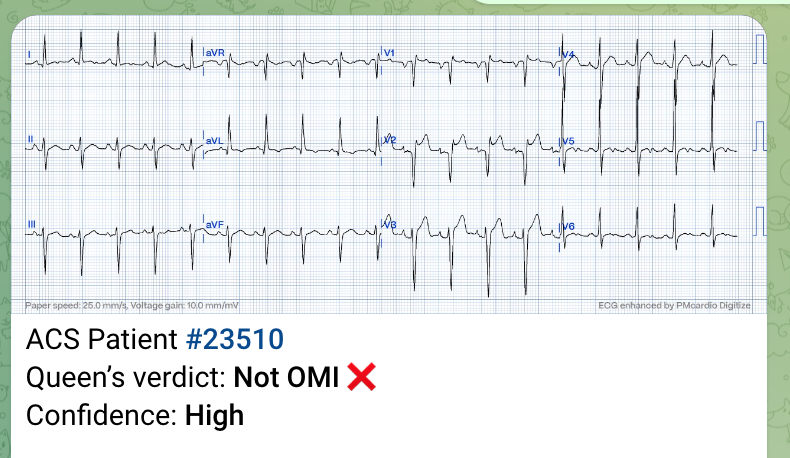
This ECG was texted to me with the implied question "Is this a STEMI?":

I responded that it is unlikely to be a STEMI.
Why?
1. There is a saddleback. I have only seen 2 Saddlebacks with LAD occlusion. Links to these two are below.
2. There is high voltage. It does not quite meet LVH criteria, but all I can say is that it has "the look"
3. The QS-wave in V2 is associated with a biphasic P-wave. This P-wave indicates that the leads were placed too high. When the V1, V2 leads are placed too high, a frequent result is a QS-wave in V2.
4. The QT is short. You can eyeball it at 280 ms. The computer measured it at 284, with a QTc (Hodges correction is used by our computer) of 352 ms. If the correction were Bazett, then it would be 393 ms, which is short for LAD occlusion (though by no means impossible).
5. Septal STEMI often has ST depression in V5, V6, reciprocal to V1.
Then I found out that the presentation is fever and headache in a 32 year old.
I suggested serial ECGs and troponins.
Serial ECGs were unchanged. 2 high sensitivity troponins were both = 4 ng/L (LoD less than 4). This rules out acute MI, both OMI and Non-OMI.
The Queen of Hearts knows this is a Mimic:
A Very Subtle LAD Occlusion....T-wave in V1??


Septal STEMI with lateral ST depression, then has collateral reperfusion resulting in Wellens' waves


===================================
MY Comment by KEN GRAUER, MD (10/28/2020):
===================================
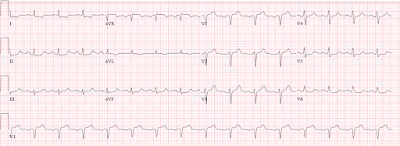
We are told that Dr. Smith was texted the ECG that I have reproduced in Figure-1. No clinical information was provided.
Please TAKE another LOOK at this ECG in Figure-1.
- What would YOU say IF this tracing was texted to you?

MY Thoughts on ECG #1:
I’d begin by systematically interpreting this tracing. My Descriptive Analysis of ECG #1 (looking sequentially at Rate – Rhythm – Intervals – Axis – Chamber Enlargement & QRST Changes) is as follows:
- The QRS complex is narrow. The Rhythm is regular and rapid. This is sinus tachycardia at a Rate of ~115/minute.
- All Intervals are normal (ie, the PR interval is not more than 1 large box in duration — the QRS is not more than half a large box — and the QTc is not prolonged, albeit more difficult to assess at this rapid a rate).
- The frontal plane Axis is markedly leftward. Since the QRS complex in lead II is clearly more negative than positive — the axis is more negative than -30 degrees (probably about -45 degrees) — which satisfies criteria for LAHB (Left Anterior HemiBlock).
Regarding Chamber Enlargement:
- There is a deep, negative component to the P wave in lead V1. This suggests that there may be LAA (Left Atrial Abnormality).
- Although the P wave is fairly prominent in lead II — it is not quite pointed, and not quite 2.5 mm tall — so I would not call RAA (Right Atrial Abnormality). That said — there appears to be subtle-but-real P wave notching in a surprising number of leads (ie, in leads II, III, aVR, aVF; and V2-thru-V6).
- IF the patient is an adult who is at least 35 years of age — then several voltage criteria for LVH would be satisfied: i) R in lead aVL ≥12 mm; ii) Cornell Criteria would be met, since the sum of the R in aVL + the S in V3 is ≥20 mm (for a woman) and/or >28 mm (for a man); and, iii) Peguero Criteria would be met, since the deepest S in any chest lead + the S in V4 is >23 mm (for a woman) and/or >28 mm (for a man).
- NOTE: For those wanting more on my approach to assessing LAA/RAA — CLICK HERE. For review of ECG criteria for LVH that I favor (including a user-friendly Table of LVH Voltage Criteria) — Please scroll down to the bottom of the page for My Comment in the June 20, 2020 post in Dr. Smith’s ECG Blog.
Regarding Q-R-S-T Wave Changes:
- Small and narrow (probably septal) Q waves are seen in high lateral leads I and aVL. In addition — there is an unusual Qr pattern (with a very deep and wide initial Q wave) in both leads V1 and V2.
- After the initial Qr pattern in leads V1 and V2 — the R wave progresses as we move across the precordial leads, albeit with slightly delayed transition (with the R wave becoming taller than the S wave is deep between V4-to-V5). S waves do persist in the chest leads through to lead V6.
- Regarding ST-T wave changes — there are several abnormal findings. These include: i) No less than 2-3 mm of ST elevation in lead V2, albeit with a saddleback (upward concavity) appearance; ii) At least 2 mm of J-point ST elevation in lead V3, with some ST segment straightening and a lesser amount of ST elevation in lead V4 (albeit slight PR depression in leads V3 and V4 makes assessing the amount of ST elevation more difficult); iii) There is also slight ST elevation in lead V1; iv) Shallow T wave inversion in lead aVL, that is potentially consistent with LV “strain”; and, v) Nonspecific ST-T wave abnormalities in inferior leads (ie, ST straightening/coving in leads II and aVF) — with a peculiar notching of what appears to be the terminal T wave in lateral leads I, V5, V6.
Clinical IMPRESSION of ECG #1: There are a lot of descriptive ECG findings on this tracing! As a result — we absolutely need some History in order to clinically interpret the numerous ECG findings noted above.
- IF the Question being raised is whether the cath lab should be activated because of the ST elevation that is most marked in lead V2 (but also seen in leads V1, V3 and V4) — then I agree with Dr. Smith, who indicates above how rare it is for the saddleback form of ST elevation to be associated with acute LAD occlusion. That said — IF the history was of an older patient presenting with worrisome new-onset chest pain — I would be less confident ruling out acute OMI on the basis of this single ECG.
- Looking closer — Although the shape of the ST-T wave in lead V2 (and to a lesser extent in lead V1) resembles that of a Brugada Type-2 or “Saddleback” pattern — the ß-angle is not wide enough to qualify as a Type-2 Brugada pattern. (For more on the “saddleback” shape and the various Brugada ECG patterns — Please SEE My Comment at the bottom of the page in the September 5, 2020 post of Dr. Smith’s ECG Blog).
- Dr. Smith raised the question of possible lead misplacement of the V1 and V2 electrodes (being placed too high on the chest) as the reason for the unusual Qr pattern seen in these leads. While certainly possible — I’m used to seeing an rSr’ (instead of a Qr pattern with such wide Q waves) — in association with negative P waves and negative T waves (that resemble the QRST appearance of lead aVR) — when leads V1 and V2 are placed too high on the chest. That said — a combination of LVH and the above noted saddleback pattern + misplacement of leads V1 and V2 could certainly cause the picture seen here. (For more on the ECG findings when leads V1 and V2 are placed too high on the chest — Please SEE My Comment at the bottom of the page in the November 4, 2018 post of Dr. Smith’s ECG Blog).
- NOTE: It would be EASY to determine if leads V1 and V2 were placed too high on the chest. Simply repeat the ECG after verifying correct lead placement. This is clinically relevant — because if leads V1 and V2 are properly placed, then we would have to explain the LAA and the 2 wide Q waves in these leads.
A number of other findings were noted above in ECG #1, that might suggest underlying structural heart disease if the clinical setting was “right”. These include:
- P wave notching in multiple leads (which might reflect an intra-atrial conduction defect, such as is commonly seen in patients with underlying heart disease).
- LVH (in which case the shallow T wave inversion in lead aVL might reflect LV strain).
- LAHB.
- ST-T wave abnormalities in multiple leads that could be ischemic.
FOLLOW-UP to Today’s Case: As per Dr. Smith — it turns out that the patient in today’s case was a 32-year old who presented to the ED with headache and fever. Serial ECGs were obtained — and we are told these were unchanged compared to ECG #1. Two high-sensitivity troponins were negative.
- Awareness of this History is essential to clinical interpretation of the ECG in this case. The negative troponins and lack of change on serial ECGs essentially rules out OMI.
- Increased QRS amplitude is much less likely to reflect true LV chamber enlargement given the young adult age of this patient. The P wave notching is less likely to be significant — and, one wonders how much of an effect the sinus tachycardia may be having on ST-T wave morphology.
- P.S. — The fact that serial ECGs were “unchanged” makes me question IF the health care providers recognized the possibility of lead V1,V2 misplacement?

Great learning case and discussions from both Steve and Ken. But I'm a bit confused. As I recall, Steve, did you not publish an article indicating that up to 40% of anterior infarctions could have elevated ST segments with upward concavities in the anteroseptal leads? How is this different? Is there a difference in the morphology of the ST segments or the location of the leads with the STE?
ReplyDeleteAlso, If this were a true OMI, then it would be very proximal and I would expect to see involvement of the basolateral area manifested by STE in aVL (and possibly Lead I as well) which is not present on this tracing.
Also, regarding the presence of ST depression in V5 and V6 (which is not present here): that can certainly be due to reciprocal changes to STE in V1 and V2, but it can also be due to disease in the other vessels supplying the lateral wall which would indicate an even worse pronosis.
I was impressed by the fact that the S waves in the right precordial leads were very prominent, the tachycardia (usually patients with MIs have normal or bradycardic rates due to parasympathetic stimulation), the "wrong" P wave morphology in V2, the lack of any STE in Lead aVL and no ST deviation in V5/V6.
And thanks for all the references to previous posts!
Jerry W. Jones, MD FACEP FAAEM
https://medicusofhouston
Jerry, thanks for the great comments. I'm not sure exactly what the question is. I have 2 studies that show that upward concavity is present in V2-V6 in almost half of LAD occlusions. If there is convexity in just one of those leads, then it is unlikely to be normal variant STE, but it may very well be LVH STE. This ECG does not look anything like normal variant, so that is not on the differential diagnosis. The differential here would be LVH with saddleback vs. saddleback alone vs. saddleback with STEMI. In that differential diagnosis I don't think upward concavity, or its absence, is terribly relevant.
ReplyDeleteDoes that answer?
Steve
Thanks for your reply Steve.
Delete"...upward concavity is present in V2-V6 in almost half of LAD occlusions. If there is convexity in just one of those leads, then it is unlikely to be normal variant STE..."
That answered my question. Thanks!
Great case sir. Doubt about there being what looks like prominent U wave in V5, V6? Also normal variant?
ReplyDeleteTHANKS for your comment. As per all of the findings that I mention above in My Comment — I don’t know that I would call this a “normal variant”. There are a number of ECG findings (that I note) which clearly are not “normal” — although possible that since the patient a younger adult, presumably without underlying heart disease — that the ECG findings I note above (which ARE there) are not of clinical significance.
DeleteAs to the possibility of U waves in leads V5,V6 — I did see this unusual notching, but felt it unlikely that these were U waves because I did not see anything suggestive of U waves elsewhere. In my experience — the leads in which I most often am able to identify U waves are leads II and V2, V3, V4. Given the timing of this notching — I attributed it to being a very unusual “notching effect” in the T wave. Serial ECGs in the minutes-to-hour-or-so following the time when ECG #1 was recorded, during which the patient’s medical condition improved (and the heart rate slowed) would probably be more revealing as to the true cause of this notching. THANKS again for your comments — :)
Thank you sir 👌😊
Delete