
===================================
MY Comment by KEN GRAUER, MD (8/17/2020):
===================================
The patient whose ECG is shown in Figure-1 is a 35-year old man, who presents with chest discomfort and palpitations over the past few days. He is hemodynamically stable.
- How would you interpret the 12-lead tracing — and especially the long lead II rhythm strip shown in Figure-1?
- Does this patient need a pacemaker?
- WHY are beats #2, 5, 8, 11 and 14 wide?
 |
| Figure-1: The initial ECG in this case — obtained from a 35-year old man with chest discomfort and palpitations over the past few days (See text). |
My THOUGHTS on ECG #1: This is a challenging ECG! I’ll offer a Step-by-Step Approach for assessing this tracing:
- Look first at the rhythm! Assessment of the rest of the 12-lead ECG is best deferred till after you’ve looked at the rhythm.
- A Systematic Approach is essential. The system I favor for arrhythmia interpretation is summarized in Figure-2.
- For clarity — I’ve numbered the beats in the long lead II of Figure-1. Did YOU notice the group beating? (ie, Beginning with beat #2 — Isn’t there a repetitive pattern of 3-beat groups, followed by a short pause?).
PEARL #1 — The presence of GROUP beating often means that some sort of Wenckebach phenomenon is present. There are many types of Wenckebach phenomena, of which AV Wenckebach (ie, the Mobitz Type I form of 2nd-degree AV block) is the most common.
- NOTE: This does not mean that every time you see group beating — that Mobitz I will be the cause. For example, atrial bigeminy or trigeminy will also produce “group” beating. That said — Recognition of group beating in this particular tracing did allow me within seconds to begin focusing attention on the strong possibility that AV Wenckebach might be present!
 |
| Figure-2: The system I favor for interpretation of any arrhythmia (See text). |
What Next Caught My Eye:
Beginning with beat #2 in ECG #1 — there are 4 groups of 3 beats each, with each group followed by a short pause. These 4 groups are made up of beats #2,3,4; beats #5,6,7; beats #8,9,10; and beats #11,12,13.
- The 1st beat in each group is wide — and looks very different than the other 2 beats in the group. Initially, I thought these wide beats (ie, beats #2, 5, 8, 11 and 14) were likely to be PVCs — but each of these beats is preceded by a P wave with a constant PR interval.
- Applying the principle of “simultaneous leads” — I looked at QRS morphology for each of these wide beats in the other 11 leads (within the BLUE-WHITE rectangles in Figure-3).
PEARL #2 — Isn’t QRS morphology for each of the wide beats in ECG #1 typical for LBBB conduction?
- With typical LBBB conduction — the QRS complex in lateral leads (especially in leads I and V6) should be entirely upright. Note the monophasic (all upright) QRS complex in lateral lead I for beat #5 of ECG #1 — as well as the all upright QRS in lateral lead V6 for beat #11.
- Typical LBBB conduction manifests predominantly negative QRS complexes in at least the first 3 (if not 4) anterior chest leads, with no more than a small, thin initial r wave. This is exactly what we see for beat #11 in leads V1, V2, V3 and V4 (within the BLUE-WHITE rectangles in Figure-3). The fact that the slope of the S wave descent in these anterior leads is so very steep (ie, rapid) — is highly characteristic of supraventricular conduction from LBBB.
- Given the typical LBBB morphology for each of the wide beats (ie, beats #2, 5, 8, 11 and 14) — and the fact that each of these beats is preceded by a P wave with a constant PR interval — strongly suggests that these beats are all conducted!
 |
| Figure-3: Using the principle of “simultaneous leads” to assess QRS morphology for each of the wide beats in ECG #1 (See text). |
PEARL #3 — Label the P waves. Using calipers facilitates this task — by allowing you to “walk out” where to look for each next P wave (Figure-4). Isn’t it now obvious that the underlying atrial rhythm is regular?
- NOTE: There may be slight variation in the P-P interval in Figure-4. This is common — and is most often due to some underlying sinus arrhythmia. But it should be obvious looking at the pattern of the RED arrows in this tracing — that the underlying rhythm is sinus.
- P.S.: The tracing in Figure-4 is technically imperfect due to slight angulation, resulting from this picture being taken by a cell phone. This technical defect does not prevent interpretation of the rhythm — but it does introduce some additional variation in the P-P interval.
 |
| Figure-4: I’ve added RED arrows to indicate P waves in the long lead II rhythm strip (See text). |
PEARL #4: At this point — I strongly suspected the diagnosis of this arrhythmia. Recognition of the clues I list below allowed me to do so within 15-to-20 seconds:
- Recognition of group beating — with consistent repetition of an identical pattern of 3-beat groups, separated by a brief pause.
- Identification of a regular (or in this case, almost completely regular) underlying sinus rhythm (RED arrows in Figure-4).
- Noting that the QRS complex is narrow for most beats in the tracing — and, recognition of the very typical LBBB conduction pattern for each of the 5 wide beats (Figure-3) — which taken together, strongly suggests all beats in this tracing are conducted.
- Noting from the RED arrows in Figure-4 — that each QRS complex is preceded by a P wave — and, that the on-time P wave that appears at the onset of each brief pause is not followed by a QRS complex.
- Noting that the PR interval within each group of beats progressively increases — until a beat is dropped (ie, the P wave that appears after beats #1, 4, 7, 10 and 13 is not conducted).
- Noting that the PR interval then shortens before the 1st beat of each next group (ie, the shortest PR intervals precede beats #2, 5, 8, 11 and 14).
- Putting These Clues Together — the rhythm in Figure-4 is 2nd-degree AV block, Mobitz Type I (ie, AV Wenckebach).
PEARL #5 — What made this tracing especially challenging was accounting for WHY the QRS complex of beats #2, 5, 8, 11 and 14 is wide. These beats all conduct with LBBB aberration. But unlike the overwhelming majority of aberrantly-conducted beats — it is bradycardia rather than tachycardia that precipitates aberrant conduction. This is contrary to what one would anticipate — since improved conduction (not BBB) is normally expected following a longer preceding R-R interval.
- The mechanism of this paradoxical form of bradycardia-dependent BBB (sometimes called “Phase 4” block) has been described by Marriott. The mechanism is complex (Marriott HJL, Boudreau Conover MH: Advanced Concepts in Arrhythmias, Mosby, St. Louis, 1983, pp 164-166). Suffice it to say that this form of bradycardia-dependent aberrant conduction is not common — and that when it does occur, it is usually associated with underlying heart disease.
Looking at the Rest of the 12-Lead:
Return to Figure-3. Now that you’ve assessed the rhythm — HOW would you interpret the rest of the 12-lead ECG?
- To interpret this tracing, we need to separate narrow QRS complexes from the 5 wide beats that conduct with bradycardic-dependent LBBB.
- Looking at the narrow beats in Figure-3 — the QTc interval and the frontal plane axis look normal. Voltage criteria for LVH appear to be met (ie, there is overlap of QRS complexes in several of the chest leads — with what comes out to a sum >35mm for deepest S wave in V1,V2 + tallest R wave in V5,V6). Transition occurs slightly early, with a prominent (9mm) R wave already formed by lead V2. There are some nonspecific ST-T wave abnormalities — but nothing that looks acute.
Clinical IMPRESSION of ECG #1: This tracing was obtained from a 35-year old man who presented with chest discomfort and palpitations over the past few days. We were not told more about his previous or present medical history.
- The cardiac rhythm is abnormal. There is 2nd-degree AV block, Mobitz Type I, with 4:3 AV conduction and an appropriate overall ventricular response of at least 80/minute.
- There is bradycardic-dependent LBBB aberration — which as noted in Pearl #5, is most often associated with underlying heart disease.
- There is voltage for LVH + surprisingly tall R waves occurring as early as V2-to-V3. The very deep anterior S waves in the wide beats that conduct with LBBB (ie, >35mm in lead V2 for beats 11 and 14) is another sign suggestive of LVH.
- CONCLUSION: Mobitz I with an overall appropriate ventricular response is not an indication for pacing. But there are a number of signs suggesting this patient may have underlying heart disease — so despite this patient’s young age (35) — additional evaluation is indicated (ie, at the least an Echo, 24-hour Holter monitoring, lab, perhaps other tests).
=================================
SUGGESTION for Viewing the Laddergrams that Follow:
IF you did not recognize that the rhythm in Figure-4 is 2nd-degree AV block, Mobitz Type I — stepwise construction of a laddergram should clarify this interpretation.
- What follows is sequential construction of a laddergram.
- For the next 6 Figures — you’ll note that these laddergrams superimpose one on another. Optimal viewing will be on a computer.
- CLICK on Figure-5 to enlarge it. Then click the Forward Arrow on the keyboard of your computer for sequential development of the laddergram. The newest addition to each step is in BLUE. Legends explain my thought process. Regardless of your prior experience using laddergrams — I bet you’ll have a much better understanding of what is going on after sequential viewing of these next 6 Figures!
Beginning with Figure-5:
 |
| Figure-5: It’s easiest to begin construction of a laddergram by filling out atrial activity. RED vertical lines in the Atrial Tier correspond to P waves (RED arrows) in the long lead II rhythm strip. |
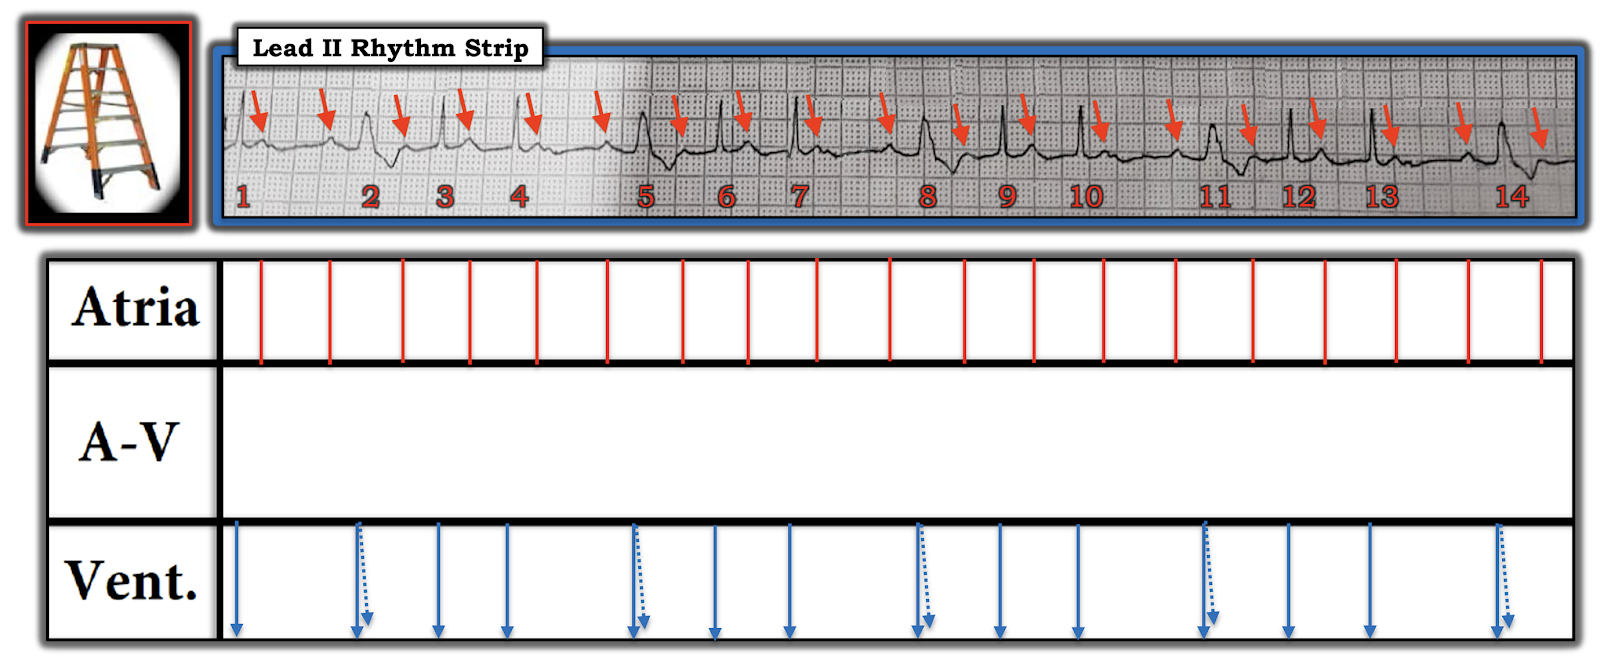 |
| Figure-6: Next — I’ve filled in the Ventricular Tier with BLUE arrows that correspond to each of the QRS complexes in the tracing. I’ve added a dotted BLUE arrow to the 5 beats with LBBB conduction. |
 |
| Figure-7: It’s time to start filling in the AV Nodal Tier. It’s easiest to start with those narrow beats that you know are conducted. |
 |
| Figure-8: The on-time P waves after beats #1, 4, 7, 10 and 13 (that occur near the onset of each pause) are not conducted (BLUE butt ends in the AV Nodal Tier — showing that conduction of the impulse does not reach the ventricles). |
 |
| Figure-9: This leaves us with connecting the remaining P waves and QRS complexes (slanted BLUE lines).NOTE: Starting with the 1st conducted beat in each group (BLUE lines) — there is an increase in the amount of slanting, that corresponds to progressive increase in the PR interval until a beat is dropped. This is AV Wenckebach. |
 |
| Figure-10: Finished laddergram. |
For Additional Practice with Step-by-Step Laddergrams:
- SEE My Comment in the May 16, 2020 post on Dr. Smith’s ECG Blog.
- SEE My Comment in the May 28, 2019 post.
- For those of you who would like a Video Review of the Basics of AV Block — Please CLICK HERE. And, if you click on SHOW MORE (under the video on the You-Tube page) — you’ll find a detailed linked Contents that will allow you to jump to whichever part on AV Blocks you are interested in.
================
- NOTE: My sincere THANKS to Dr. Gaurav Pandey (of India) for sharing the tracings and this case with us!
================
A good example of bradycardia dependent LBBB in a patient with 4:3 AV Wenckebach phenomenon.
ReplyDeleteK. Wang.
Thanks K! — :)
DeleteThanks. Good that this is not common.
ReplyDeleteThank you Polly. I would emphasize that although the mechanism of this particular rhythm IS advanced — there are many aspects of today’s case that should be of benefit for ANY level ECG interpreter. I find that even when I see a challenging arrhythmia — if I fail to use a Systematic Approach (outlined in Figure-2) — then I still MISS important findings. And as in the KEY POINTS about this System (Fig. 2) — I’m always amazed at how the simple step of finding and labeling P waves can be so tremendously helpful for getting a quick idea as to what is probably going on. Remembering that group beating is often (albeit not always) a sign of Wenckebach conduction also helps. And the KEY in this case — is that even though it looks strange for the 1st beat in each group (ie, beats #2, 5, 8, 11 and 14) to be wide — the PR interval preceding each of these beats is THE SAME (best seen in Figure-4, in which all P waves have been labeled). THANKS again for your comment! — :)
DeleteAn outstanding ECG with an outstanding break down of its mechanism !
ReplyDeleteTHANK YOU Ken! — :)
Delete