
This comment on this case is from Jerry Jones, and is so good that I am pasting it at the top of this post so everyone can read it:
"When the problem is just sinus bradycardia, the cause is typically increased parasympathetic input that moves the sinus pacemaker from the upper SA node to the lower SA node ("lower is slower"). If the SA node becomes ischemic because the artery to the SA node has been compromised, you are more likely to see instances of sinus pauses, SA blocks, SA arrest or atrial fibrillation. The RCA provides the artery to the SA node (which is essentially the blood supply for the ENTIRE right atrium) 55% of the time and the LCx provides the artery 45% of the time - and this has nothing to do with dominance! A non-dominant LCx may provide the artery to the SA node."
"The AV node on the other hand is not as responsive to parasympathetic forces as the SA node: though the upper AV node is certainly affected, autonomic neural influence is reduced significantly by the level of the lower AV node. So the effect on the AV node during an ongoing inferior MI, when due to ischemia of the artery to the AV node - often results in 3rd degree AV block (though usually temporarily). First degree AV block and Mobitz I block (aka Wenckebach conduction) are usually parasympathetically-mediated via the upper node to mid-AV node (when the change is acute). Mobitz II block does not occur in the AV node (as you know) and is due to an LAD occlusion."
References:
This case is from one of our fantastic 3rd year residents, Aaron Robinson.
"When the problem is just sinus bradycardia, the cause is typically increased parasympathetic input that moves the sinus pacemaker from the upper SA node to the lower SA node ("lower is slower"). If the SA node becomes ischemic because the artery to the SA node has been compromised, you are more likely to see instances of sinus pauses, SA blocks, SA arrest or atrial fibrillation. The RCA provides the artery to the SA node (which is essentially the blood supply for the ENTIRE right atrium) 55% of the time and the LCx provides the artery 45% of the time - and this has nothing to do with dominance! A non-dominant LCx may provide the artery to the SA node."
"The AV node on the other hand is not as responsive to parasympathetic forces as the SA node: though the upper AV node is certainly affected, autonomic neural influence is reduced significantly by the level of the lower AV node. So the effect on the AV node during an ongoing inferior MI, when due to ischemia of the artery to the AV node - often results in 3rd degree AV block (though usually temporarily). First degree AV block and Mobitz I block (aka Wenckebach conduction) are usually parasympathetically-mediated via the upper node to mid-AV node (when the change is acute). Mobitz II block does not occur in the AV node (as you know) and is due to an LAD occlusion."
References:
1. The Anatomy and Physiology of the Sinoatrial Node—A Contemporary Review
OLIVER MONFREDI, M.B.CH.B.,* HALINA DOBRZYNSKI, PH.D.,* TAPAS MONDAL, M.D.,†
MARK R. BOYETT, PH.D.,* and GWILYM M. MORRIS, BM.B.CH.*
PACE, Vol.33 November 2010
2. PAUL MARTIN, The Influence of the Parasympathetic Nervous System on Atrioventricular Conduction
Circulation Research, VOL.41 NO. 5, NOVEMBER 1977
3. Wit, Wellens, Josephson, Electrophysiological Foundations of Cardiac Arrhythmias, Cardiotext Publishing, 2017
4. I've also attached a coronary anatomy article whose reference I have lost.
This case is from one of our fantastic 3rd year residents, Aaron Robinson.
A woman in her 60s with Syncope
A woman in her 60s presented to a facility with syncope.
She had a history of CHF, pulmonary hypertension, CAD s/p CABG, and ESRD on hemodialysis. She had a dialysis run the day prior.
Prehospital VS were: BP 115/70, HR 65, RR 12. The patient did not have a 12 lead completed pre-hospital.
She arrived at the ED awake, alert, and complaining only of mild chest discomfort.
A 12 lead ECG was immediately completed:
 |
| Aaron showed this to me and this is what I said: Suggestive of inferior posterior MI, but not diagnostic. There is sinus rhythm (with one aberrant beat, #2, which might be artifact) There is T-wave inversion in aVL, which is a soft sign of inferior MI. There is a bit of downsloping STD in V2 suggestive of a posterior MI. But nothing diagnostic. |
Clinical Course
Bedside echo demonstrated no pericardial effusion, no b-lines, but a dilated RV with septal bowing, so PE was on the differential. However, review of records showed that she had a history of pulmonary hypertension and a large RV on previous echos.
--Lactate 9.0. K was normal.
--Initial high sensitivity troponin (assay unknown) returned elevated at 174 ng/L (roughly equivalent to 0.174 ng/mL in contemporary assay).
Suddenly, the patient developed severe shortness of breath and chest pain.
There was bradycardia with a narrow QRS on the monitor.
She was given 1 mg of atropine and pacer pads were placed.
A second 12 lead ECG was completed (EKG 2).
 |
| The grouped beating was seen; nevertheless it was thought to be complete AV block. When it was shown to Dr. Smith, this is what he said: There is grouped beating, which is typical for Wenckebach. Complete AV block will have a junctional or ventricular escape that is regular, not grouped There is a very long PR interval, but it seems to conduct. The next one is longer. The next one drops. So this is Wenckebach but with the shortest PR interval over 400 ms! See Ken Grauer's detailed analysis below. There is a slightly hyperacute T-wave in III with a reciprocal inverted hyperacute T-wave in aVL. Now it is even more suspicious for inferior MI. |
Is it important whether it is complete AV block or Wenckebach? Yes.
Because Wenckebach is likely to respond to atropine, whereas complete AV block is unlikely to respond.
Because Wenckebach is likely to respond to atropine, whereas complete AV block is unlikely to respond.
(Complete AV block might respond to atropine when there is a narrow QRS, as this indicates that the block is above the bundle of His; when the QRS is wide, atropine will not work).
Wenckebach is usually a benign rhythm. However, this is an extreme case of Wenckebach, and associated with syncope and shock. So one must be ready to treat like complete AV block with chronotropic meds such as dobutamine, or pacing, if necessary.
So making the correct rhythm diagnosis does help you know that atropine may work, and it is worth giving a large dose.
1 mg of atropine may not be enough, and one may give up to 3 mg of atropine.
1 mg was given and it is unclear to me (Smith) what immediate effect it had.
Clinical course continued:
The provider interpreted the etiology of her syncope as heart block. She flipped in and out of the block but was hypotensive with systolics in the 60s when she was in the block.
Due to instability, she was intubated and pacing was on standby.
The rhythm stabilized without any other intervention than that one dose of atropine.
She was transferred to a tertiary care center via helicopter. She was stable on transfer.
At the tertiary care center, her troponin peaked at 0.25 ng/mL (approximately equal to 250 ng/L) and she underwent cardiac catheterization.
Angiogram
Her graft LAD and native circumflex were both stented.
TIMI flow was not mentioned.
A post-cath EKG was obtained (EKG 3).
TIMI flow was not mentioned.
A post-cath EKG was obtained (EKG 3).
 |
| Dr. Smith's interpretation: Sinus rhythm with normal PR interval and no AV block of any kind. T-wave in III has normalized. T-wave in aVL remains inverted, but is not hyperacute. This confirms that the findings on the previous ECGs were indeed ischemic. |
She recovered completely.
Echo showed EF of 50-55% and no wall motion abnormality was mentioned. It is likely that the MI was so small that, if there was a WMA, it recovered with restoration of perfusion.
Learning Points:
1. Complete AV block has a regular escape, not grouped beating.
2. When AV block is Wenckebach, and the QRS is narrow, there is a good chance that atropine will work. Try a high dose, up to 3 mg.
3. If atropine does not work, dobutamine is a good choice to try to incread the heart rate.
4. Pacing if those don't work, either transcutaneous or transvenous.
3. If atropine does not work, dobutamine is a good choice to try to incread the heart rate.
4. Pacing if those don't work, either transcutaneous or transvenous.
5. Regarding shock management in ESRD patient: she had profoundly difficult access. The physician was able to place an ultrasound guided IV but she did not have good vessels to start.
6. For RSI, they chose to utilize her dialysis access, which was a subclavian dual lumen line. It worked very well. Don't forget you can utilize dialysis access ports in critical situations.
===================================
MY Comment by KEN GRAUER, MD (5/16/2020):
===================================
Dr. Smith sent me the ECG in Figure-1, and asked me to interpret it without the benefit of clinical information.
- If YOU were given the ECG in Figure-1 without the benefit of any clinical information — HOW would YOU interpret it?
- Would YOU think there is AV Block? — and/or Something Else?
- P.S. — I later learned that this case was provided by Dr. Aaron Robinson — one of Dr. Smith’s superb 3rd-year residents. Dr. Robinson DID provide the missing clinical information that I was not aware of at the time I wrote up my interpretation, complete with laddergrams using the 2nd ECG that Dr. Robinson showed above. For those of YOU who are interested in the interpretation of AV Blocks — PLEASE WORK THROUGH my detailed step-by-step analysis below.
- P.P.S. — Since the issues of using Atropine and distinguishing between partial vs complete AV Block came up in Aaron’s discussion — I have added an ADDENDUM at the very bottom of My Comment below.
- FINALLY — For those of you who would like a Video Review of the Basics of AV Block — Please CLICK HERE. And, if you click on SHOW MORE (under the video on the You-Tube page) — you’ll find a detailed linked Contents that will allow you to jump to whichever part on AV Blocks you are interested in.
 |
| Figure-1: I was asked to interpret this ECG. No clinical information was provided to me. (This is the 2nd ECG that was shown above in Aaron's case presentation). |
This is a Difficult Tracing to Interpret: There are a number of reasons why the ECG in Figure-1 is not an easy tracing to interpret. These include:
- No history is given.
- ECG findings are subtle (!) — for both the cardiac rhythm, as well as for what’s going on in the 12-lead ECG.
- QRS complexes and P waves are very small. And because of the bradycardia — there are only 6 beats on the entire tracing.
- There are technical issues that hinder interpretation. These include: i) that the tracing is slanted and folded (thereby rendering it difficult to make the precise measurements desired when assessing a complex arrhythmia); and, ii) there is baseline artifact that further complicates identifying P waves.
- Some thinking “out-of-the-box” is needed to interpret this tracing.
- In addition to calipers — I needed a laddergram to confirm my suspected diagnosis. (I’d estimate that 98-99% of the time, I do not need a laddergram to confirm my suspected rhythm diagnosis — but this was one case in which I did ...)
My STEP-by-STEP Approach to ECG #1: Despite the above challenges — an accurate interpretation of ECG #1 is possible — and can be accomplished in no more than a few brief moments. What follows is my STEP-by-STEP approach to assessing ECG #1, as it appears in Figure-1:
- I find it BEST to always begin my assessment of any ECG by at-the-least, a brief look at the rhythm. The 1st thing I noted in Figure-1 is the presence of GROUP beating (ie, alternating long-short intervals for the 6 beats on the tracing).
- PEARL #1 — The presence of group beating usually means that some sort of Wenckebach phenomenon is present. When there are P waves and a narrow QRS complex (as is seen in Figure-1) — this most often will be the result of AV Wenckebach (ie, Mobitz Type I, 2nd-degree AV block).
- PEARL #2 — AV Wenckebach is commonly seen in association with new or recent inferior MI. As a result — whenever I suspect the presence of AV Wenckebach, I always immediately look very closely at the 12-lead for even the slightest suggestion of recent or acute inferior MI.
- IF I am able to identify probable recent or acute inferior MI in a tracing in which there is group beating — then the diagnosis of some form of AV Wenckebach is almost assured. The main issue then becomes figuring out HOW to prove this.
Looking at the ECG in Figure-1 for signs of Inferior MI: Despite not knowing the history — there is strong suggestion of subtle recent (or acute) infero-postero MI:
- There is bradycardia (which is very common with acute inferior MI).
- The T waves in leads III and aVF appear to be hyperacute (ie, more-peaked-than-they-should-be, given small amplitude of the QRS complex in these leads).
- Opposite to lead III — there is mirror-image reciprocal ST-T wave depression in lead aVL, as well as in lead I.
- The ST-T wave in lead V2 is not normal (ie, the T wave in V2 is biphasic). In the setting of subtle recent inferior MI — this suggests probable posterior involvement. (Unfortunately, artifact mars our impression of events in lead V3).
- Taken Together — the above findings should suggest recent infero-postero MI until you prove otherwise! This adds further support to the likelihood that the group beating represents some form of AV Wenckebach.
 |
| Figure-2: I’ve added RED arrows over deflections that I am certain represent P waves. WHITE arrows indicate T waves in which additional P waves may be hiding (See text). |
Figure-2 — Looking Closer at the Rhythm: Now “armed” with the knowledge that the group beating we identified in Figure-1 is probably the result of some form of AV Wenckebach — I looked closer in my attempt to identify all P waves:
- As noted earlier — the small size of P waves ( + technical imperfections in the quality of this tracing) make it difficult to be certain about some of the atrial activity. In Figure-2 — I added RED arrows over those deflections I was certain were P waves.
- Using CALIPERS (which are an essential tool for assessing any complex arrhythmia) — it would make sense for P waves to also be present at the places where I highlighted with WHITE arrows in Figure-2. That’s because a slight sinus arrhythmia is far more likely to be the underlying rhythm, than some unusual form of sinus node exit block. Looking closely — there is slight increase in the amplitude of the T waves of beats #3 and 5, compared to the amplitude of other T waves (as well as subtle suggestion of notching in the terminal part of the T wave of beat #5). This strongly suggests that all of the arrows I drew highlight underlying sinus P waves (shown as RED arrows in Figure-3).
 |
| Figure-3: Although difficult to prove in this technically flawed tracing — Common things are common! — and, it makes the most sense for there to be P waves under each of the RED arrows that I’ve drawn in Figure-3. This would make the underlying rhythm = sinus arrhythmia. |
Drawing the Laddergram: Now that all P waves have been identified — I was ready to begin drawing the laddergram. NOTE: Learning to draw laddergrams is challenging (and this does require some time and effort). That said — Learning to READ Laddergrams that have already been drawn for you is EASY! But even IF laddergrams are completely new to you — I suspect you'll be much more comfortable looking at them after reviewing the next 7 Figures — beginning with Figure-4!
- NOTE: For those wanting a brief “Primer” on how to draw laddergrams — CLICK HERE. If you prefer a video review on laddergram basics — CLICK HERE.
- For a few additional cases that illustrate HOW to use laddergrams — CLICK HERE — and HERE —
Beginning with Figure-4: I love using Power Point to draw my laddergrams. It is easy with this application to duplicate similar elements (such as connected arrows or lines) — and, it is easy with Power Point to time-efficiently drop vertical line or arrow elements to any of the tiers in the laddergram.
- 3 Tiers are most often used to construct laddergrams. Conduction of the electrical impulse is normally rapid through the Atrial and Ventricular Tiers — which is why unless there is bundle branch block, vertical (or almost vertical) lines can usually be drawn.
- Conduction is typically slowest through the AV Nodal Tier — which is why lines passing through this tier are the most angled.
- PEARL #3 — The most challenging Tier to draw is almost always the AV Nodal Tier. As a result — Save the AV Nodal Tier for last when drawing your laddergram!
 |
| Figure-4: The dotted BLUE arrow shows construction of the 1st P wave as a vertical line in the Atrial Tier. Simply follow the legends sequentially for the next 6 Figures as the laddergram is constructed. |
 |
| Figure-5: Vertical RED lines have now been drawn in for all P waves on this tracing. |
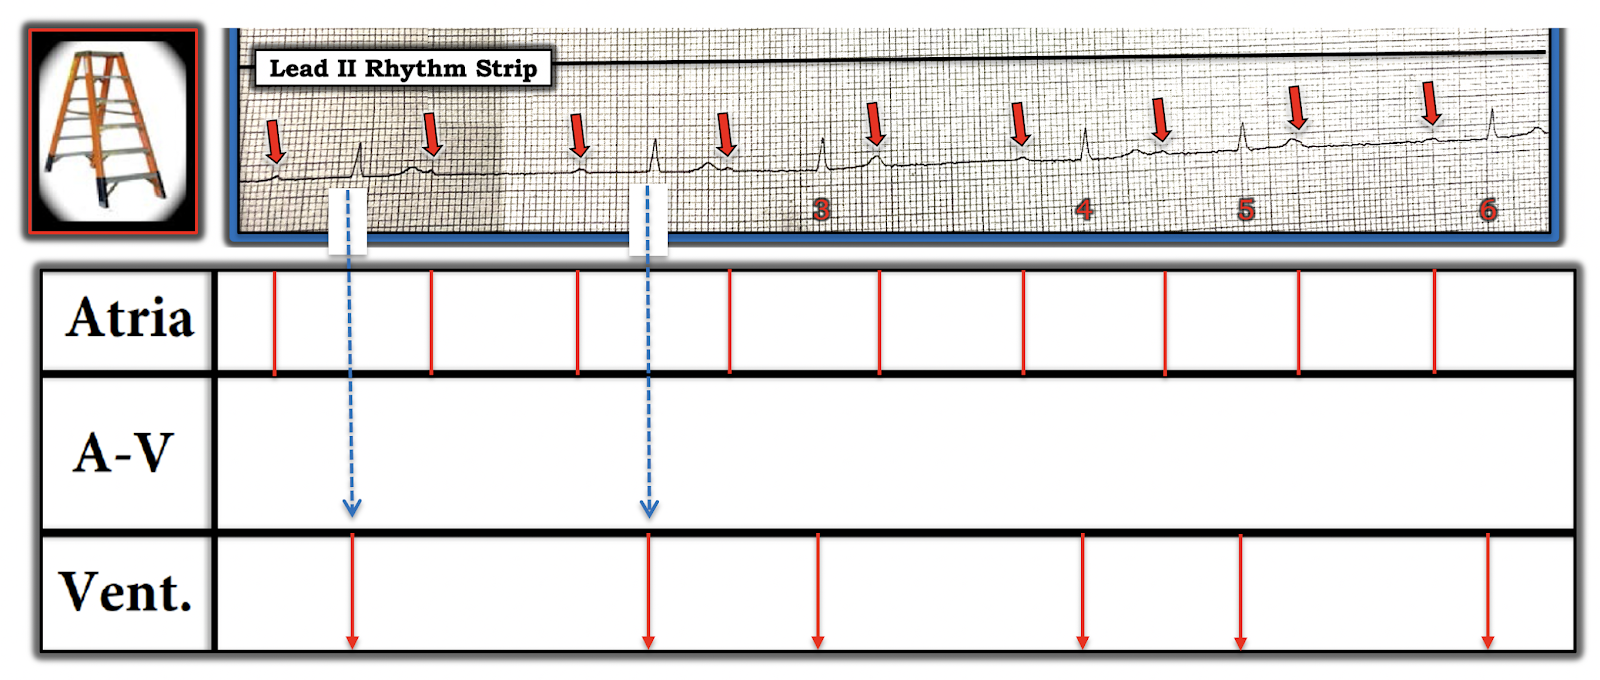 |
Figure-6: The dotted BLUE arrow shows construction of near vertical RED arrows in the Ventricular Tier for each of the 6 QRS complexes.
|
 |
| Figure-7: The easiest way to begin construction of the AV Nodal Tier — is to identify those beats that you KNOW are being conducted — because the PR interval preceding each of these conducted beats is the same (slanted BLUE lines in the AV Nodal Tier of Figure-7). |
 |
| Figure-8: It makes sense for us to then postulate that the 2nd beat in the two 3-beat groups is also being conducted, albeit with an even greater PR interval than was seen for the 1st beat in each group (slanted BLUE lines in Figure-8). |
 |
| Figure-9: It follows that the P wave near the beginning of the short pause (ie, the P wave after beat #1) is not conducted (BLUE butt end in the AV Nodal Tier of Figure-9, showing that conduction of the impulse does not reach the ventricles). |
 |
Figure-10: Completion of the laddergram! BOTTOM Line: The rhythm is sinus bradycardia with arrhythmia, in which there is 1st-degree AV block of all conducted beats + 2nd-degree AV block, Mobitz Type I, with 3:2 and 2:1 AV conduction. NOTE: The reason this example of AV block is unusual — is because of the very long PR interval (at least 460 msec) for the 1st conducted beat in each group — with an even longer PR interval (over 600 msec) for the 2nd conducted beat in the groups with 3 P waves.
|
ADDENDUM: I am writing this Addendum to address questions surrounding the use of Atropine — and HOW to distinguish between complete ( = 3rd-degree) AV block vs various forms of 2nd-degree AV block in a matter of seconds!
- Most of the time IF the degree of AV block is complete (ie, 3rd-degree) — then the ventricular rhythm should be at least fairly regular. This is because escape rhythms arising from the AV node, the His or ventricles are usually fairly regular rhythms. Exceptions may occur (exceptions being more likely during cardiopulmonary resuscitation) — but even during resusciation, there will usually be a recognizable pattern of ventricular regularity.
- PEARL #4 — IF the ventricular rhythm in a tracing with AV block is not regular (or almost regular) — then it is likely that at least some conduction is occurring (ie, rather than 3rd-degree — there is probably high-grade 2nd-degree AV block). Awareness of this PEARL has been invaluable to me over the years, in allowing me to tell within seconds (!) of looking at any tracing whether complete AV block is likely. Thus, for my Figure-1 above — I immediately knew this was not complete AV block because there was no semblance of regularity in the ventricular rhythm.
- PEARL #5 — The other way we can instantly KNOW that the rhythm in my Figure-1 (above) is not complete AV block — is that the PR interval preceding beats #1, 2, 4 and 6 is the SAME! This is precisely why I was able to draw in those slanted BLUE lines in my Figure-7 for the laddergram (See above).
- PEARL #6 — When looking at a complex form of AV block that is almost regular — but which manifests one or more beats that clearly occur much earlier-than-expected — it’s good to know that the reason some beats are occurring earlier-than-expected, is that these earlier beats are probably being conducted.
- PEARL #7 — As per my Figure-10 (above) — the PR interval for the 2nd conducted beat in each 3-beat group was still conducting, despite being over 600 msec! This raises the commonly-asked question, as to HOW LONG the PR interval can be and still conduct? The ANSWER is = VERY long! I have seen cases in which a PR interval is greater than 1.0 second (ie, >1000 msec) — and still is able to conduct!
PEARL #8 — is “My Take” on, “WHEN should Atropine be used?"
- Atropine is not benign. Especially in the setting of acute ischemia or infarction — resultant acceleration of the sinus rate may prove deleterious by increasing myocardial oxygen demand (which may precipitate tachyarrhythmias, including VT!).
- Atropine works best for treating bradycardia due to increased vagal tone (and vagal tone tends to be increased especially during the early hours of acute inferior infarction).
- Atropine is not advised to treat bradycardia/AV block in a patient with acute inferior MI — IF he/she is asymptomatic, with a heart rate of ~50/minute and a seemingly stable BP of ~80-90 mm Hg (Cautious infusion of IV fluids may help; bradycardia might be short-lived).
- On the other hand — Atropine is advised IF a patient with acute inferior MI is symptomatic (ie, with chest pain, dyspnea, hypotension). Sometimes “Ya just gotta be there” (at the bedside) — to determine IF a patient with a rate of 40-50/minute and/or BP ~80-90 mm Hg systolic, is in need of immediate treatment vs simple awareness and treatment “readiness” (including standby pacing).
- Atropine works by a parasympatholytic effect that increases the rate of SA node firing — as well as improving conduction through the AV node. Since the usual site of AV Wenckebach is at the AV node — Atropine is often effective (especially during the early hours of acute inferior MI). In contrast, since the level of block in Mobitz Type II is usually situated below the AV node — Atropine is unlikely to work with Mobitz II.
- Patients with acute inferior MI and resultant increased parasympathetic tone — sometimes manifest step-wise progression from 1st-degree AV block — to 2nd-degree AV block, Mobitz Type I ( = AV Wenckebach) — and then to 3rd-degree (complete) AV block. As a result — even 3rd-degree AV block that occurs in the early hours of acute inferior MI may reflect increased parasympathetic tone, and therefore respond to Atropine (sometimes at lower doses). In contrast — complete AV block with QRS widening is much less likely to reflect an AV nodal problem that might respond to Atropine.
- Atropine may be problematic with ischemic-induced AV block, because of increased myocardial demand that resultant tachycardia may produce.
- Each patient may respond differently to Atropine! (ie, individualize your treatment!).
- The recommended dose of Atropine = 0.5-1.0 mg IV (or IO) — which may be repeated in 3-5 minutes (up to a total dose of ~3 mg). IF used to treat asystole of brief duration that is thought to result from increased vagotonia — then a higher initial dose should be used (ie, 1 mg IV or IO — repeated in 1-3 minutes, up to a total of 3 mg).
- Regarding THIS Case — We are told that the patient in this case initially presented in sinus rhythm at a reasonable heart rate — with a BP ~115/70 mm Hg — and, with no more than “mild chest discomfort”. She then suddenly developed chest pain and the AV Wenckebach rhythm shown in my Figure-1 above. New hyperacute T waves in leads III and aVF were now seen — suggesting new-onset of acute inferior MI + new bradycardia with AV Wenckebach and a narrow-QRS rhythm + new hypotension (systolic BPs in the 60s). MY THOUGHTS — I could not have made up a more favorable scenario for Atropine being likely to work for this patient!
- MY THOUGHTS on Atropine Dosing — While fully acknowledging that there is no single “correct answer” (ie, Ya gotta be there”) — I would have started with 0.5 mg of Atropine for the rhythm I see in my Figure-1 — and then waited by the bedside for the next few minutes. The drug is not benign (as per my 1st bullet above under Pearl #8) — and you “can’t take Atropine back” after giving it. The dose of Atropine can always be repeated if needed.
Our THANKS to Dr. Aaron Robinson for presentation of this interesting case!
Thanks as always to Dr Smith for another excellent case and Dr Grauer for a deep dive into the complexities of the rhythms presented!
ReplyDeleteI have a question regarding the bradycardia often seen in inferior MI's. I have been taught that this bradycardia was a result of AV node ischaemia. In the blog you mention increased parasympathetic tone as a cause of the bradycardia. Would you be able to shed any light on which (or if both) of these pathologies are usually the main cause of these inferior MI bradycardias?
@ Edward — EXCELLENT question you ask, regarding the cause of bradycardia associated with acute inferior MI. My understanding is BOTH ischemia AND increased parasympathetic (vagal) tone may contribute to this bradycardia. Ischemia may occur as a result of the fact that both the SA and AV nodes are usually supplied by the RCA. Acute inferior MI may also induce bradycardia through “vagal enhancement” (ie, the Bezold-Jarisch reflex) — as there is a preferential distribution of the vagal nerve in the inferior wall (Kawasaki et al: Pacing Clin Electrophysiol 32(1):52-8, 2009). It’s clinically relevant to be aware that enhanced vagal tone is generally most prominent during the initial (usually 6-24) hours of acute inferior MI.
DeleteKen...
DeleteIf I could add something re: Edward Brunacci's question. I agree with you that the effect on rhythm during acute inferior epicardial ischemia ("MI") is due to BOTH parasympathetic input AND ischemia. I just wanted to add an anatomical explanation...
When the problem is just sinus bradycardia, the cause is typically increased parasympathetic input that moves the sinus pacemaker from the upper SA node to the lower SA node ("lower is slower"). If the SA node becomes ischemic because the artery to the SA node has been compromised, you are more likely to see instances of sinus pauses, SA blocks, SA arrest or atrial fibrillation. The RCA provides the artery to the SA node (which is essentially the blood supply for the ENTIRE right atrium) 55% of the time and the LCx provides the artery 45% of the time - and this has nothing to do with dominance! A non-dominant LCx may provide the artery to the SA node.
The AV node on the other hand is not as responsive to parasympathetic forces as the SA node: though the upper AV node is certainly affected, autonomic neural influence is reduced significantly by the level of the lower AV node. So the effect on the AV node during an ongoing inferior MI, when due to ischemia of the artery to the AV node - often results in 3rd degree AV block (though usually temporarily). First degree AV block and Mobitz I block (aka Wenckebach conduction) are usually parasympathetically-mediated via the upper node to mid-AV node (when the change is acute). Mobitz II block does not occur in the AV node (as you know) and is due to an LAD occlusion.
Ken, I want to thank you for pointing out the necessity of calipers to anyone who SERIOUSLY wants to interpret ECGs. And I especially liked your laddergrams because you did not try to slant the lines to indicate the width of the P waves or the QRS intervals (oh yes, some others do that). The extra slanting results in laddergrams that are almost impossible to read!
Ken, I've enjoyed your posts and our personal communications long enough to know that you certainly did not need a laddergram to see the Mobitz I block - and neither did I. However, your diagrams and explanations are top-notch and easy to understand. This particular Mobitz I block would NOT have been obvious to most physicians and presented a difficulty for at least some of those managing the patient - and they were obviously very skillful clinicians!
Again, CALIPERS are a MUST! And when we are assessing the sinus rhythm but we can't see all the P waves, we have to make an assumption that the rhythm is "relatively" regular. This allows us to set the calipers to one manifest P-P interval and then use that setting to map out all the other P waves, while remembering that sinus rhythm can vary a little bit normally.
Jerry,
DeleteThese two paragraphs below are great. Do you have references for them?
Steve
When the problem is just sinus bradycardia, the cause is typically increased parasympathetic input that moves the sinus pacemaker from the upper SA node to the lower SA node ("lower is slower"). If the SA node becomes ischemic because the artery to the SA node has been compromised, you are more likely to see instances of sinus pauses, SA blocks, SA arrest or atrial fibrillation. The RCA provides the artery to the SA node (which is essentially the blood supply for the ENTIRE right atrium) 55% of the time and the LCx provides the artery 45% of the time - and this has nothing to do with dominance! A non-dominant LCx may provide the artery to the SA node.
The AV node on the other hand is not as responsive to parasympathetic forces as the SA node: though the upper AV node is certainly affected, autonomic neural influence is reduced significantly by the level of the lower AV node. So the effect on the AV node during an ongoing inferior MI, when due to ischemia of the artery to the AV node - often results in 3rd degree AV block (though usually temporarily). First degree AV block and Mobitz I block (aka Wenckebach conduction) are usually parasympathetically-mediated via the upper node to mid-AV node (when the change is acute). Mobitz II block does not occur in the AV node (as you know) and is due to an LAD occlusion.
Steve...
DeleteThis is information that I have accumulated over the years while preparing my course presentations. Most came from articles and books about the anatomy of the SA and AV nodes and the conduction system. I will go through my collection of articles and references and send some to you via email. However, I referenced many articles and none of what I said came from just one article.
THANK YOU so much Jerry for your wonderful addition to this discussion regarding the explanation for bradycardia, and its relevance clinically! YES, almost always we'll know what the rhythm is before drawing a laddergram — using calipers + an occasional laddergram allows us to PROVE it (and to demonstrate a rationale for our mechanism to others. THANKS AGAIN so much for your contributions! — :)
DeleteWhy would dobutamine be your first choice to increase HR in this patient even when she is that hypotensive. I was taught dobutamine wont significantly increase HR and is primarily an inodilator. Would epinephrine drip be better?
ReplyDeleteI had both dobutamine and norepi hung and ready at the bedside had I needed to start it. You can certainly see some hypotension with dobutamine and I was ready for that with the norepi. Approaching it with a combo of dobutamine and norepi would allow me to titrate the dobutamine to effect and only apply enough norepi to bring up here SVR enough to perfuse and keep her stable. The issue I see with epi is that you take away the ability to titrate SVR and rate independently. You run the risk of adding profoundly too much afterload with epinephrine. That's my understanding and approach to it.
Delete@ Unknown — You ask an EXCELLENT question regarding treatment of symptomatic bradycardia. That said, details go a bit BEYOND the scope of this ECG Blog. I will refer you to a 2017 superb write-up by Josh Farkas on the “Internet Book of Critical Care” (which appears at this LINK — https://emcrit.org/ibcc/bradycardia/ — on Scott Weingarts EMCrit site). My opinion, given ALL of the evidence we have in OUR case that there is increased parasympathetic tone (See “Regarding THIS Case”, toward the very end of My Comment above) — that ATROPINE would be the drug of 1st choice in this case, to see if it could reverse the bradycardia (as well as improve AV nodal conduction). After that — there is room for discussion. Unfortunately — details in our case are lacking as to the immediate response after the 1 mg of Atropine was given …. In the EMCRIT discussion — reference is made to DOBUTAMINE with effects as you mentioned — and with suggestion by Dr. Farkas as being “perfect for a patient with braadycardia and normal/elevated BP where you’re trying to increase cardiac output (without increasing BP)”. Dr. Farkas advises against Dobutamine for a “crashing, hypotensive patient” — because in that situation, its vasodilator effect might exacerbate hypotension. Dr. Farkas favors EPINEPHRINE under many circumstances, administered by bolus + infusion. AGAIN — As to OUR CASE: Details about hemodynamic stability, BP response, patient symptoms surrounding specifically WHEN during the case, and at WHAT point wrt the Atropine that was given are MISSING — so impossible to comment more on specifcs (beyond the scope of this blog). From what I can gather — after a single 1mg dose of Atropine — the patient in OUR case seemed better, and was transferred. Again — EXCELLENT post at the above link on the EMCRIT site, which I believe will address all of your questions in detail! — :)
Delete@ Aaron — THANKS so much for clarifying the details in this case — as ONLY you (as the provider on-the-scene) could do! Your treatment plan sounds perfect! And THANK YOU again for sharing this superb teaching case with us! — :)
DeleteExcellent case! Thank you both for your interpretations. Out of curiosity, would you consider the post-cath ECG to show a left posterior fasicular block?
ReplyDelete@ David — The post-cath ECG is extremely interesting! YES — I would interpret this as LPHB (left posterior hemiblock) — because there is a typical rS (with steep decline of the S wave, that shows predominent negativity) + predominant R waves in each of the inferior leads (with a hint of a qR pattern). In addition — there is now a qR pattern in lead V1 suggestive of incomplete RBBB (albeit without an lateral chest lead terminal s wave). These findings are new compared to the 2nd ECG that was done (in which there was AV Wenckebach). I’m not quite sure what to make of this, given cath findings that the graft LAD & native circumflex were stented (no mention of RCA issues …), in this patient with established multivessel disease … But from an ECG-interpretation standpoint — I would have called, “incomplete RBBB/LPHB” for my interpretation of this post-cath tracing — :)
DeleteThank you so much. Whilst I am here I might as well thank yourself, Dr Smith and Meyers (amongst other contributers) for helping to improve this paramedics ECG skills. Without a doubt patients have in turn benefited fron your teachings. Hope you are all safe and well in these times.
DeleteAmazing case and we'll worked out. Thanks for those teaching pearls.
ReplyDeleteMay I ask, how in Figure 7, the first red arrow between 3 and 4 is categorised as a p wave ? The one between 4 and 5 seems apparent on careful inspection but the first arrow between 3 and 4 doesn't. Can you please tell me how ?
@ As — IMPORTANT Question you ask, as to WHY I suggest there most probably is a P wave under the 1st arrow between beats #3 and 4 in Figure-7. Please NOTE near the top of My Comment above — that I highlight a number of reasons why my Figure-1 was a difficult tracing to interpret. In addition to how subtle many findings are because of small size of P waves + the presence of baseline artifact — you need to THINK OUT OF THE BOX while making your interpretation. This SKILL took me many years to develop. PLease read again my Step-by-Step Approach to ECG #1 — and you’ll see that I do explain what worked for me to KNOW that it was far-more-likely-than-not, that a P wave IS indeed hiding within the T wave of beat #3. And as I mention above, although subtle indeed — the T waves of beats #3 and of #5 (both of which are hiding P waves) ARE a bit taller than the T waves of beats #1, 2, 4 and 6. In “real life” — I would be looking at a longer period of monitoring to VERIFY these assumptions (specifically to find out what a T wave that I KNEW did not contain any P wave looked like — which would indeed verify my observation that the T wave DID become a little bit taller when a P wave was hidden within). Using CALIPERS makes this much easier! (Remember, those cardiologists who do not routinely use calipers end up overlooking subtle arrhythmias … ) — and also KEEP IN MIND the point I made just above where Figure-3 appears — namely, that it is FAR MORE LIKELY for sinus arrhythmia to be the underlying rhythm than some unusual form of SA node exit block (which is what we’d have to postulate if no P wave was hidden within the T wave of beat #3 = THINKING a bit “OUT OF the box”). I hope the above clarifies these points for you! — :)
Delete