
One of our residents who just graduated 3 months ago texted me this ECG:
"Hey Steve, would be grateful for any thoughts on this EKG. 60-something with 2 days of waxing and waning epigastric pain and diaphoresis. Also diffuse abdominal tenderness."
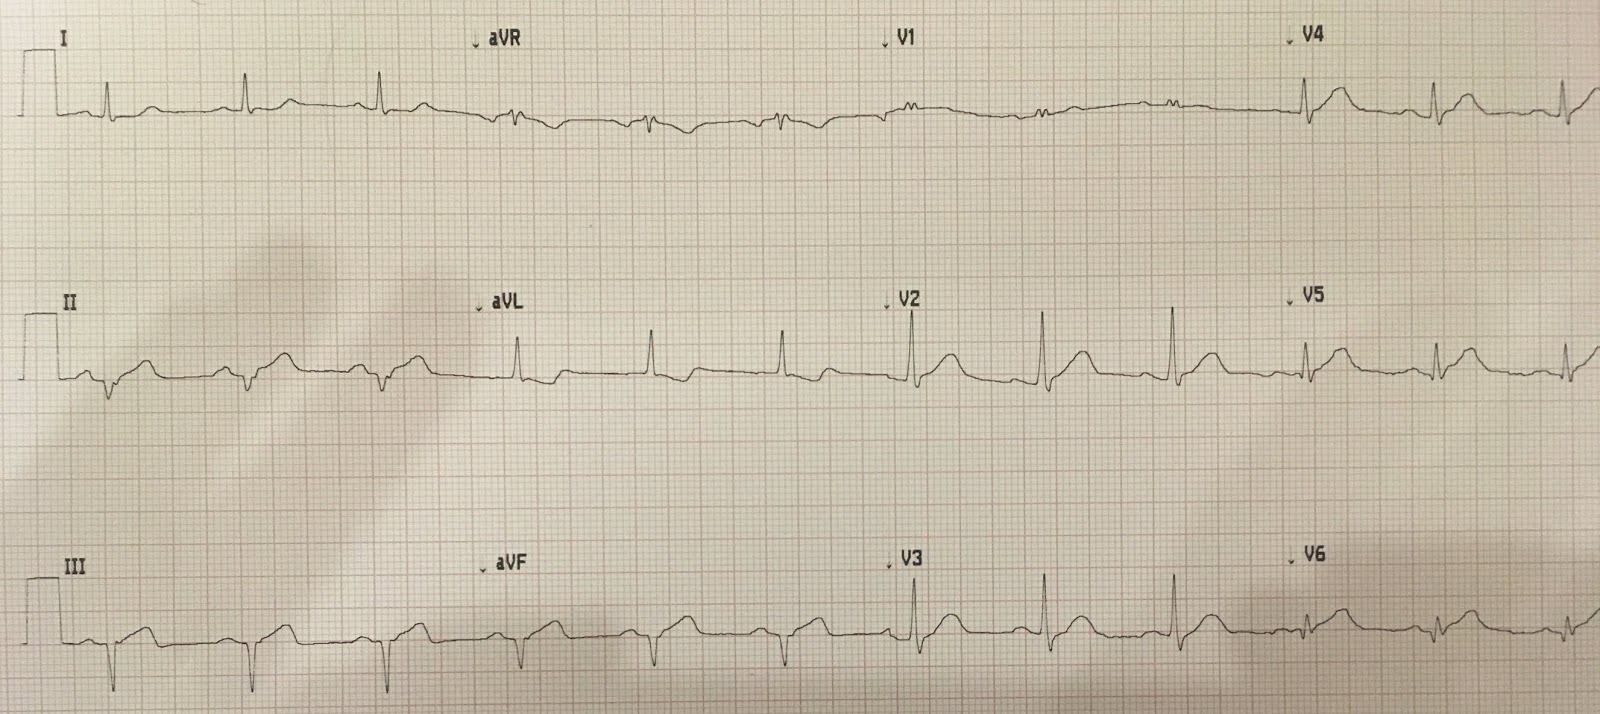
Presenting ECG:
My Answer: "Inferior and lateral OMI"
Detailed Interpretation: Sinus rhythm. Left axis deviation, but not quite LAFB (no r-wave in inferior leads; no q-wave in aVL). There is less than 1 mm STE in inferior leads, with reciprocal ST depression. There are hyperacute T-waves in inferior leads. There are hyperacute T-waves in V2-V6.
His Reply: "Thanks. On his way to cath now but not before plenty of guff from cardiology...."
Outcome:
Initial troponin I = 52.0 ng/mL. 100% proximal RCA occlusion. Severe RV dysfunction on echo.
My Question: "Did my response help you persuade the interventionalist?"
His Answer: "The troponin actually came back before your response and that's what did it....although the fact that it happened in the daytime on a weekday did not hurt. I imagine it would have been more of a struggle if it had been 2 AM."
My Question: "How could they give you lots of "condescending guff" with a troponin like that?"
His Answer: "The cardiologist said: 'Hard to call this "acute" if he has a couple of days of pain and there are Q waves, isn't it?"
My response: "Well the literature would say that if there is continued ST elevation and/or continued pain, and it is less than 48 hours (persistent ischemia), that they should go to the cath lab. The presence of Q-wave or elevated troponin is NEVER a reason to not pursue reperfusion. Besides, no one knows when his MI really started. "Waxing and waning pain, etc.""
His Answer: "That's good to know. He also had active pain which I thought was a good indication. They also steadfastly refused to see any ST Elevation on the EKG. Even after I got a second one that was more pronounced."
Even if you knew the patient's MI was less than 24 hours old, immediate intervention is still indicated:
The below article shows that even asymptomatic patients with STEMI that is 12-48 hours old have much more myocardial salvage with immediate PCI than those who have PCI on an as needed basis (recurrent symptoms, etc.)
Learning Points:
Expert ECG interpretation is much more accurate than clinical symptoms for measuring viable, endangered myocardium in OMI.
When taking a careful history, you must distinguish off and on pain (which can be repeated occlusion and reperfusion) from constant, persistent pain.
Schomig et al demonstrated smaller infarct size (and an underpowered trend toward reduced mortality) for even asymptomatic STEMIs between 12 and 48 hours of symptom onset.
Important Article
https://jamanetwork.com/journals/jama/fullarticle/201080
"Hey Steve, would be grateful for any thoughts on this EKG. 60-something with 2 days of waxing and waning epigastric pain and diaphoresis. Also diffuse abdominal tenderness."
Presenting ECG:
 |
| What was my answer? What is the management? |
My Answer: "Inferior and lateral OMI"
Detailed Interpretation: Sinus rhythm. Left axis deviation, but not quite LAFB (no r-wave in inferior leads; no q-wave in aVL). There is less than 1 mm STE in inferior leads, with reciprocal ST depression. There are hyperacute T-waves in inferior leads. There are hyperacute T-waves in V2-V6.
His Reply: "Thanks. On his way to cath now but not before plenty of guff from cardiology...."
Outcome:
Initial troponin I = 52.0 ng/mL. 100% proximal RCA occlusion. Severe RV dysfunction on echo.
My Question: "Did my response help you persuade the interventionalist?"
His Answer: "The troponin actually came back before your response and that's what did it....although the fact that it happened in the daytime on a weekday did not hurt. I imagine it would have been more of a struggle if it had been 2 AM."
My Question: "How could they give you lots of "condescending guff" with a troponin like that?"
His Answer: "The cardiologist said: 'Hard to call this "acute" if he has a couple of days of pain and there are Q waves, isn't it?"
My response: "Well the literature would say that if there is continued ST elevation and/or continued pain, and it is less than 48 hours (persistent ischemia), that they should go to the cath lab. The presence of Q-wave or elevated troponin is NEVER a reason to not pursue reperfusion. Besides, no one knows when his MI really started. "Waxing and waning pain, etc.""
His Answer: "That's good to know. He also had active pain which I thought was a good indication. They also steadfastly refused to see any ST Elevation on the EKG. Even after I got a second one that was more pronounced."
Even if you knew the patient's MI was less than 24 hours old, immediate intervention is still indicated:
The below article shows that even asymptomatic patients with STEMI that is 12-48 hours old have much more myocardial salvage with immediate PCI than those who have PCI on an as needed basis (recurrent symptoms, etc.)
Learning Points:
Expert ECG interpretation is much more accurate than clinical symptoms for measuring viable, endangered myocardium in OMI.
When taking a careful history, you must distinguish off and on pain (which can be repeated occlusion and reperfusion) from constant, persistent pain.
Schomig et al demonstrated smaller infarct size (and an underpowered trend toward reduced mortality) for even asymptomatic STEMIs between 12 and 48 hours of symptom onset.
Important Article
https://jamanetwork.com/journals/jama/fullarticle/201080
Abstract
Context No specifically designed studies have addressed the role of primary percutaneous coronary intervention in patients with acute ST-segment elevation myocardial infarction (STEMI) presenting more than 12 hours after symptom onset. Current guidelines do not recommend reperfusion treatment in these patients.
Objective To assess whether an immediate invasive treatment strategy is associated with a reduction of infarct size in patients with acute STEMI, presenting between 12 and 48 hours after symptom onset, vs a conventional conservative strategy.
Design, Setting, and Patients International, multicenter, open-label, randomized controlled trial conducted from May 23, 2001, to December 15, 2004, of 365 patients aged 18 to 80 years without persistent symptoms admitted with the diagnosis of acute STEMI between 12 and 48 hours after symptom onset.
Interventions Random assignment to either an invasive strategy (n=182) based predominantly on coronary stenting with abciximab or a conventional conservative treatment strategy (n=183).
Main Outcome Measures The primary end point was final left ventricular infarct size according to single-photon emission computed tomography study with technetium Tc 99m sestamibi performed between 5 and 10 days after randomization in 347 patients (95.1%). Secondary end points included composite of death, recurrent MI, or stroke at 30 days.
Results The final left ventricular infarct size was significantly smaller in patients assigned to the invasive group (median, 8.0%; interquartile range [IQR], 2.0%-15.8%) vs those assigned to the conservative group (median, 13.0%; IQR, 3.0%-27.0%; P<.001). The mean difference in final left ventricular infarct size between the invasive and conservative groups was −6.8% (95% confidence interval [CI], −10.2% to −3.5%). The secondary end points of death, recurrent MI, or stroke at 30 days occurred in 8 patients in the invasive group (4.4%) and 12 patients in the conservative group (6.6%) (relative risk, 0.67; 95% CI, 0.27-1.62; P = .37).
Conclusion An invasive strategy based on coronary stenting with adjunctive use of abciximab reduces infarct size in patients with acute STEMI without persistent symptoms presenting 12 to 48 hours after symptom onset.


===================================
MY Comment by KEN GRAUER, MD (10/20/2019):
===================================
I find it difficult to believe that the Cardiologist Attending On Call did not allow for the possibility that the OMI in this case was either acute and/or ongoing.
- MY Question: Was this the opinion of the Attending Cardiologist — or a Resident, or less experienced Cardiology Fellow? If it was the experience of anyone but the Attending Cardiologist — then my suggestion would be to directly consult with the Attending Cardiologist assigned to this case (and to ensure that he/she has directly viewed this ECG before rendering their decision).
For clarity — I’ve reproduced the ECG in this case in Figure-1. I’ll focus My Comments on addressing the following points.
- How should you date the infarction(s) that we see in Figure-1?
- Do you agree with the Cardiology team that “steadfastly refused to see any ST elevation” on this tracing? If YOU disagree — in which leads is there ST elevation?
- Is QRS morphology in the inferior leads consistent with LAHB? — with inferior infarction? — or, potentially with both?
- Is the appearance of the QRS complex in lead V1 normal? If not — is QRS appearance in lead V1 of this tracing potentially relevant to this case?
 |
| Figure-1: The ECG in this case (See text). |
Descriptive Analysis of the ECG in Figure-1: As always, I advocate routine use a Systematic Approach to each and every ECG that you interpret (More on this in My Comment on Dr. Smith’s 6/28/2019 Blog post). Not to routinely use a Systematic Approach invites missing potentially important findings (See below — as no one mentioned QRS appearance in lead V1 of this tracing ... ) — CLICK HERE for more on My System.
- The Rate and Rhythm for the ECG in Figure-1 is sinus at ~75/minute.
- All Intervals (PR, QRS duration, QTc) are normal. NOTE: Measurement of all intervals should be from that lead in which you can clearly see the onset and offset of the interval — and in which the interval is longest! Although the QRS complex looks a bit longer-than-usual in a number of leads (ie, leads V1, V6) — the QRS does not measure more than half a large box in duration in any lead (ie, not more than 0.10 second) — so the QRS complex is therefore not prolonged!
- There is marked left Axis duration (Note QS complexes in each of the inferior leads)! That said (as highlighted by Dr. Smith) — QRS morphology in the limb leads is not typical for simple LAHB (Left Anterior HemiBlock) — because instead of a qR complex in lead I with rS complexes in each of the inferior leads — there is no initial q in lead I, and no initial r in the inferior leads.
- PEARL: The finding of QS complexes in each of the inferior leads could be due to: i) Inferior MI; ii) LAHB; and/or, iii) Inferior MI + LAHB. There is simply no way to distinguish between these 3 possibilities on the basis of the single ECG shown in Figure-1. My hunch (given the overall appearance of this ECG), is that the QRS complexes we see here in each of the inferior leads reflects both inferior MI + LAHB — but I can’t prove this.
- There is no Chamber Enlargement.
Regarding Q-R-S-T Changes:
- As noted — there are QS complexes in each of the inferior leads. There are also Q waves in leads V5 and V6. Especially in view of the tiny QRS amplitude in lead V6 — the Q wave in this lead V6 is most definitely abnormal (ie, it is not a “normal” septal q wave)!
- Regarding R Wave Progression — the tiny QRS complex in lead V1 is all positive. This is not normal — since the normal QRS complex in lead V1 should be predominantly negative (reflecting the fact that depolarization of the left ventricle should be viewed as moving away from right-sided lead V1). The finding of a Tall (or predominant) R wave in lead V1 should prompt consideration of a short list of diagnostic entities (CLICK HERE — for Review of this LIST). In this particular case — there is a small-but-definitely-present narrow terminal s wave in both leads I and V6. In view of the narrow QRS + rr’ configuration for the QRS complex in lead V1 — ECG criteria are satisfied for IRBBB (Incomplete RBBB). NOTE: This raises a question as to whether a form of bifascicular block that could be new, may be present in ECG #1 (ie, IRBBB/LAHB) — which is relevant, given our consideration of recent/acute/ongoing OMI.
Returning to the ECG in Figure-1 for assessment of the last 2 parameters in my Q-R-S-T assessment = ST-T Wave Abnormalities:
- As per Dr. Smith — there are hyperacute ST-T waves in multiple leads — including the 3 inferior leads + leads V2-thru-V6. The peak for the T waves in each of these leads is fatter-than-it-should-be and, the T wave base is broader-than-expected. While one might question the “hyperacute” nature of the T waves in leads V2 and V3 (if these leads were viewed alone) — there can be no question that T wave amplitude (relative to QRS amplitude in the same lead) is disproportionately tall in leads V4, V5 and V6. By the concept of “neighboring leads” — since the T waves in V6, V5 and V4 are obviously hyperacute — the rounder-and-fatter T wave peak appearance in neighboring leads V2 and V3 are almost certainly part of this process!
- I still have trouble believing that an experienced Cardiology Attending would “steadfastly refuse to see any ST elevation” in ECG #1. The horizontal RED dotted lines that I have drawn in no less than 7 leads in Figure-1 demonstrate a small-but-definitely-present amount of ST elevation in each of the infero-lateral leads (as well as probably also in lead V2).
- As we have emphasized numerous times in this Blog — the presence of the “magic” mirror-image opposite view for the shape of the ST segments in leads III and aVL tells us there has been recent (if not acute) inferior OMI until you prove otherwise!
- The ST segment in lead I is also not normal! Note how straight this ST segment is — which makes for abrupt angulation at the point where the ST segment joins the small upright T wave in lead I. A normal ST segment should be gradually upsloping, with imperceptible transition from the ST segment to the upslope of the T wave.
- PEARL: The last abnormality that I see on this tracing is the small-but-upright T wave in lead V1. Given the presence of IRBBB — we should normally expect a negative ST-T wave in lead V1. In addition — the RED horizontal line in lead V2 of Figure-1 suggests a small amount of ST elevation in this lead. While I was admittedly not initially certain of the significance of these findings — my hunch was that it was part of the overall acute process (See below).
- Bottom Line: No less than 11 of the 12 leads on this ECG (all leads except lead aVR) show abnormal ST-T waves — as well as the above noted possibility of bifascicular block.
Clinical Impression of this ECG: We need to remember the History of this patient = 2 days of “waxing and waning epigastric pain and diaphoresis” in a 60-something year old.
- While admittedly, this patient did not specifically have chest pain — the Framingham Studies long ago taught us that at least 1/4 (if not 1/3) of all MIs are “Silent MIs” = not associated with chest pain (ie, instead associated either with some other “chest pain equivalent”, such as shortness of breath, mental status changes, “flu-like” syndrome, GI pain — or without any symptoms at all). Therefore, the history in this case is potentially consistent with a recent or new event over the 2 days prior to presenting to the ED!
- As per Dr. Smith — the ECG in Figure-1 is consistent with infero-lateral OMI. In addition — I would add the qualification of OMI of uncertain age, which could possibly be acute or ongoing. Granted, the inferior QS complexes suggest that this may be a completed event — BUT — there is an unmistakable small-but-definite amount of ST elevation in multiple leads + hyperacute ST-T waves in multiple leads + mirror-image reciprocal changes in lead aVL + possible bifascicular block of uncertain age in a 60-something adult with a 2-day history of new symptoms that could be a “chest pain equivalent” — which to me means there is no way to rule out a recent (if not acute or ongoing) event on the basis of this initial ECG.
- Retrospectively — we are told that acute cath showed 100% proximal RCA occlusion — and, that Echo showed severe RV dysfunction. Considering the IRBBB, and the fact that there should usually be ST-T depression in anterior leads with this finding + our usual expectation of associated posterior MI (with anterior ST depression) in association with acute inferior MI — I bet the upright T wave in lead V1 and the ST elevation we see in lead V2 are both reflective of acute RV involvement!
- BOTTOM LINE: The onus of proof in this case should be to demonstrate that prompt cath is not indicated — rather than the other way around. It is difficult to conceive that the Cardiology team would not at least actively consider this, even prior to learning that serum troponin was elevated ...
Our THANKS to Dr. Smith for presenting this case!
Can you please explaine, why do you assess T-waves in inferior leads and in V2-V6 as hyperacute?
ReplyDelete@ Anonymous — As I explain in detail in My Comment above (written after you submitted your important question) — the “picture” of ST-T wave changes that are “hyperacute” in a patient with new symptoms — includes T waves that are fatter-than-they-should-be at their peak and/or wider-than-expected at their base — and/or, disproportionately tall compared to QRS amplitude in the same lead. As we describe above — we see this hyperacute picture in multiple leads in this patient with new symptoms + the acute finding of reciprocal ST depression in lead aVL that is the mirror-image opposite of the ST elevation we see in lead III. With experience — the "Gestalt" of the ECG picture we see in this tracing says, "I'm hyperacute until you prove otherwise!" — :)
Delete@ Duyf — I am not sure what you mean by saying that this ECG “is not typical RCA occlusion”? Clearly, this is not a simple case. We don’t have a baseline ECG for comparison on this patient. The history is not typical — because there was no chest pain that just began over the past few hours. And, the ECG shows deep QS complexes in the inferior leads that suggest there may have already been a completed event — with other ECG findings being challenging to “date”. That said, as I explain in detail in My Comment (above) — the history IS of a new symptom that could be consistent with recent or acute and/or ongoing OMI — and there IS still ST elevation with hyperacute ST-T waves + mirror-image opposite reciprocal ST depression in lead aVL — so this ECG certainly COULD be consistent with acute RCA occlusion — :)
ReplyDeleteSteve, what would I do with this patient presenting in Broome, Australia, where he would be likely 12-24 hours from the cath lab at a minimum? I would never get the go ahead to thrombolyse from the cardiologists, but would you consider it worth it?
ReplyDeleteDavid, it all depends on your certainty. I would look at this and be absolutely certain that it is an LAD occlusion, and I would thrombolyse. Not everyone would be certain enough. That's why we need AI for this task, in the future!
Delete