
Written by Magnus Nossen, edits by Smith
The patient in today's case is an 85-year-old male with a history of COPD and dementia. He presented to the emergency department for evaluation. Lets us consider two different clinical presentations. How will you manage this patient in each scenario?
Scenario 1: The patient presents with 24 hours of substernal chest pain.
Scenario 2: The patient presents with 6 days of dyspnea.
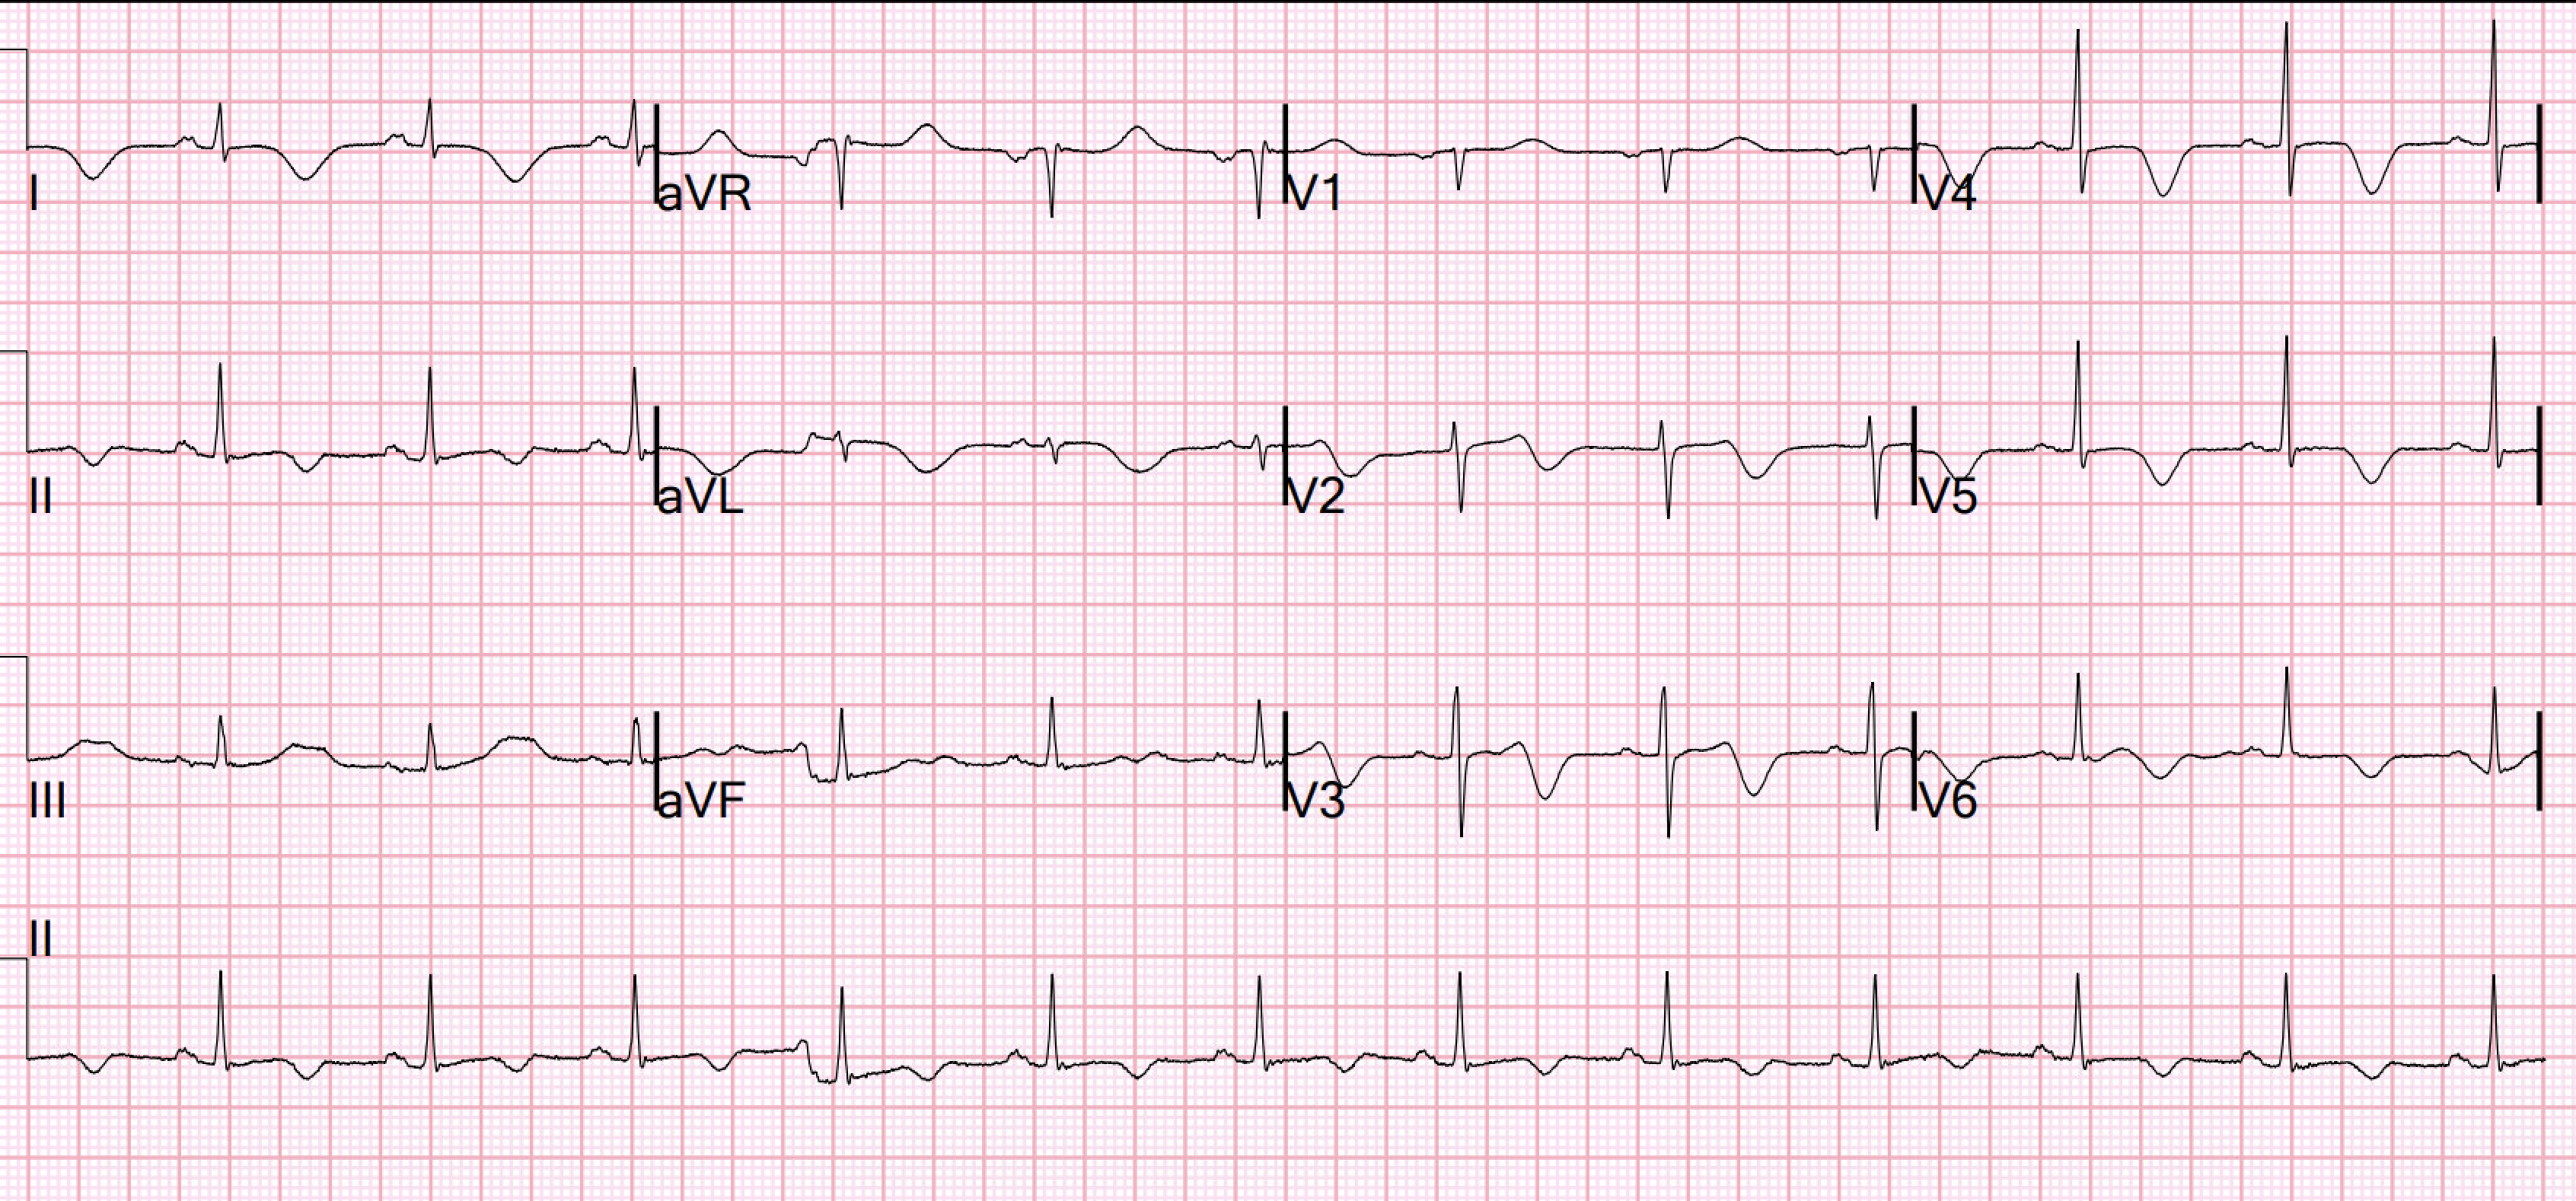
Below is his presentation ECG. What do you think? How do you explain the ST segment elevation in the precordial and limb leads?
 |
| The above ECG was originally recorded with a paper speed of 50mm/sec. It has been "compressed" on the X-axis so that it looks like it was recorded with a paper speed of 25mm/sec. |
Interpretation: The ECG shows sinus rhythm at 94 beats per minute. QRS-complexes are narrow, QRS-axis in the frontal plane is close to vertical at about 90 degrees. The precordial and inferior leads show ST segment elevation. Let us first look at the precordial leads:
Early precordial leads V2 and V3 have minimal R-waves followed by deep S-waves and ST elevation. Lead V4 does not have an R-wave but instead has a QS complex followed by ST elevation. There is some R wave in the lateral precordial leads. Leads V3 and V4 both have 6mm ST elevation. When there are QS-waves, one should always think about LV aneurysm, but ST to QRS ratio and T-wave to QRS ratio are far too large and not compatible with left ventricular aneurysm. This ECG shows a lot of "acuity". There is substantial area under the ST-segment and area under the T-waves. This correlates with potentially salvageable myocardium.
Smith: T waves are very hyperacute: these are a sign of ACUTE infarction, even if there are Q-waves. See Raitt et al.: 50% of LAD STEMI have Q-waves by one hour. While most of these are QR-waves (not QS-waves), QS-waves are still possible in Acute MI; that is why I needed to create a rule to differentiate the ST Elevation and QS-waves of Acute anterior MI from that of LV aneurysm. So it is not necessarily subacute. The exception is with postinfarction pericarditis, in which a completed transmural infarct results in inflammation of the subepicardial myocardium and STE in the distribution of the infarct, and which results in increased STE and large upright T-waves. The ECG findings in isolation must be assumed to be acute MI until proven otherwise. The presence of Q-waves does NOT in any way rule out acute OMI. It might even be an acute OMI superimposed on an old Q-wave OMI. So one must activate the cath lab in order to assess. It will probably show an occlusion of the LAD, and it might be difficult to know how long the occlusion has been there and how viable the myocardium is, but it needs to be opened.
We have now looked at the precordial leads, they show findings consistent with an acute or subacute OMI. Let us have a look at the limb lead ST-T changes.
What do you make of the inferior lead ST elevation? Is this ST elevation ischemic in nature? Could the inferior lead ST-elevation be due to a “wrap around” LAD that supplies the inferior wall? And if so, could the patient benefit from revascularization?
The ST segment elevation in the inferior leads do not have a typical ischemic look. the ST segments are upward concave with distinct J-waves in leads II and aVF. There is also slight PR segment depression. These findings together are more commonly seen with pericarditis.
Smith: In limb leads, the ST vector is towards lead II (STE lead II >STE lead III, which is more likely with pericarditis than with STEMI). However, postinfarction pericarditis is usually limited to the area of infarct (unlike idiopathic pericarditis, which involved the entire pericardium and has diffuse STE with an ST vector towards leads II and V5). This is why postinfarction pericarditis is called "postinfarction regional pericarditis"
Conclusion: In summary, the ECG changes seen in today's initial ECG could be compatible both with an acute anterior wall MI with early Q-wave development. It could also, given a different clinical context be compatible with a subacute myocardial infarction complicated by post infarct regional pericarditis. Clinical correlation is key in managing patients in the best possible way.
Back to the case: Scenario 2 was the actual presentation of this 80-year-old man. Due to very severe dementia, it was impossible to obtain a detailed history. His wife was able to report that the patient had a brief episode of chest discomfort 6 days prior, followed by intermittent complaints of dyspnea. He was seen by a health care provider 4 days prior to admission for dyspnea and was started on oral antibiotics for suspected pneumonia. He did not improve.
The ECG and clinical history is compatible with a subacute transmural infarction of the LAD territory. The persistently large and upright anterior wall T waves and the inferior wall ST-segment elevation is likely the result of a combination of subacute MI and post infarct pericarditis. As discussed above, postinfarction pericarditis is not generally diffuse like standard pericarditis. It is generally localized to the area of infarct; thus, there might be a wrap around LAD that supplied the inferior wall.
- As Dr Smith has pointed out numerous times on this blog, the ECG is a great tool to assess myocardial viability. Denying patients the potential benefit of revascularization just because their symptoms have lasted a certain amount of time shows poor understanding of the pathophysiology of myocardial ischemia.
- Patients may have repeated episodes of transient reperfusion preventing the myocardium from undergoing necrosis. Also, some patients have enough collateral blood flow that will keep the myocardium viable.
- The ECG, clinical history and echo together should guide the decision on whether or not the patient should go to the cath lab.
Among the complications of transmural infarction is post infarction pericarditis (PIRP). This complication is much more likely in patients whom have delayed or no revascularization. One study which evaluated ST-segment elevation MI patients over a 13-year period demonstrated only 1.2% of patients developed PIRP [1]. Rates of occurrence of PIRP have decreased drastically in the era of percutaneous coronary intervention. Despite its low incidence rates in recent years, it is important to consider PIRP in patients with recent MI.
What should make you suspect PIRP?
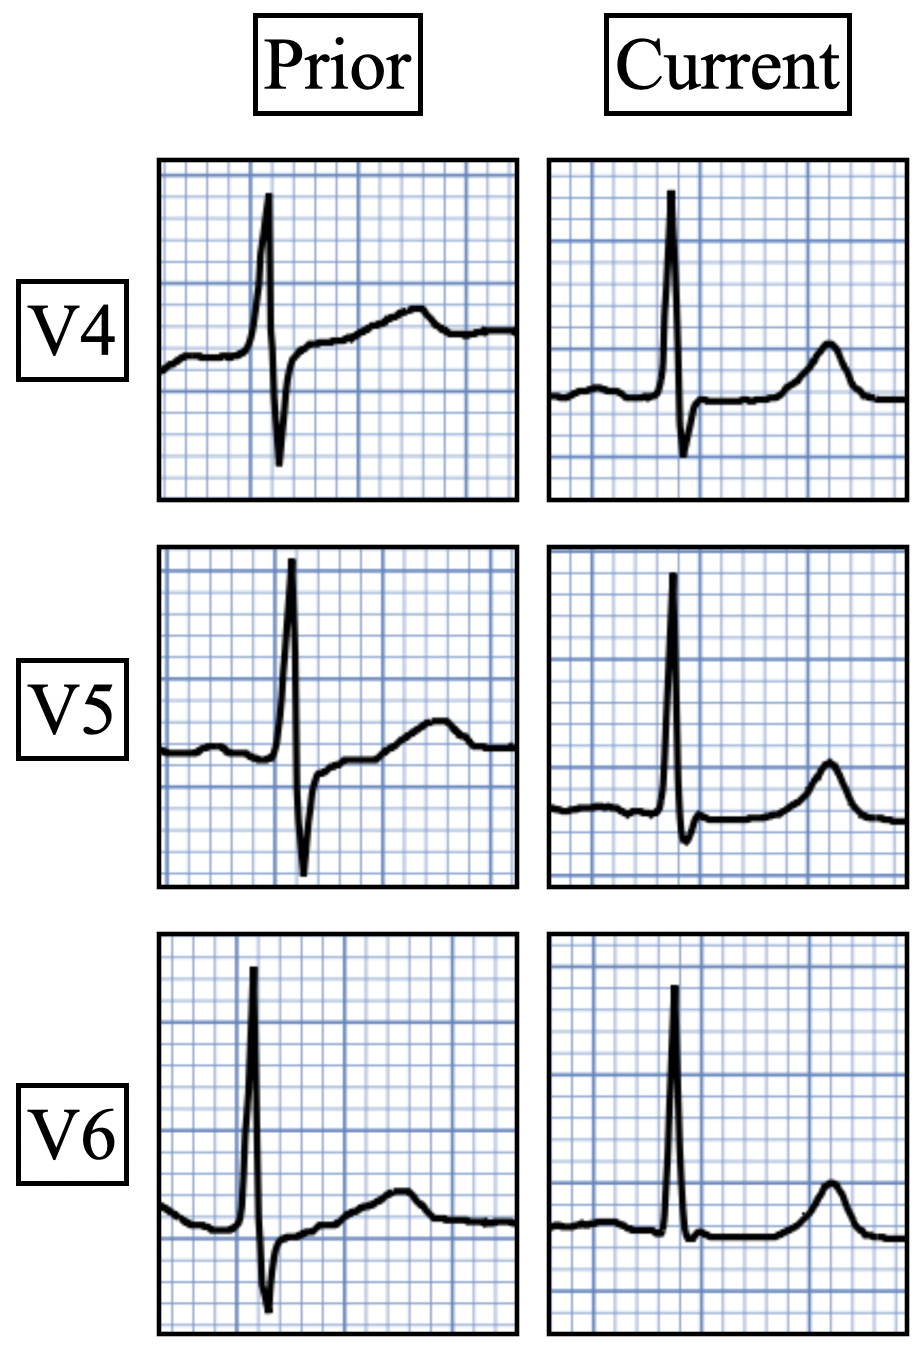
Oliva et al. [2] strongly associated myocardial rupture with postinfarction regional pericarditis (PIRP), and associated PIRP with persistent upright T-waves. He found 2 ECG patterns of atypical T-wave development in PIRP:
- Persistently positive (upright) T-waves 48 hours after AMI onset.
- Premature, gradual reversal of inverted T waves to positive (upright) deflections by 48 to 72 hours after MI onset in the presence of well formed Q-waves.
The only other processes identified that caused this type of postinfarction T wave evolution were cardiopulmonary resuscitation, reinfarction, and very small infarcts. Both reperfusion, as judged by the biomarker curve, and patency, as assessed by the angiogram, were correlated with the rapidity and depth of T wave inversion. Ninety percent of patients with reperfusion attained a maximum T wave negativity of 3 mm or more within 48 hours after the onset of chest pain in the lead that initially displayed the greatest ST segment elevation. Seventy-six percent of patients without reperfusion attained a maximum negativity of 2 mm or less within 72 hours. Thus, upright T waves beyond 72 hours after acute MI should make you considered the possibility of PIRP.
When a patient who initially had T-wave inversion due to reperfusion or as a natural course of an untreated MI develops upright T-waves, we call this pseudonormalization of T-waves. In this scenario, there are two main etiologies to consider:
1) Re-occlusion of the infarct related artery. (Most common cause)
2) Post infarct regional pericarditis. (Second most common cause)
Clinical course: The patient in today's case did not undergo revascularization. Due to the atypical and vague symptoms, the myocardial infarct was not initially diagnosed. At presentation he had a history of dyspnea for 6 days. There were no other causes of dyspnea apparent and thus we can assume that myocardial ischemia started 6 days prior. T waves should have been inverted at the time of presentation if this was an uncomplicated transmural anterior wall MI. The fact that they were not, makes post infarction regional pericarditis likely as the cause of persistently upright T waves.
Patients with suspected ACS should be evaluated with echocardiography. Nowadays pocket sized devices make it possible to quickly get an overview of the heart function of a patient by the bedside. Perhaps not all readers of this blog are experienced evaluating echo images.
 |
| Above I have reproduced a still frame image from the bed side echo done on this patient. The top of the image is closest to the echo probe. The apex of the heart is at the top of the image with the base at the bottom. The heart chamber are annotated. (RA = right atrium. RV = right ventricle. LA = left atrium. LV =left ventricle. IVS = interventricular septum.) |
This video shows the regional wall motion abnormality of the distal septum and apical region of the left ventricle. The distal septum appears thickened. This is not due to hypertrophy. The myocardium appears thickened (pseudohypertrophied) due to myocardial edema. The edema also makes the necrotic myocardium less echo dense making it appear less "white"
The above echo loop shows a high turbulence flow that traverses the distal interventricular septum. This is consistent with a ventricular septal rupture (VSR). Mechanical complications such as VSR and free wall rupture are associated with post infarct regional pericarditis. This patient as expected presented with a new harsh holosystolic murmur.
 |
| This image show the direction of blood flow from the left ventricle (high pressure system) through the ventricular septal rupture to the right ventricle (low pressure system). If the defect is a large one, pressure across the defect will equalize quickly and the pressure gradient will be low. If the defect on the other hand is small, pressures will not equalize and a pressure gradient can be measured by doppler. The pressure gradient in this case was significant indicating that the defect is rather small. The larger the size of the defect the larger the shunt. Larger shunt volume means less blood exiting the left ventricle through the aortic valve and lower cardiac output. |
When there is full thickness infarction, there is epicardial inflammation (post-infarction regional pericarditis), and the myocardium is at risk of "rupture." The term "rupture" makes it sound like some sort of explosion or massive blowout, but it is usually a small, slow leak that, over time, can cause tamponade and death. Rupture can be either free wall rupture (causing tamponade) or septal rupture, causing ventricular septal defect with left to right flow and resulting pulmonary edema and shock.
VSR following myocardial infarction carries a grave prognosis with a virtual 100% one-year mortality without surgical correction. The patient in todays case had two complications (PIRP and VSR) following an undiagnosed anterior wall MI. The patient was not considered a surgical candidate. Mechanical complications such as free wall rupture, VSR and papillary muscle rupture is more likely to occur in patients who are older, female, hypertensive, have chronic kidney disease, and have no prior history of smoking. It commonly occurs in the setting of a first myocardial infarction (MI) in the background of delayed or absent reperfusion therapy. Angiography usually reveals an absence of collateral circulation to the infarct zone.
Because previous ischemia induces myocardial preconditioning, decreasing the likelihood of transmural myocardial necrosis and myocardial rupture, patients with evidence of diabetes mellitus, chronic angina or previous MI are less likely to experience a rupture. VSR may develop within 1-14 days post MI, however it’s incidence usually shows a bimodal peak which is within 24 hours and after 3-5 days post MI tend to occur in patient with completed myocardial infarctions where
For patients considered candidates for surgery the timing of surgery is crucial. Necrotic myocardium is fragile. Following infarction, metalloproteinase activity and tissue breakdown peak by day 7, whereas deposition of new collagen begins by days 2-4. Necrotic myocytes are entirely replaced by collagen by 28 days and therefore, postponing surgical correction might facilitate successful repair by allowing friable tissue to organize, strengthen, and become well-differentiated from surrounding healthy tissue.
It follows then from the above paragraph that it is important to stabilize patient enough so that surgery can be planned and timed optimally.
For more on hemodynamic effects and how to manage a patient with VSR see this post: Why the sudden shock after a few days of malaise?
For another example of PIRP and VSR see this post:
Learning points:
- QS-waves with persistent ST Elevation and/or hyperacute T-waves may be due to either Acute MI or to Subacute completed MI with post-infarction pericarditis.
- Postinfarction Pericarditis implies complete transmural infarction and puts the patient at risk for ventricular septal rupture or even free wall myocardial rupture.
- Mechanical complications of transmural infarction are rare and dreaded sequela and have high morbidity and mortality.
- New onset harsh systolic murmur in a patient with subacute completed MI is VSR or papillary muscle rupture (with acute mitral regurgitation) until proven otherwise.
- Post infarction regional pericarditis (PIRP) can be suspected from the ECG and is associated with an increased risk of myocardial rupture.
- Clinical correlation must always be sought before decision making.
References:
[1] Lador, A. et. al. (2017). Incidence and Prognosis of Pericarditis After ST-Elevation Myocardial Infarction (from the Acute Coronary Syndrome Israeli Survey 2000 to 2013 Registry Database). The American Journal of Cardiology, 121(6), 690–694. https://doi.org/10.1016/j.amjcard.2017.12.006
[2] Oliva, P. B., Hammill, S. C., & Edwards, W. D. (1993). Electrocardiographic diagnosis of postinfarction regional pericarditis. Ancillary observations regarding the effect of reperfusion on the rapidity and amplitude of T wave inversion after acute myocardial infarction. Circulation, 88(3), 896–904. https://doi.org/10.1161/01.cir.88.3.896
[3] Oliva PB, Hammill SC, Edwards WD. Cardiac rupture, a clinically predictable complication of acute myocardial infarction: report of 70 cases with clinicopathologic correlations. J Am Coll Cardiol 1993; 22:720-726.
[4] Wang, S., Liu, H., Yang, P., Wang, Z., & Chen, S. (2024). Current Understanding of Timing of Surgical Repair for Ventricular Septal Rupture following Acute Myocardial Infarction. Cardiology, 1–14. https://doi.org/10.1159/000538967
[5] Vega, J. D. S., Salinas, G. L. A., et. al (2022). Optimal surgical timing after post-infarction ventricular septal rupture. Cardiology Journal, 29(5), 773–781. https://doi.org/10.5603/cj.a2022.0035
[6] Contemporary Management of Post-MI Ventricular Septal Rupture - American College of Cardiology. (2018, July 30). American College of Cardiology. https://www.acc.org/latest-in-cardiology/articles/2018/07/30/06/58/contemporary-management-of-post-mi-ventricular-septal-rupture
===================================
MY Comment, by KEN GRAUER, MD (2/26/2025):
===================================
I found today's case highly insightful with regard to many aspects. These include:
- The fact that although serious complications from acute MI are far less common than in years past — today's case manifests a "combination" of post-infarct complications (ie, post-MI pericarditis; post-MI VSR = Ventricular Septal Rupture). Awareness of the course of these complications is important to facilitate earlier detection.
- This patient's MI was in large part "silent" — in that CP (Chest Pain) was not a prominant complaint. Instead, the patient's primary symptom was severe dyspnea (See the September 5, 2024 post in Dr. Smith's ECG Blog regarding the frequency of "silent" MI, especially in older patients who present with acute dyspnea — with that Sept. 5 case also from Dr. Nossen, and also associated with post-MI VSR).
- Physical Exam was revealing. Most of the time with acute MI — little additional information is provided by physical examination (with exception of those acute MI patients who present with heart failure or shock). Today's patient presented with a harsh, holosystolic murmur consistent with acute VSR. This was detected on admission through the ED (Emergency Department) — but we are not provided with information as to whether a murmur was detected 4 days earlier when the patient was seen in an ambulatory care center and treated with antibiotics for pneumonia. This is relevant — as knowing when the murmur appeared may have expedited realization of VSR in this elderly patient with dementia and severe dyspnea.
- We are not told if a pericardial friction rub was listened for. This could have been another clue for facilitating earlier recognition of tihs patient's post-event pericarditis.
- Point of care Echo was diagnostic — showing obvious regional wall motion abnormality of the distal septum and ventricular apex. Once again, earlier use of Echo would have expedited recognition of the cause of this patient's dyspnea that began 6 days earlier.
- Finally — No ECG was apparently done 4 days earlier at the time of the primary care visit. I learned by subsequent history that this initial encounter was a home visit by a primary care provider — with assessment clearly challenging because of the patient's dementia. But in the "retrospectoscope" — I find it insightful to look back and contemplate whether the patient should have been sent to the ED for evaluation at that time. This is not in any way a criticism — since we clearly lack details for any judgment. But we learn from cases that don't go as expected (ie, it appears the patient never had pneumonia) — and doing the "hard work" of considering what we might do differently the next time we encounter a similar situation is how we improve as clinicians.
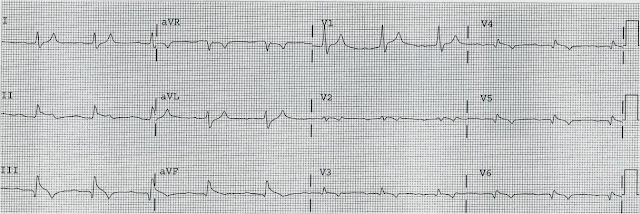
- P.S.: There is no mention of a prior ECG in today's case. Realizing that we are not privy to many of the details in today's case — locating a prior tracing for comparison may have clarified a number of conflicting findings in today's ECG (that I've reproduced and labeled in Figure-1).
QUESTION:
- How would you interpret the ECG in Figure-1?
-USE.png) |
| Figure-1: I've labeled the initial ECG in today's case. |
============================
NOTE: The ECG in Figure-1 was initially recorded using the Cabrera Format — in which both the recording speed and limb lead sequencing have been altered (ie, Rather than +aVR — the negative display of lead aVR is used = -aVR).
- Because my "ECG brain" has been wired for interpretation of ECGs at the 25 mm/second speed (that is standard in the U.S. and in most of the world) — My routine is to selectively reduce the width of such tracings by 50% to compensate for the 50 mm/second speed routinely used with the Cabrera format. This has been done in Figure-1.
- Outlined in BLUE just above lead V1 — are several ECG grid boxes to facilitate recognizing that the R-R interval in ECG #1 is slightly more than 3 large boxes in duration — corresponding to sinus rhythm at a rate of ~90-95/minute.
- Given globalization of our world — we favor familiarization with different recording formats (For detailed review of the Cabrera Format — Check out My Comment at the bottom of the page in the October 26, 2020 post in Dr. Smith's ECG Blog).
============================
The ECG in Figure-1:
As noted — there is sinus rhythm at ~90-95/minute. The PR interval is normal. The QRS is not wide.
- The QTc appears to be at the upper limit of normal, or borderline prolonged (Using our QTc Calculator described in the January 12, 2025 post — and plugging in a rate of ~95/minute and a measured QT = 370 msec, as seen in leads V3,V4 — we come up with an estimated QTc clearly under 450 msec., or still normal).
- Although mid-precordial S waves are quite deep — voltage criteria for LVH are not quite met (See My Comment in the June 20, 2020 post). Instead, the deep chest lead S waves are probably the result of a lack of opposing forces from extensive anterior infarction.
There are Q waves:
- Multiple Q waves are seen. Although narrow — Q waves are fairly deep in leads -aVR,II,aVF,III; and in leads V5,V6 (BLUE arrows in these leads).
- There is loss of r wave between leads V2-to-V3 (RED arrows in these leads).
- This is followed by a deep QS wave in lead V4. There is fragmentation near the beginning of S wave downslope (within the dotted BLUE oval in this lead V4).
- Whereas it is hard to know what to make of the relatively narrow diffuse limb lead Q waves — the chest lead findings of "loss of r wave" + fragmented QS in V4 + much deeper-than-expected Q waves in V5,V6 indicate extensive anterior MI at some point in time.
- Simple pericarditis does not manifest infarction Q waves. But Q waves are common with post-infarction pericarditis.
There is marked and diffuse ST elevation:
- Remarkable for their similarity — 4 successive limb leads ( = leads -aVR,II,aVF,III ) all show Q waves followed by significant J-point ST elevation. Straightening of the ST segments in each of these leads to "my eye" suggests acuity.
- In the face of these 4 successive limb leads showing ST elevation — My "eye" was drawn to mirror-image opposite ST depression in lead aVL and a distinct flattening of the ST segment in neighboring lead I (within the 2 BLUE rectangles).
- ST elevation is marked in leads V3,V4 (more than 4 mm.). Neighboring leads V5,V6 manifest a lesser degree of ST elevation.
- Simple pericarditis does not manifest the kind of reciprocal ST-T wave changes seen in high-lateral leads I,aVL. But the finding of ST elevation in 8/12 leads, in association with the above noted Q waves is probably most consistent with recent extensive infero-antero-lateral MI, now with post-infarction pericarditis.
Final Thoughts:
I wish we knew more about certain specifics regarding today's case. When did the MI begin? When was the VSR? How extensive was this patient's heart disease prior to this recent event?
- The above said — given the patient's age, co-morbidities, and the decision that he was not a surgical candidate, there was little to do clinically that would alter this patient's guarded outcome.


.png)


