Monday, August 26, 2024

Epigastric and Right Upper Quadrant pain after eating spicy food

A 60-something woman with no cardiac history presented with epigastric and right upper quadrant pain after eating spicy food.

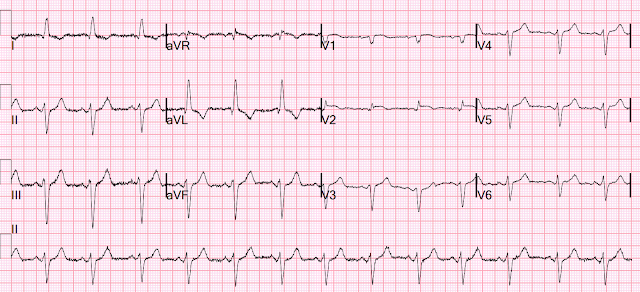
She had an ECG recorded at triage:

What do you think?


This was sent to me without any info while I was out and about, and I looked at it on my phone.  I responded: "That is a tough one.  V2 is very worrisome.  But no other leads are.   I probably would call it OMI.  What was the outcome?"

More analysis while looking at it on a computer screen: There is an intraventricular conduction delay with appropriately discordant ST segments and T-waves.  But there is also concordant STE in V2.  The STE in V1 is out of proportion to the S-wave, so V1 is also very worrisome (something I did not see on my phone).

It turns out that the conventional algorithm was also worried, and because of that, the patient was brought to the critical care area.  

Here is that interpretation of the conventional computer algorithm:

SINUS RHYTHM
INTRAVENTRICULAR CONDUCTION DELAY  [130+ ms QRS DURATION]
LEFT VENTRICULAR HYPERTROPHY AND ST-T CHANGE  [VOLTAGE CRITERIA PLUS ST/T ABNORMALITY]
POSSIBLE SEPTAL MYOCARDIAL INFARCTION , PROBABLY RECENT [30 ms Q WAVE IN V1/V2]
LATERAL MYOCARDIAL INFARCTION , PROBABLY RECENT [40+ ms Q WAVE AND/OR ST/T ABNORMALITY IN I/aVL/V5/V6]
***ACUTE MI*** 


Later, there was an overread by a Cardiologist, who removed the ***Acute MI***

SINUS RHYTHM. No Previous ECGs Available.

INTRAVENTRICULAR CONDUCTION DELAY  [130+ ms QRS DURATION]
LEFT VENTRICULAR HYPERTROPHY AND ST-T CHANGE  
ABN R PROGRESSION, ASMI OR LEAD PLACEMENT


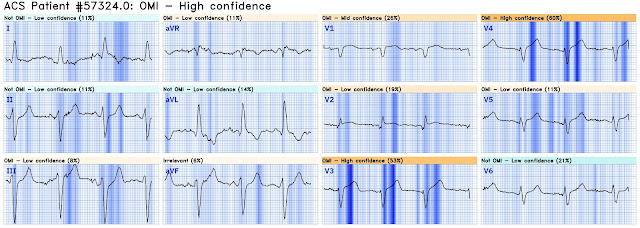
The providers ran the ECG through the Queen of Hearts:

If it is OMI, she does not see it.  
But she does label V2 as "OMI High Confidence" and V1 as "OMI Low confidence"

Like good physicians, they recorded another ECG at 10 min:

What do you think?


Now there is S-wave shortening in multiple precordial leads, rendering the T-waves hyperacute!  The T-waves have barely changed, but the S-waves have shortened and thus the T/QRS ratio is much larger (that is both T-wave amplitude and T-wave area under the curve).


Now it is diagnostic of OMI.


Here is the conventional algorithm:

SINUS RHYTHM

INTRAVENTRICULAR CONDUCTION DELAY  [130+ ms QRS DURATION]
ABNORMAL ECG 


And the Cardiology overread:

SINUS RHYTHM
INTRAVENTRICULAR CONDUCTION DELAY  [130+ ms QRS DURATION]
ABN R PROGRESSION, ASMI OR LEAD PLACEMENT
Comparison Summary: NO SIGNIFICANT CHANGE.
Compared with: 8/18/2024 6:08 AM 


This time neither see acute MI.


But the Queen of Hearts now sees it:

Notice that the dark blue in this explainability map tells you that she also is seeing the short S-wave and the hyperacute T-wave!


Click here to sign up for Queen of Hearts Access


Unfortunately, the team did not see it and they did not use the Queen on the 2nd ECG.  So it was not until 68 minutes that they recorded another ECG:

Now it is obvious with massive relative hyperacute T-waves in lead V4


The conventional algorithm diagnosed it:

SINUS RHYTHM
INTRAVENTRICULAR CONDUCTION DELAY  [130+ ms QRS DURATION]
LEFT VENTRICULAR HYPERTROPHY AND ST-T CHANGE  [VOLTAGE CRITERIA PLUS ST/T ABNORMALITY]
ANTEROLATERAL MYOCARDIAL INFARCTION , PROBABLY RECENT [40+ ms Q WAVE IN I/aVL/V3-V6]
***ACUTE MI*** 


And the Cardiology overread see the evolution but is not convinced:

SINUS RHYTHM
INTRAVENTRICULAR CONDUCTION DELAY  [130+ ms QRS DURATION]
LEFT VENTRICULAR HYPERTROPHY AND ST-T CHANGE  [VOLTAGE CRITERIA PLUS ST/T ABNORMALITY]
ANTERIOR AND LATERAL ST CHANGES
ABN R PROGRESSION, ASMI OR LEAD PLACEMENT.
Comparison Summary: ANTEROLATERAL ST CHANGES ARE NOW MORE PRONOUNCED, RATE DEPENDENT VS ISCHEMIC CHANGES 


Here is the Queen's diagnosis:


The cath lab was activated:


Culprit Lesion (s): Thrombotic 99% mid LAD stenosis with TIMI II flow 


Peak troponin not measured, unfortunately.  So we don't have a good idea how large the final infarct size was.


Echocardiography:

Normal left ventricular size with mild to moderately reduced LV systolic function; estimated LVEF is 44 %.

There is akinesis of the distal septum, anterior, apex, and distal inferior wall consistent with LAD territory ischemia or infarction.


How large is the infarct?


It is impossible to conclude from this that the infarct was VERY large, though it likely was very large since the time to intervention was long.  The area of insult was indeed large, but whether that area is all irreversibly infarcted or not would require MRI or a 6 week followup ("convalescent") echocardiogram, to see how much myocardium recovers (was only "stunned", not infarcted)


Post PCI EKG:

There is loss of anterior forces (Q-waves) which was not there before.  Probably significant infarction. 


Learning Points:

Serial ECGs are critical.  

Apply the Queen of Hearts to all serial ECGs.  

Occasionally, the conventional algorithm will beat the Queen

Cardiology overreads are not sensitive for OMI.


===================================

MY Comment, by KEN GRAUER, MD (8/26/2024):

===================================
I saw ECG #1 knowing only that, "a 60-something woman with no cardiac history presented with RUQ pain after eating spicy food."
  • Although clearly a history of abdominal pain suggesting cholecystitis — an ECG was appropriately done. This is an important reminder of the many ways other than chest pain, that acute coronary syndromes may present (See Talakic et al — Cardiovasc Med, 2023 and Tsipouras — Austral Fam Phys 37(8), 2008among many other sources). 

I've highlighted the KEY leads in the initial ECG that immediately drew my attention:
  • As per Dr. Smith — there is no way that the QRST complex in lead V2 can be normal (within the RED rectangle in Figure-1). There is abnormal ST segment coving — and — considering how small QRS amplitude is in this lead, there is marked ST elevation.
  • There is also a fragmented and a markedly widened initial Q wave in lead V2.
  • Finally — there is an "orphan" (ie, predominantly tall) R wave in lead V2 — which is distinctly different from all other chest leads (See below).

Are there Other Abnormal Leads in ECG #1?
The importance of recognizing that there can be no way lead V2 in ECG #1 is "normal" — is that it necessitates closer scrutiny of the remaining 11 leads.
  • The limb leads in ECG #1 show sinus rhythm with QRS widening and marked LAD (Left Axis Deviation). Although the frontal plane axis of -60 degrees is negative enough to be consistent with LAHB (Left Anterior HemiBlock) — with "pure" LAHB, the initial r waves in the inferior leads are generally not as wide as seen here — so a "nonspecific" conduction delay with marked LAD might be a better description of findings. That said — ST-T wave findings in the limb leads are non-diagnostic! Both LVH (which may be present here) and LAHB may be associated with the ST-T depression seen here in leads I and aVL.

  • BUT — Other Chest Leads in ECG #1 are not normal — especially the neighboring leads to lead V2. As per Dr. Smith — the relative amount of ST elevation in lead V1 is disproportionate to the tiny S wave depth in this lead (BLUE arrow in lead V1).
  • As we often emphasize — there normally will often be slight, gently upsloping ST elevation in lead V3 — but no J-point elevation is seen here in this lead (BLUE arrow in V3). The reason that I found this subtle finding in lead V3 important — is the subtle-but-real "extra" amount of ST elevation that is present here in lead V4, which makes for concerning findings in the first 4 chest leads. I would not normally expect this much ST elevation in lead V4 given the lack of any ST elevation in lead V3.

  • In Summary: I was not certain about there being an acute OMI from my initial assessment of ECG #1. That said — I thought the chest lead findings in leads V1-thru-V4 suspicious enough that I was glad a repeat ECG was obtained within the next 10 minutes!


What Can Be Learned from the Repeat ECG?
There are 2 important things to be learned from the repeat ECG:
  • #1 — There is no longer any question about acute LAD OMI! Today's case provides yet another example of how quickly definitive ECG changes can evolve — with directive to us, that we have a low threshold for repeating the ECG when concerned about a less-than-diagnostic initial ECG within the next 10-to-20 minutes. Continue repeating serial ECGs until such time that definitive management plans are made (sometimes meaning until you can convince the on-call interventionist to take the patient to the cath lab!).

  • #2 — The BEST way to get good at detecting early acute signs of OMI — is to routinely GO BACK to the initial tracing after ST-T wave changes have evolved. Doing so in Figure-1 facilitates recognizing how the subtle abnormalities I highlighted above in leads V1V3 and V4 have evolved to obvious diagnostic findings.

================================
An "Orphan" Tall R Wave in Lead V2?
Malposition of chest lead electrodes is common in general practice (Rehman and Rehman — Cureus 12(7):e9040, 2020). Because of placement issues with respect to breast tissue — optimal chest lead electrode placement is especially problematic in women — which leads to inconsistent, and all-too-often, technician dependent variations (Kligfield et al — AHA/ACC/HRS Scientific Statement, 2007).
  • While possible that electrode lead placement of lead V2 in today's case is correct — given that the most remarkably abnormal lead in today's initial ECG is lead V2 (as the only chest lead with a predominant R wave) — ensuring accurate electrode lead placement would seem essential for accurate diagnosis. BEST practice when suspecting potential lead misplacement of a critical lead in your assessment — is to verify lead placement, and immediately repeat the ECG.

PEARL: The isolated ECG finding of a surprisingly tall R wave in lead V2 that was seen in today's case — may not always be due to lead misplacement. Chugh et al report on this uncommon ECG curiosity as a potential manifestation of acute coronary occlusion (Cureus 9(4):e1200, 2017).
  • The mechanism proposed for the isolated finding of a tall R wave in lead V2 in a patient with acute chest pain is complex and not fully elucidated. It is thought to result from abnormal depolarization of an acutely ischemic area that leads to dispersion of repolarization times — such that unopposed positive forces facing an area of acute ischemia produce the isolated tall R wave in lead V2 (ie, repolarization dispersion during acute ischemia may lead to transient obliteration of the S wave — therefore leaving an unopposed R wave).
  • In the case study by Chugh et al — the tall R in V2 was transient, resolving after acute ischemia was controlled. In today's case — the tall R in V2 resolved after successful PCI.

  • Editorial Note: I have seen this ECG finding before — but did not previously realize that rather than lead misplacent, this might be an indication of acute OMI. I will as of now be "on the lookout" for more examples, that I'll be correlating with clinical events to see if this finding portends acute LAD occlusion.

Figure-1: Comparison between the first 2 ECGs in today's case.


Friday, August 23, 2024

Pre-syncope and a bizarre wide complex

Written by Magnus Nossen with edits by Grauer.

The following ECG is from a man in his 70s with a history of atrial fibrillation (AF). He presents to your emergency department with chest discomfort and recent episodes of presyncope.

Does this ECG show findings consistent with occlusion myocardial infarction (OMI)? If not — What else could be going on?


ECG #1


Shortly after the above ECG was recorded, the patient went into cardiac arrest. Cardiopulmonary resuscitation (CPR) was performed — and the patient woke up during resuscitation efforts before defibrillation was possible. Below are two print outs from the cardiac monitor showing onset and termination of the ventricular arrhythmia causing the cardiac arrest.


Initiation of polymorphic ventricular tachycardia


Spontaneous termination of polymorphic ventricular tachycardia

The above printouts from the cardiac monitor show two spontaneously-recorded 4-lead rhythm strips. The second lead from the top is lead V1. Note the unusual RBBB-type QRS morphology in this lead V1 both before and after the episode of PMVT. 

The patient again went into cardiac arrest. He was quickly defibrillated — and awoke soon after, at which time ECG #2 (shown below) was recorded. 

ECG #2

ECG interpretation: Both ECG #1 and ECG #2, as well as the rhythm strips show a bizarre looking QRS complex. There is a RBBB-like QRS morphology in the right sided chest leads. The QRS is very wide — at least 180ms ( = 4.5 small boxes in duration). There is significant ST elevation (most pronounced in right sided leads) — with T-wave inversion in affected leads. 
  • The ST-segment elevation is not typical of ischemia. Instead — the ECG is consistent with Brugada morphology. (Brugada morphology can be caused by a number of different conditions, of which Brugada Syndrome is the best known.). 

The figure below is a magnified view of leads V1-V3 from ECG #2. The brown arrows point to sinus P-waves. The vertical blue line marks the beginning of the QRS, while the red line marks the end of the QRS and the beginning of the ST segment. 


Case Continuation: This patient was on flecainide therapy (50 mg twice daily) for rhythm control of atrial fibrillation (AF). For "breakthrough" AF episodes — he would take an additional 100mg of flecainide. If this did not successfully convert his AF to sinus rhythm — the patient was told to go to the A&E (Accident and Emergency) Service for electrical cardioversion. 
  • On the day of the presentation — the patient had taken an extra 100mg flecainide tablet for "breakthrough" AF. 
  • Unfortunately — the flecainide precipitated a Brugada ECG pattern, that then degenerated to a series of PMVT (PolyMorphic VT) episodes, with need for resuscitation including multiple defibrillations. 

Serum potassium and magnesium levels were normal.
  • Ongoing treatment included multiple doses of IV magnesium sulfate during the first 24 hours after admission. In addition, the patient was buffered with sodium bicarbonate in an attempt to negate the sodium channel blocking effect of flecainide. 
The patient continued to have several brief episodes of PMVT which resolved spontaneously. 
  • It was decided to sedate and intubate the patient. Should multiple additional defibrillations be required — it would be safer and easier to accomplish this with the patient intubated and sedated. 

ECG #3 (shown below) was recorded on the 2nd hospital day. At this time, the patient was extubated, and had been stable for many hours without further VT. 


ECG #3

ECG above with atrial fibrillation. Persitent Brugada ECG pattern, here type 2.


Throughout the patient's hospital stay — troponin did not show a significant rise. Cardiac cath was normal. No more episodes of VT were noted.
  • The patient was diagnosed with Brugada Syndrome and an ICD was placed.
  • Genetic panel was negative (Only 20-30% of patients meeting the diagnostic criteria for Brugada Syndrome have a positive genetic test). There was however, a positive family history of SCD (Sudden Cardiac Death). 
  • Flecainide was discontinued — after which a Brugada-2 ECG pattern was intermittently seen, but there was no recurrence of the Brugada-1 pattern.

ECG #4 (shown below) was recorded during follow-up.


Brugada Syndrome (BrS) was first described in 1992. What began as an electrocardiographic curiosity has later gained much attention due to the increased risk of sudden death in young and otherwise healthy individuals. The syndrome has been the subject of great interest in both clinical and basic research.

Brugada Syndrome is a hereditary arrhythmogenic disorder (channelopathy) with characteristic electrocardiographic changes in the form of ST-segment elevation in the right-sided precordial leads (V1 – V3), and an increased risk of PMVT and VFib.
  • Inheritance is autosomal dominant. 
  • To date, a mutation has been detected in 20-30% of patients with BrS. 

A long list of factors that can cause a Brugada ECG pattern has been described, including certain medications, electrolyte imbalances and various drugs. 
  • Drugs that have been implicated include antiarrhythmic agents (ie, flecainide, verapamil and propranolol) — Antidepressants (ie, amitryptiline) — and drugs that increase vagal tone such as acetylcholine. 
  • A Brugada ECG pattern can also be seen after cocaine or alcohol use. 
  • NOTE: The ECG changes in Brugada syndrome can be dynamic. Many patients will intermittently have a normal ECG — only to unpredictably and spontaneously change to a Brugada ECG pattern. 
  • 3 Types of Brugada ECG patterns can be seen (See figure below). At times all 3 of these Brugada types may be seen in the same recording. 


Types of Brugada ECG pattern
 
(Figure above reproduced from LITFL -2022 )


  • Type 1 ECG: Coved ST segment elevation ≥2 mm which continues in T-wave inversion in lead V1 and/or V2.

  • Type 2 ECG: Saddleback shaped ST segment elevation with J point elevated ≥2 mm in leads V1 and/or V2

  • Type 3 ECG: Similar to type 2 criteria but the terminal portion of the ST segment is elevated <1 mm  
============================================

Regarding Today's CASE:
The patient in today’s case was diagnosed with Brugada syndrome (BrS) by having a positive family history of SCD, a Brugada-1 ECG pattern (after being put on flecainide)  and documented PMVT degenerating to ventricular fibrillation. An ICD (implantable cardioverter defibrilator) was placed.

Another clinical entity called Brugada Phenocopy (BrP) produces ECG patterns indistinguishable from that of Brugada Syndrome. The distinction between BrS and BrP can sometimes be a difficult one, especially as the typical ECG pattern in BrS can be intermittent — and genetic testing in BrS in the majority of cases does not reveal any causal genetic mutation. 

For example; A patient with true BrS can have a normal baseline ECG and then develop fever-induced Brugada-1 ECG changes. On the other hand, a patient without true Brugada Syndrome may, while febrile have a Brugada-1 ECG pattern that disappears when the fever wears off  this would qualify as BrP. The gene test for each of these patients could be normal. Unless there is further information like documentation of typical ventricular arrhythmia ssociated with BrS; syncope; or a family history of SCD the two patients are really indistinguishable.

Having a spontaneous Brugada-1 ECG pattern is an indication for further work up and referral to a specialist. Having a Brugada-1 ECG pattern in the setting of a possible trigger should prompt further investigation. Referral to a cardiologist who specializes in the work-up and treatment of patients with channelopathies is likely warranted in equivical cases where the distinction between BrS and BrP is difficult. Sodium channel blocker provocation test could be considered as part of the diagnostic work-up and  electrophysiological studies should be part of risk stratification. 

More related cases from this blog:

Brugada Phenocopy and Cocaine


Please see this 2022 case by dr Meyers for a discussion on Brugada phenocopy. 


============================================

Learning Points: 
  • Patients with Brugada syndrome may have a normal ECG. The characteristic ECG changes may occur only intermittently, or after a triggering stressor.

  • Always perform a follow-up ECG after prescribing or increasing the dose of a class 1a antiarrhythmic drug, as this may unmask the Brugada ECG pattern.

  • Distinguishing between BrS and BrP is a clinical challenge — making it difficult to determine which patients need ICD placement.


References


===================================

MY Comment, by KEN GRAUER, MD (8/23/2024):

===================================
I found today's case by Dr. Nossen to be especially interesting — given its combination of clinical features including the history of presyncopal episodes — then cardiac arrest from PMVT (PolyMorphic VT) degenerating to VFib shortly after arrival in the ED (Emergency Department) — presumed precipitation of the arrest by excess Flecainide — and initial ECGs with marked QRS widening, a RBBB pattern and a worrisome STEMI-mimic — with ultimate conclusion that the patient had Brugada Syndrome, leading to ICD placement prior to discharge.
  • For illustrative purposes in Figure-1 — I've reproduced the repeat ECG, obtained after defibrillation.

Figure-1: The repeat ECG in today's case, obtained after defibrillation.


MY Thoughts Related to Today's CASE:
I was not sure how to interpret the 2 initial ECGs in today's case. Both tracings contain significant baseline artifact (especially in lead II) — making it hard to identify atrial activity. I agree with Dr. Nossen that the underlying rhythm appears to be sinus — though this is difficult to confirm given variability in the R-R interval and uncertainty about atrial activity.


I focus attention in ECG #2, obtained following successful defibrillation (Figure-1):
  • Although the QRS complex in Figure-1 looks wide — the rhythm appears to be supraventricular. How wide the QRS is in ECG #2 is difficult to say — given the distinct notch that we see in lead V2 (RED arrows) — and the hard-to-define boundaries of the QRS in multiple leads.
  • I thought some form of RBBB conduction was present (given QRS widening with predominant R waves in V1,V2 — and wide terminal S waves in lateral leads I and aVL).
  • The markedly elevated ST segment shape in lead V1, with slow ST segment descent into deep terminal T wave inversion strongly suggests a Brugada-1 ECG pattern in this lead.
  • On the other hand — the notching in lead V2 that seemingly occurs at the J-point (RED arrows— with Shark-Fin-like ST elevation in this lead, looked more like an acute STEMI in this older patient who presented with chest discomfort.
  • Yet the reduced QRST amplitudes and unusual ST-T wave shape in lateral chest leads V4,V5,V6 — looked more like continuation of a Brugada pattern than like an acute stemi.
  • And, this patient was on Flecainide — and he apparently took some "extra" doses of this medication.

My Impression of ECG #2:
I thought a combination of factors was operative.
  • Serum K+ was normal — so hyperkalemia was not a factor.
  • Tun et al (EP Lab Digest 11(6), 2011) — and Aizawa et al (Circulation 128(10):1048-1054, 2013) — have shown that the QRS complex in anterior leads with a Brugada-1 ECG pattern may show complete or incomplete RBBB and/or no BBB. And when complete RBBB is present — it may mask the Brugada-1 pattern (and presumably vice versa) — which may explain some of my difficulty distinguishing between what represents a Brugada-1 pattern, RBBB conduction, and a possible acute anterior STEMI.
  • Added to the above — is the likelihood of excess Flecainide. As I reviewed in My Comment in the May 21, 2023 post in Dr. Smith's ECG Blog — excess Flecainide may result in marked QRS widening with bizarre morphology. Additional adverse physiologic effects of excess Flecainide may include: i) Prolongation of all intervals (PR-QRS-QTc); ii) Depressed contractility with resultant hypotension; iii) Depression of all major conduction pathways (in the AV Node; His-Purkinje system; and in the ventricles — leading to impaired automaticity)andiv) Predisposition to lethal arrhythmias (VT/VFib; Asystole). Whether the patient in today's case took enough "extra" Flecainide to produce any or all of these effects is unknown.

  • NOTE: As per follow-up from Dr. Nossen — subsequent evaluation ruled out acute infarction. This left a combination effect from RBBB-like conduction — Brugada Syndrome — possible "memory effect" (from the VT/VFib and defibrillation) — and excess Flecainide — as explanatory factors for the "picture" presented in ECG #2


Final LEARNING Points:
  • The gamut of Brugada ECG patterns continues to expand. Many factors may explain the variability in these Brugada ECG patterns — including presence or absence of RBBB conduction — the possibility of associated infarction — potential Brugada precipitants (such as Flecainide in today's case) — and the timing of the ECG recording, given the dynamic nature of Brugada ECG patterns.
  • Today's case differs from most patients with Brugada pattern ECGs that we have presented in Dr. Smith's ECG Blog — in that despite whatever effect Flecainide use may have had, today's patient was diagnosed with Brugada Syndrome, with resultant ICD placement prior to discharge.
  • In contrast — Most patients on this ECG Blog with Brugada patterns have had Brugada Phenocopy (See My Comment at the bottom of the page in the May 5, 2022 post — the November 25, 2022 post — and the July 22, 2023 postamong other cases of Brugada Phenocopy). The "good news" about Brugada Phenocopy — is that correction of the underlying condition may result in resolution of the Brugada-1 ECG pattern (with a far better prognosis compared to patients with true Brugada Syndrome).
  • Among conditions other than Brugada Syndrome that may produce a Brugada-1 ECG pattern include (among others) — acute febrile illness — variations in autonomic tone (as may occur with syncope) — hypothermia — ischemia or infarction — cardiac arrest — electrolyte disorders (especially hyperkalemia — but also hypokalemia/hyponatremia) — and various medications. 
  • The 2 most common precipitants of Brugada Phenocopy that we've seen on Dr. Smith's ECG Blog have been: i) Acute febrile illness; andii) Hyperkalemia.

  • Finally — Patients with a Brugada pattern ECG will often be referred from the ED for further evaluation. Definitely refer these patients IF worrisome symptoms are associated with the abnormal ECG pattern (ie, If the patient had syncope-presyncope and/or malignant arrhythmias) and/or if there is a positive family history of sudden death or malignant arrhythmia. Such patients are clearly at higher risk and merit specialized testing by clinicians experienced in the intricacies of Brugada Syndrome (and whether ICD placement should be recommended).
  • That said — Recent data suggest that in the absence of a positive family history and worrisome symptoms — development of a Brugada-1 ECG pattern only on provocative drug testing is associated with a very low event rate and a much better longterm prognosis compared to patients who develop a spontaneous Brugada-1 ECG pattern (Gaita et al — Circulation 148(20): 1543-1555, 2023 — Wilde and Saenen — Editorial: Circulation 148(20): 1556-1558, 2023 — Krahn et al — JACC 8(3):386-405, 2022 — Sayed et al — StatPearls, 2023).


Recommended Resources