Friday, May 31, 2024

Is all this "ST Depression" due to ischemia?

Written by Magnus Nossen, with some edits by Smith

This ECG was transmitted electronically by EMS for evaluation. The patient is a 70 something female with chest discomfort and dyspnea. How would you interpret the ST changes seen in this ECG?  Will you accept this patient for emergent coronary angiogram based on the ECG changes? Does the ECG represent STEMI-negative OMI findings? How would you mange this patient?


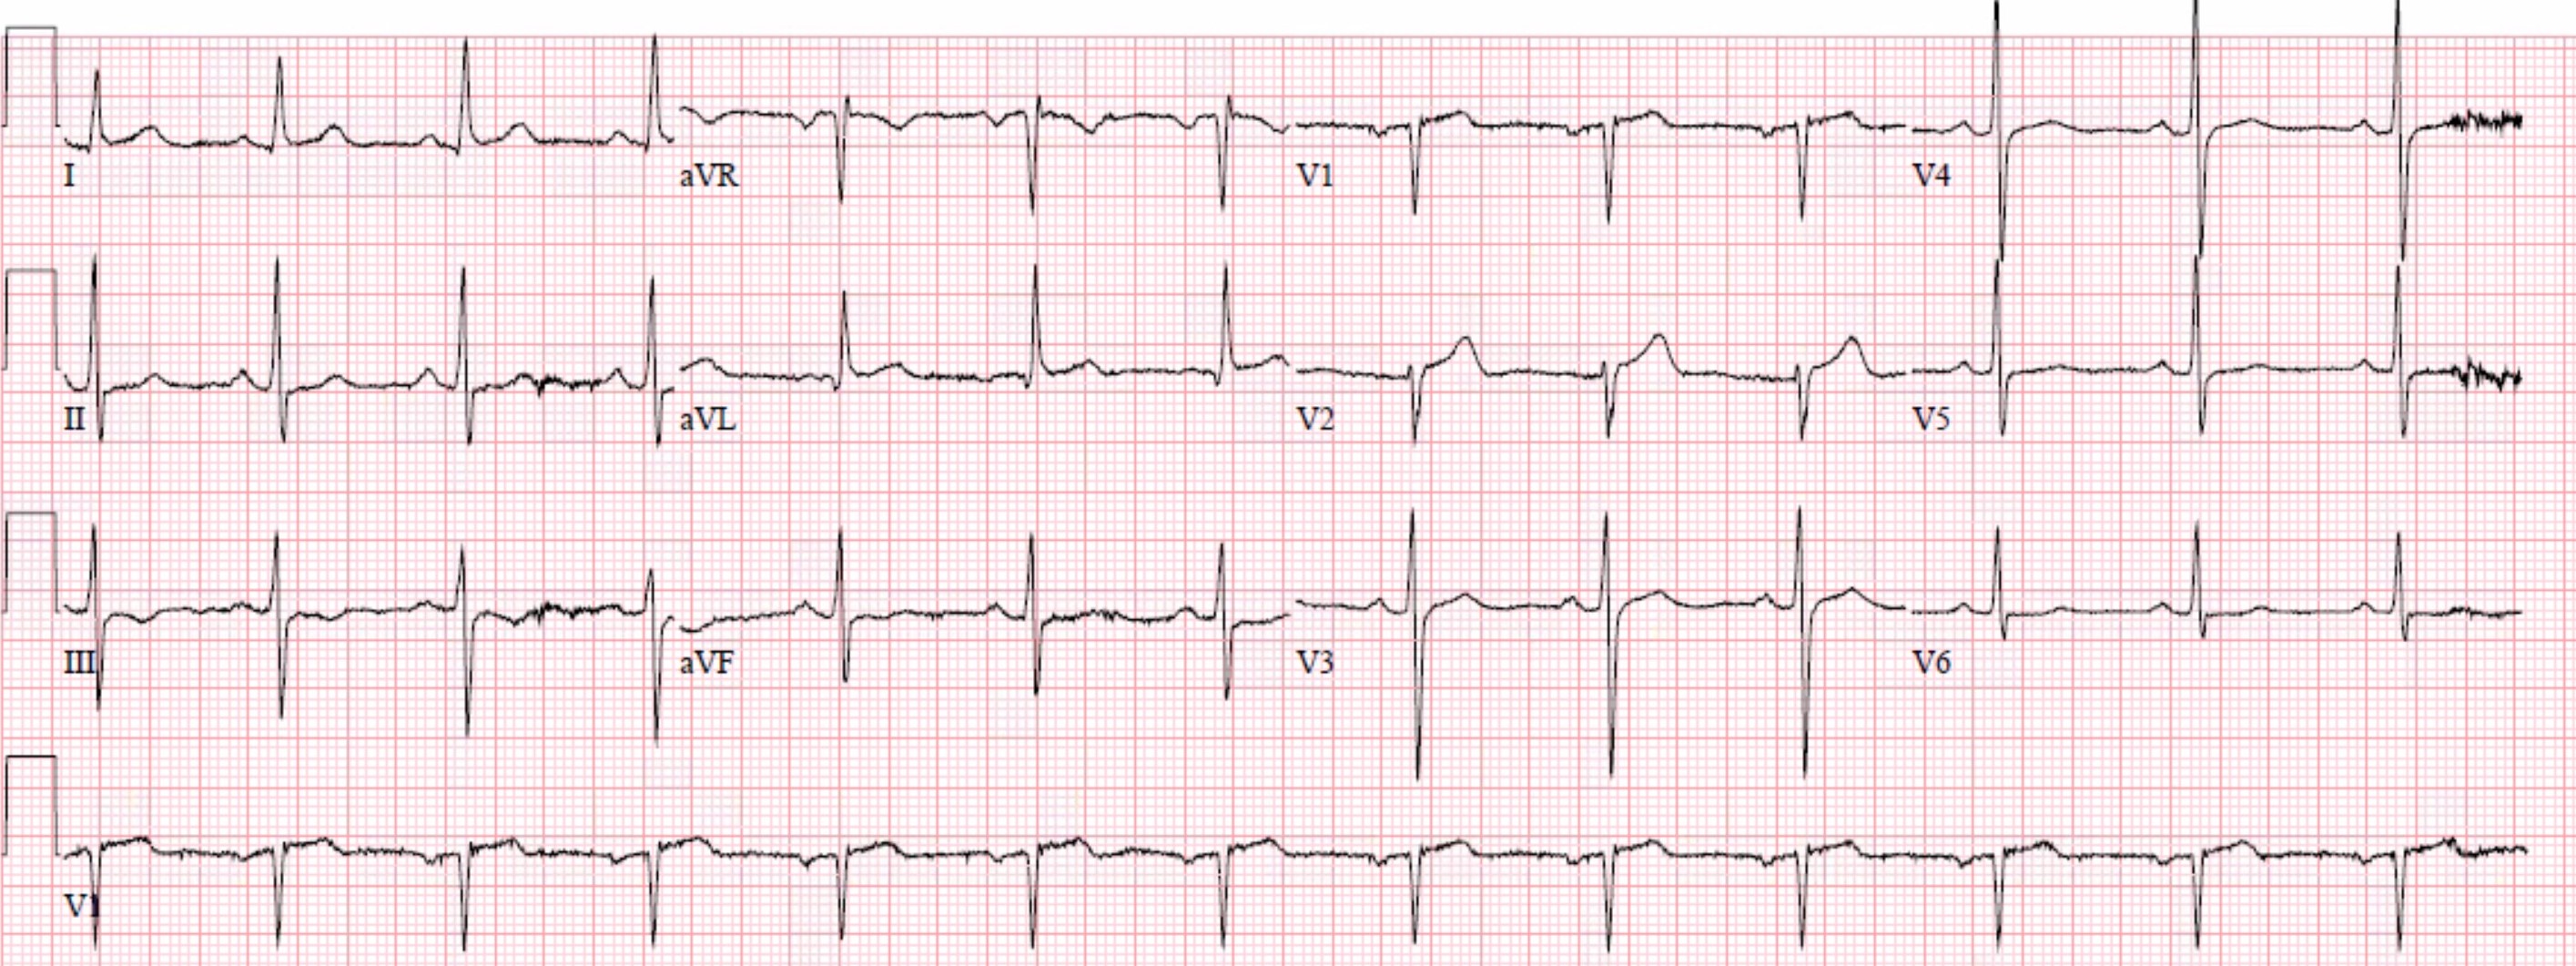
The ECG shows sinus rhythm with a ventricular rate just below 100 bpm. There is slight concave ST segment depression in the inferior leads with trace ST elevation in lead aVL not meeting millimeter criteria. Of note also is delayed R-wave progression in the anterior leads without significant Q-waves. P-waves are prominent. It would be reasonable to evaluate this patient in a PCI center as you have to prove that these ECG changes are not ischemic. I accepted the patient for evaluation in our PCI facility but did not activate the cath lab as I did not think the ECG changes represented OMI.


Smith: The P-wave in lead II is extremely prominent, suggesting right atrial hypertrophy and possible high right sided pressures.


ST depression has a variety of different causes. The cause can be primary, (i.e ischemia) or it can be secondary to abnormal depolarization (e.g from preexcitation, BBB, paced rhythm, LVH etc). 


Furthermore, ST depression can be caused by drugs (e.g digoxin) or electrolyte imbalances such as hypokalemia or hypomagnesemia. Even certain rare hereditary arrhythmogenic disorders like Bundgaard syndrome can have ST depression in the resting ECG.


Discussion: The ECG in today's case does not have typical ST depression vector of diffuse subendocardial ischemia. The ST vector in subendocardial ischemia (SEI) usually has the largest amount of ST depression in leads II and V5, towards the apex of the heart. (ST depression vector towards II and V5).  In fact, the ST depressions in the ECG in today’s case are most pronounced in the leads with the largest P waves (!) and not in the leads with the largest amplitude QRS complexes. This is a very strong indicator that the ST-depression is not ischemic but rather related to the P wave size and vector.  


The patient was evaluated immediately upon arrival. Physical exam was notable for  wheezing bilaterally. She had known severe COPD. Bedside echo was without wall motion abnormality. 


Putting all the findings together; dyspnea, slight tachycardia, delayed R-wave progression, prominent lateral S waves and ST depression maximal where the P waves are largest all point toward pulmonary disease as the cause of the ECG findings.


Atrial repolarization is usually not noticed on the ECG. However, if atrial enlargement occurs, atrial repolarization may become prominent and may cause ST segment changes. Figure A below shows the relationship of the Ta wave to normal ST depression. In figure B below I have superimposed a red dotted parabolic line on the QRS complexes and ST segments of leads aVL and aVF to show how the atrial repolarization wave affects the ST segments.


Figure A


Figure B


How did the QoH perform on this ECG? 


It is quite impressive how the interpretation is NOT OMI with high confidence. Above you can see the explainability feature. The AI model does not react to any of the ST segments in this ECG. 


You too can have the Queen of Hearts AI model 


Learning points:


  • The ECG often can give clues to pulmonary disease

  • Atrial repolarization wave (Ta wave) can mimic ischemia. 

  • ST depression has a variety of different causes other than ischemia.


===================================

MY Comment, by KEN GRAUER, MD (5/31/2024):

===================================
I love today's case by Dr. Nossen — because it provides a superb example in which knowing nothing more than that the patient presented not only with chest pain — but also with acute dyspnea — enabled me to make an immediate diagnosis of severe pulmonary disease rather than acute coronary disease.
  • I count among my favorite sayings the following: "Experience is Errors"Much of what I have learned over the decades that I've been studying ECG interpretation, is the result of "errors" committed that I have learned from. And so, I'll never forget as an intern how I assumed after numerous pulmonary edema cases — that the dyspneic patient in front of me was yet one more patient in need of diuresis and other standard left-sided heart failure measures. misdiagnosed that patient's ECG — which was "trying" to tell me that rather than left-sided heart failure — the problem was right-sided failure from longstanding severe pulmonary disease. I have tried not to make that mistake again.

  • We do not often see RVH on ECG in adults. As a result — it is easy to overlook this important clue to right-sided heart failure. This essential clinical message is superbly conveyed by today's case.

For clarity in Figure-1 — I have labeled a series of subtle ECG findings, that taken together in a patient who presents with acute dyspnea — should lead you to immediately suspect longstanding, severe pulmonary disease rather than acute coronary disease as the most likely explanation for today's ECG.


Figure-1: I’ve labeled findings potentially consistent with RVH — from the initial ECG in today case.


The ECG Diagnosis of RVH / Severe Pulmonary Disease:
By way of review — I've excerpted portions of My Comment from the February 12, 2023 post in Dr. Smith's ECG Blog. 
  • Among the most challenging of ECG diagnoses to make is RVH (Right Ventricular Hypertrophy). By saying this — I am not referring to obvious cases of ECG RVH — in which the QRS is of normal duration (ie, No RBBB and no WPW) — and there is marked RAD (Right Axis Deviation) + predominant R wave in lead V1
  • KEY Point: The extreme ECG findings of marked RAD and predominant R wave in lead V1 are usually not found in adults with RVH until late in the course — and sometimes not even then. Instead — I am referring to  less obvious, but still clinically significant forms of RVH that are all-too-easy to overlook!

PEARL #1: Consider the following:
  • RVH is much easier to diagnose in infants and young children than in adults. This is because the relative size (and mass) of the RV (Right Ventricle) compared to the LV (Left Ventricle) — is much greater in infants and young children compared to adults. In contrast, by the time adulthood is reached — the normal LV may be up to 3X as thick (with up to 10X the mass) of the normal RV. As a result — marked increase in RV size is usually needed in adults — before a predominant R wave will be seen in lead V1.
  • In contrast — an R>S ratio (ie, R wave height greater than S wave depth) in lead V1 — remains a common and normal finding in children up until ~5 years of age!
  • Similarly (ie, because of the normal LV predominance) — marked RAD in the frontal plane is a relatively late sign of RVH in adults.

PEARL #2: Think of the ECG diagnosis of RVH as a detective” diagnosisNo single clue solves the mystery. Instead — determination of RVH is made by deduction (ie, by identifying a combination of ECG findings in a patient with a clinical history consistent with RVH).
  • I’ve reviewed My Take on the ECG diagnosis of RVH on a number of occasions in Dr. Smith’s ECG Blog (See My Comment at the bottom of the page in the March 6, 2022 and September 1, 2020 poststo name just 2)
  • As review — my user-friendly summary of ECG RVH appears in the ADDENDUM below (in Figures-2-thru-5).


How Does this Apply to Today’s Case?
For clarity in Figure-1 — I’ve labeled the initial ECG shown in today’s case.
  • PEARL #3: As is often the case — the History is KEY! Today's patient presented not only with chest pain — but also with dyspnea. Later in the case we learned that she indeed had longstanding severe pulmonary disease — therefore consistent with a patient having potential RVH.

  • Marked RAA (Right Atrial Abnormalityis present! The tall, peaked and pointed P waves in each of the inferior leads (that easily surpass the ≥2.5 mm tall voltage criteria) — clearly establishes the presence of RAA, which in a patient presenting with acute dyspnea indicates right atrial enlargement.  
  • PEARL #4: There is only 1 condition in medicine that produces right atrial enlargement without also producing RVH. That condition is tricuspid stenosis, which is rare. Therefore, the ECG finding of RAA that is not the result of slender body habitus — provides an important presumptive clue to the presence of RVH.


Other ECG findings consistent with RVH in Figure-1:
Additional ECG findings in support of RVH in today's case are much more subtle than the marked RAA that I describe above. This illustrates the KEY concept noted above in PEARL #2 — namely, that RVH on ECG will often only be recognized as a "detectivediagnosis!
  • The Axis: While frank RAD is not present — the normal QRS complex in lead I is positive. Low amplitude of the R wave that we see in lead I of Figure-1 — in association with an S wave of equal (if not greater surface area) compared to the R wave in this lead is not a usual finding.
  • S Waves in Leads I, II, and III: This finding is related to the mean QRS axis in today's tracing. Seeing S waves in each of the standard limb leads (as we see in Figure-1) of itself suggests significant pulmonary disease — as does the resultant, almost indeterminate QRS axis.
  • Relatively Low Voltage: While strict criteria for low voltage are not present (ie, All 6 limb leads ≤5 mm) — overall QRS amplitude looks reduced in the limb leads of Figure-1.
  • Persistent S Waves: R wave amplitude normally increases as one moves across the precordial leads (as electrical activity moves toward the left where the larger LV lies). R wave amplitude usually peaks in V4 or V5 — and then drops off (in V5,V6). Normally, there is not any S wave at all in V5,V6 — since by this time in the depolarization process, all electrical activity is traveling leftward. If more than tiny S waves are still present in V5,V6 — this may be the result of significant ongoing rightward activity.
  • Lead aVR: Acute RV overload may be reflected on ECG by ST elevation in lead aVR (especially when the R wave in lead aVR is tall, as it is in Figure-1).

To EMPHASIZE: In isolation — none of the ECG findings mentioned above would alone be diagnostic of RVH. However, when taken together in this patient presenting with acute dyspnea — the combination of these ECG findings is strongly suggestive of significant pulmonary disease (and probable RVH)


==================================
Beyond-the-Core:

PEARL #5: In My Comment of the June 17, 2018 post of Dr. Smith's ECG Blog — I noted the presence of Schamroth's Sign, in which the presence of an almost "null vector" in standard lead I (ie, P wave, QRS complex and T wave all of very low amplitude) — as a low sensitivity, but occasionally very useful subtle indicator of longstanding and severe pulmonary disease. 
  • While fully acknowledging that the QRST complex in lead I of Figure-1 does not satisfy the very low millimeter size criterion for Schamroth's Sign — Isn't this QRST complex in lead I quite small? I seized upon this subtle finding as yet another clue to the likely diagnosis of severe pulmonary disease rather than OMI in today's case.

===============================

ADDENDUM:
  • “My Take” on the ECG diagnosis of RVH appears in the following 4 Figures (from Grauer K: ECG-2014 e-Pub)


Figure-2: ECG Criteria for RVH.


Figure-3: ECG Criteria for RVH (Continued).


Figure-4: ECG diagnosis of pulmonary disease and RVH in children.


Figure-5: Example tracings of RVH.


Wednesday, May 29, 2024

Quiz post: two patients with chest pain. Do either, both, or neither have OMI?

Written by Pendell Meyers

Two patients with acute chest pain. 

Do either, neither, or both have OMI and need reperfusion?


Patient 1:


Patient 2:


Patient 1:

A man in his 40s with minimal medical history presented with acute chest pain radiating to his R shoulder.

Triage ECG:


Three serial troponins were all undetectable.

Here is a later ECG during the visit:

Slightly different, with less TWI in inferior leads this time.


He was discharged home.


Patient 2

A man in his 50s with history of CAD and prior PCI, diabetes, presented with acute constant chest pain for the past few hours. Described as a dull ache, 6/10 in severity.


Triage ECG:


It was interpreted as lateral STEMI, and he was sent to the cath lab, where the angiogram showed unchanged CAD from known prior, with no acute culprit.

His disease included 70% prox LAD, 80% distal LAD, 10% in-stent stenosis in the distal LCX, 70% OM1, 70% OM2, and 60% prox RCA.

Three troponins were undetectable.

Here is another ECG later in his stay:


A prior ECG was found:


Compare the ECGs above with two cases of true high lateral OMIs:


The Queen identifies both of these accurately as OMI with high confidence and explains why:


How can we identify the top 2 above as false positives?

1) Use the Queen of Hearts

2) It is very difficult to explain and requires a lot of pattern recognition experience and skill.  Dr. Smith identified both correctly, and so did the Queen.

3) Dr. Smith explanation: all I can say is that there is plenty of QRS voltage and that the ST segments, though elevated, have a lot of upward concavity or reciprocal downward concavity.  The ST depression in V4-V6 makes this particularly difficult and hard to ascertain that it is a mimic!

4) Compare with the bottom 2 cases: 

 Top: small voltage QRS and straight ST segments

Bottom: ischemic appearing ST Depression in V2-V6 


See these other relevant cases:

Quiz post: do either or both of these patients have high lateral OMI / South African flag sign?


True Positive ST elevation in aVL vs. False Positive ST elevation in aVL


Even when the story is obvious, with intractable pain, the STEMI paradigm can cause preventable delays


See other "Quiz Posts":


Click here to sign up for Queen of Hearts Access


===================================
MY Comment, by KEN GRAUER, MD (5/29/2024):
===================================
The expertise of Drs. Smith & Meyers in assessing ECGs for the likelihood of “OMI or no OMI” is truly impressive — and it is through their programming that QOH has obtained “her expertise”. Ongoing updates by Drs. Smith & Meyers will result in ever increasing accuracy of QOH.

  • For clarity in Figure-1 — I've reproduced the initial ECGs from Patients #1 and #2 in today's case. 

Figure-1: The initial ECGs for Patients #1 and #2 in today's case.


The above said — I’ll offer the following perspective:

  • What really “counts” in a patient who presents to the ED with new CP is whether or not there is an acute, ongoing OMI for which prompt cath with reperfusion will save myocardium (and potentially save a life). This means that some of the patients who present with new CP may have underlying coronary disease from prior events (ie, the multi-vessel disease of Patient #2 in today’s case).
  • While I was skeptical after seeing the ECGs in Figure-1 that the 2 patients in today’s case were having an acute OMI (for reasons similar to those highlighted by Dr. Smith above) — I fully acknowledge that I was not 100% certain there was no OMI after seeing the initial tracings. And, we want to get as close to 100% certainty as possible — so additional evaluation (ie, troponins, serial tracings, comparison with prior tracings — and at times, cardiac catheterization) — are all at times appropriate until you can be more certain.
  • Although not perfect — the QOH application can be reassuring. Together with the illustration of numerous cases on Dr. Smith’s ECG Blog — our hope is to facilitate rapid identification when acute OMI can be immediately diagnosed by history and the initial ECG. And, although prudence is advised until one attains that greater certainty that an acute event is not ongoing — our hope is that some diagnostic cardiac catheterizations that are not needed can be avoided by the tips and insights provided on this ECG Blog

  • That said, today’s cases are tough — because both initial ECGs manifest ST elevation with ST depression in oppositely-directed leads — and both manifest taller-than-expected T waves in lead V2 — as well as some unexpected ST depression.
  • LVH may further complicate assessment for OMI. As per Dr. Smith — criteria for LVH are satisfied in Patient #2 (ie, R > 20 mm in lead II). Although voltage criteria may fall a bit short for LVH in Patient #1 — the ST-T wave in lead V6 looks typical for LV “strain”. (For more on LVH — See My Comment in the June 20, 2020 post in Dr. Smith’s ECG Blog)

  • Bottom Line for Me: Were I in the ED — I would not have been certain from just the initial ECG that there was no OMI, until I obtained more information. I learn from knowing Drs. Smith, Meyers & QOH were certain sooner than I was.


Our thanks to Dr. Meyers for presenting today’s case. It’s always helpful to be “put to the test” — and then provided with insightful follow-up.


Monday, May 27, 2024

Chest pain: Are these really "Nonspecific ST-T wave abnormalities", as the cardiologist interpretation states?

Written by Jesse McLaren, with a very few edits by Smith


A 60-year-old presented with chest pain. The ECG did not meet STEMI criteria, and the final cardiology interpretation was “ST and T wave abnormality, consider anterior ischemia”. But are there any other signs of Occlusion MI?


There’s only minimal ST elevation in III, which does not meet STEMI criteria of 1mm in two contiguous leads. But STEMI criteria is only 43% sensitive for OMI.[1] But there are multiple other abnormalities that make this ECG diagnostic of Occlusion MI, localized likely to the right coronary artery:

1. AV block, which can be a transient complication of RCA occlusion since it perfuses the AV node [2]

2. Inferior hyperacute T waves, which have been added to the 2022 ACC consensus on chest pain as a “STEMI equivalent”[3]

3. Reciprocal ST depression and T wave inversion in aVL, which is 99% sensitive for inferior OMI.[4]

4. Ischemic ST depression V2-4, which is 97% specific for posterior OMI[5]


So this patient with chest pain has an ECG that is diagnostic of inferior and posterior OMI complicated by 3rd degree AV block, likely representing an RCA occlusion. (See Ken Grauer discussion below for more on AV blocks in today's case).

These findings are diagnostic even without comparison with an old ECG.  

But they are even more striking when you do compare with the old one: 


Here’s a side-by-side comparison of the inferior leads from the baseline ECG (left) and new ECG (right) showing hyperacute T waves with reciprocal change in aVL:


The hyperacute T waves are not tall in absolute terms (only 4mm) but they are tall relative to the QRS, broad based, bulky and look inflated. The T wave inversion in aVL is not necessarily abnormal because it is concordant with the negative QRS, but it is huge relative to the QRS, reciprocal to the hyperacute T wave in III


The ECG also shows how reciprocal change can be the more obvious finding of OMI. Here are leads aVL and V2 of the new ECG, flipped upside down:


With the leads flipped, aVL has an obvious hyperacute T wave larger than the entire QRS complex, while V2 has ST elevation.

If simply flipping leads upside down can show signs of occlusion, then there’s a problem with a paradigm that dichotomizes ST segment deviation between elevation and depression as seen on the ECG paper, because they can reflect the same current of injury in the patient from a different view.[6] When there’s a current of injury towards a territory it produces reciprocal change in its wake, which is sometimes more obvious than the territory of injury (for inferior OMI) and is sometimes the only sign on the 12 lead (for posterior OMI). AVL and V2-V3 are oriented to reflect the reciprocal change to inferior and posterior OMI respectively – but this helpful information is disregarded by STEMI criteria because these leads manifest ST depression instead of ST elevation. Hence the first ECG was labeled 'anterior ischemia' based on ST depression, rather than identifying this as reciprocal from posterior OMI.


With a “STEMI negative” ECG and ongoing chest pain, the ECG was repeated in 10 minutes:


Now the AV block has improved from 3rd to 1st degree. But there are ongoing inferior hyperacute T waves, reciprocal TWI in aVL, and ischemic STD in V2-3. The final interpretation is now “nonspecific ST abnormality” based on STEMI criteria, but it is still very specific for infero-posterior OMI. There’s also more greater reciprocal change - here’s aVL flipped, with a T wave that now towers over the tiny QRS:


But now the patient has now had serial ECGs which are “STEMI negative”. So a troponin level was sent: 90 minutes later it returned at 250ng/L (normal <26 in males and <16 in females). Then the ECG was repeated again:


Now the ECG just barely meets STEMI criteria, along with more obvious hyperacute T waves.

A 15 lead was done 7 minutes later:


Now greater inferior ST elevation, and some convex ST segment in V5-6. Posterior leads V8-9 are also elevated, but this only confirms the posterior OMI that was seen on the first ECG.

Here’s a view of the last ECG showing V2-3 flipped (on the left) compared with V8-9 (right) :


The flipped V2-3 show clear ST elevation and hyperacute T waves, while V8-9 have lower voltage and proportionally less obvious ST/T changes which add no additional value.

Since the ECG now meets STEMI criteria, a code STEMI was activated. There was a 99% mid RCA occlusion, and peak troponin was greater than 25,000ng/L (upper limit of assay)

Discharge ECG showed resolution of changes, and subtle inferior reperfusion T wave inversion:


This patient received the standard of care under the current STEMI paradigm: serial ECGs for ongoing chest pain, and waiting for troponin level for "STEMI negative" ECGs. But this led to a 90 minute delay to reperfusion for an occlusion that could have been identified on the first ECG. This is typical of the current paradigm, as OMI findings can identify occlusions a median of 1.3 hours earlier.[7] 


Earlier intervention could have saved myocardium possibly a huge amount of myocardium, and could easily have been done if the mind set and approach was OMI-NOMI rather than STEMI/NSTEMI and if the Queen of Hearts app was used.


There is now AI trained to identify OMI.[8] If this been available in this case, the diagnosis could have been made on the first ECG, and saved 90 minutes of reperfusion delay. 

Here’s the Queen of Heart’s interpretation on the first ECG, along with explainability:


Even without comparison to the prior, and without any reference to the minimal ST elevation in III, the Queen identifies OMI with high confidence based on inferior hyperacute T waves, reciprocal T wave inversion in aVL, and anterior ST depression. She is not bothered by lead orientation, and is equally comfortable identifying OMI by the reciprocal hyperacute T waves or in the reciprocal ST depression.


Click here to sign up for Queen of Hearts Access


Take away

1. STEMI criteria misses the majority of OMI, and leads to delayed reperfusion for STEMI(-)OMI

2. Findings of RCA occlusion may include AV block, subtle inferior ST elevation, hyperacute T waves, reciprocal STD/TWI in aVL, and anterior STD from associated posterior OMI

3. Reciprocal change can be more obvious than the primary injury, and posterior leads rarely add any additional value to the ischemic STDmaxV1-4 that can be seen on 12 lead

4. OMI ECG findings can lead to rapid diagnosis, and can be widely disseminated through AI


References

1. De Alencar Neto. Systematic review and meta-analysis of diagnostic test accuracy of ST-segment elevation for acute coronary occlusion. Int J Cardiol 2024

2. Nikus et al. Conduction disorders in the setting of acute STEMI. Curr Cardiol Red 2021

3. Kontos et al. 2022 ACC expert consensus decision pathway on the evaluation and disposition of acute chest pain in the emergency department: a report of the American College of Cardiology solution set oversight committee. J Am Coll Cardiol 2022

4. Bischof et al. ST depression in lead AVL differentiates inferior ST-elevation myocardial infarction from pericarditis. Am J Emerg Med 2016

5. Meyers et al. Ischemic ST-segment depression maximal in V1-4 (versus V5-6) of any amplitude is specific for occlusion myocardial infarction (versus nonocclusive ischemia). J Am Heart Assoc 2021

6. Phibbs and Nelson. Differential classification of acute myocardial infarction into ST- and non-ST segment elevation is not valid or rational. Ann Noninvasive Electrocardiol 2010

7. Meyers et al. Accuracy of OMI ECG findings versus STEMI criteria for diagnosis of acute coronary occlusion myocardial infarction. IJC Heart and Vasc 2021

8. Herman et al. International evaluation of an artificial intelligence-powered electrocardiogram model detecting acute coronary occlusion myocardial infarction. Eur Herat J Digital Health 2024


===================================

MY Comment, by KEN GRAUER, MD (5/27/2024):

===================================

Superb presentation by Dr. McLaren on a case that clearly could have been (should have been) diagnosed as acute infero-postero OMI based on the initial ECG.
  • The fact that this ECG was initially diagnosed as showing, “ST-T wave abnormality — consider anterior ischemia” — means that the provider failed to recognize the AV block. The reason this happens is simply because of a failure to spend the 2-3 seconds it takes for an ‘educated eye” to routinely scan the long lead II rhythm strip, looking to see if there are upright P waves that precede each QRS complex with a fixed PR interval. Try this. Isn’t it easy to see in no more than 2-3 seconds that regular P waves do not precede each QRS with a fixed PR interval in today’s initial ECG?

  • PEARL: If you do not want to overlook 2nd- and 3rd-degree AV Blocks — Make it a habit as soon as you are given any ECG to always spend your first 2-3 seconds (which is all it should take) ensuring that P waves are present and are (or are not) related to neighboring QRS complexes
  • As per Dr. McLaren — the rhythm in today’s initial ECG is 3rd-degree ( = complete) AV Block — here at the AV Nodal level, given the narrow QRS complex of ventricular beats at an escape rate ~50/minute (well within the 40-60/minute usual range for AV nodal escape).
  • PEARL: In my experience — the BEST clue to distinguish 2nd-degree from 3rd-degree AV block — is that most of the time with 3rd-degree, the ventricular response will be regular. This is because most of the time escape rhythms are regular (or at least fairly regular). IF instead of being regular — you see a ventricular beat that clearly occurs earlier-than-expected — the chances are that the degree of AV block is not complete.
  • The initial ECG in today’s case is complete AV Block beause: i) The atrial rhythm is quite regular; ii) The ventricular rhythm is quite regular; andiii) P waves are not related to neighboring QRS complexes (ie, P waves “march through the QRS complexes” — which is easily established by noting the constantly changing PR interval) — andiv) No P waves are conducted despite having adequate chance to do so (ie, While in today’s initial ECG, we would not expect those P waves with a short PR interval to conduct — there is more than adequate opportunity for those P waves occurring in the middle of the R-R interval to conduct in this tracing, yet they fail to do so).
  • As per Dr. McLaren — it is common to see AV Block in patients with acute inferior, posterior and/or infero-postero OMI. The “culprit” artery will almost always be either the RCA or LCx, as either vessel may supply the AV node (the “culprit” being the RCA in today’s case)PEARL: Even if providers failed to appreciate the diagnostic features of acute infero-postero OMI in today’s initial ECG —The failure to spend those 2-3 seconds surveying the long lead II rhythm strip should have prompted recognition that the chest lead ST-T wave depression was unlikely to be the result of “anterior ischemia” — and much more likely to reflect acute infero-postero OMI — since 2nd- and/or 3rd-degree AV block with a narrow QRS is common with infero-postero OMI — but it is rare with anterior ischemia/OMI.

  • PEARL: When AV block with a narrow QRS occurs in association with acute inferior and/orposterior OMI — there is often a step-wise progression and/or regression (ie, from 1st-degree — then to 2nd-degree, Mobitz Type I — then to 3rd-degree AV block at the AV nodal level — or — from 3rd-degree — to Mobitz I 2nd-degree — to 1st-degree, IF the patient began with complete AV block). As per Dr. McLarren, the “good news” — is that most of time, the associated AV block will resolve, especially if there is prompt reperfusion of the “culprit” artery.

Playing “Devil’s Advocate”: In view of this last Pearl — I suspect that the 2nd ECG in today’s case (done just 10 minutes after the 1st ECG) represents 2nd-degree 2:1 AV Block of the Mobitz I Type — and not just sinus rhythm with 1st-degree AV Block.
  • We often see both 1st-degree AV block (ie, of conducted beats) — and 2nd-degree Mobitz I AV block together!
  • The atrial rate in today’s 1st ECG is just under 100/minute — and the junctional escape rate is ~50/minute.
  • The ventricular rate remains the same ~50/minute in the 2nd ECG — but for this to be sinus rhythm with 1st-degree, the atrial rate would have to have decreased from just under 100/minute to 50/minute over a 10-minute period.
  • The very subtle “extra” widening of the T wave peak in the inferior leads, and of the inverted T wave in lead aVL occurs at an appropriate moment in the R-R cycle to potentially “hide” a 2nd P wave (especially if there is some ventriculophasic sinus arrhythmia — as there so commonly is with 2nd-degree AV block). And, if a 2nd P wave is “hiding” within each T wave — this would represent an atrial rate that is still just under 100/minute — instead of having to postulate that the atrial rate so rapidly decreased to ~50/minute.
  • The atrial rate in the 3rd ECG is clearly much faster than 50/minute.
  • And, the reason I so carefully considered the possibility of 2:1 AV block in today’s 2nd ECG — is that as per the above Pearl, it is common for 3rd-degree AV block at the AV Nodal level to resolve with stepwise regression (ie, passing from 3rd-degree — to 2nd-degree, Mobitz I — and then to 1st-degree, before finally returning to normal sinus conduction).

  • To EMPHASIZE: I can not prove whether or not my suspicion that the 2nd ECG in today’s case represents 2:1 Mobitz I instead of sinus rhythm with 1st-degree.  To prove this — I’d need to see serial ECG monitoring revealing what happens with respect to the atrial and ventricular rates as the case evolves.
  • That said — Clinically, it does not matter if the 2nd ECG shows sinus rhythm at ~50/minute with 1st-degree vs Mobitz I 2nd-degree with 2:1 AV block and 1st-degree — because the ventricular rate is the same in either case and chances are that the AV block will resolve with treatment.

  • PEARL: The above said — there are times when it will matter clinically whether your patient with acute infero-postero OMI is in sinus rhythm vs 2nd-degree, Mobitz I with 2:1 AV block (in which the 2nd P wave is hidden within T waves). Awareness of when and how to look for 2:1 block in subtle cases (as I describe above for today’s 2nd ECG) can greatly facilitate identification.

==================================

ADDENDUM (5/28/2024):
I wrote the above comment yesterday — while traveling, without large screen computer and without calipers.
  • To EMPHASIZE: Calipers were not needed to optimally treat the patient in today's case — as Dr. McLaren superbly demonstrates in his discussion. But I find it helpful after the emergency has passed to reflect on events for my own edification — so that I can learn and do even better in the future.

  • The above said — After returning home and able to view these 2 ECGs better — it literally took me no more than seconds using calipers to verify what took so much longer without them.

I've labeled the first 2 ECGs in today's case in Figure-1.
  • RED arrows make the ventriculophasic sinus arrhythmia obvious in ECG #1. Of note — most of the time when ventriculophasic sinus arrhythmia is seen in AV block rhythms — it is the P-P interval that "sandwiches" the P wave that is shorter (thought to be due to transient increased perfusion from the QRS) — but we see the opposite in Figure-1.
  • Complete AV block (as per Dr. McLaren) is clearly present in ECG #1 (quite regular junctional escape — but absolutely no relation between the sinus arrhythmia and neighboring QRS complexes despite adequate opportunity to conduct).

  • Impossible to prove anything in ECG #2, because there is no long lead rhythm strip — but the PINK arrows suggest ever-so-subtle deflections that I suspect represent "hidden" P waves from regression of 3rd-degree — to 2nd-degree AV block, Mobitz Type I with 2:1 AV conduction in this repeat ECG done 10 minutes after ECG #1.

Figure-1: I've labeled the 1st 2 ECGs in today's case.


Recommended Resources