
Post by Smith, with short article by Angie Lobo (https://twitter.com/ALoboMD), a third year intermal medicine resident at Abbott Northwestern Hospital
Case A 30-something woman with no past history, who is very fit and athletic, presented with 1.5 hours of substernal chest pressure. It was non-radiating and without other associated symptoms except for nausea. She had zero CAD risk factors.
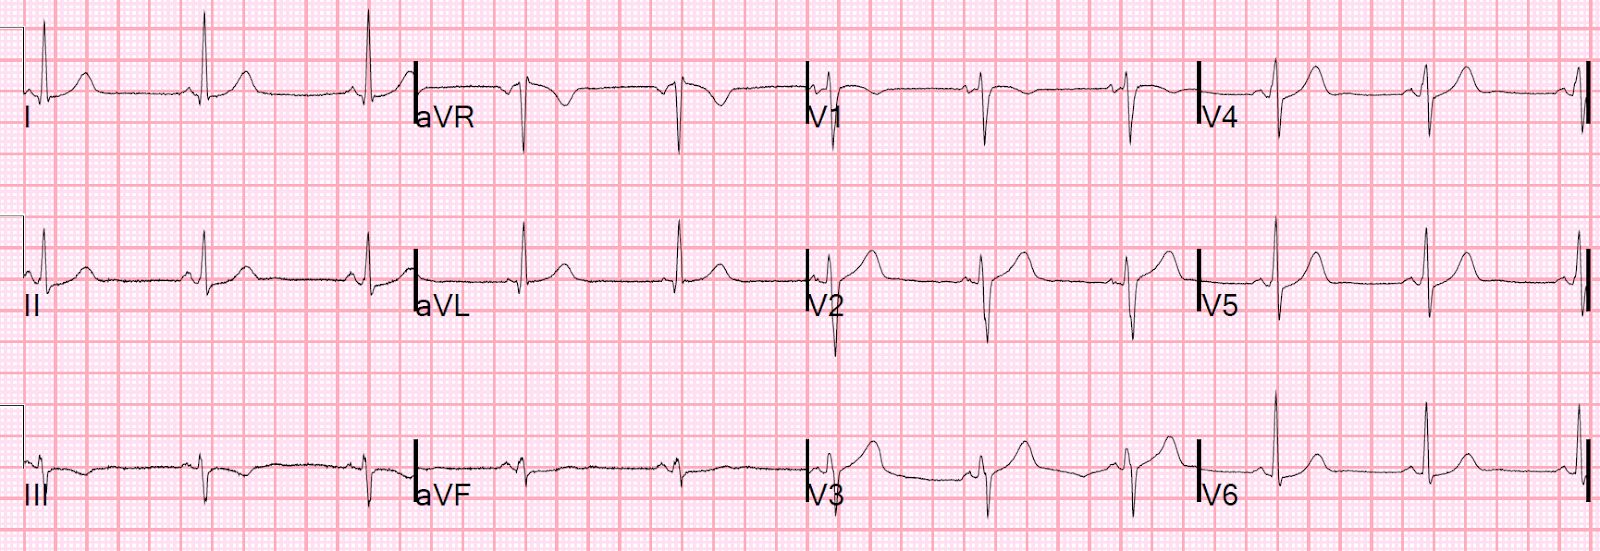
Here was her ECG at time zero:
There is ST elevation in V2 with large fat T-wave. There is ST depression in II, III, and aVF, and V3 to V6.
I saw this before any other information and knew immediately that it represented an LAD occlusion.
There is 1 mm of STE in lead V2. This must be explained, and normally would be explained by "normal variant," or "early repol." However, normal variant never has associated ST depression, and here we see ST depression in II, III, aVF and V3-V6. Moreover, there are large, fat T-waves in V2 and V3. The T-waves in V3-V6 are subtle "de Winter's" T-waves (ST depression followed by a large upright T-wave).
The physicians told me that they "knew something was wrong" with the ECG, but couldn't express exactly what.
The pain was resolving after nitroglycerine when this ECG was recorded at time 44 minutes:
The physicians did not notice this either. But this is what you are looking for if you do an ECG after pain resolution!! You MUST look for it. And then if you see it, it must make you realize that you missed the ST depression and hyperacute T-waves on the first ECG.
Next management step?
If you would not have activated the cath lab based on the first ECG, you really should strongly think about it now. This patient clearly has an unstable LAD lesion that at one point was occluded or nearly so. It is equivalent to a transient STEMI. It was late evening and the patient will be in the hospital overnight with a potentially very unstable LAD lesion.
The first troponin I returned at 0.022 ng/mL (99% URL = 0.030 ng/mL)
Not having seen the ECG findings, the providers discussed her very low risk with her and whether she would like to go home and follow up if her 2nd troponin remained negative, or be admitted to observation.
She felt more comfortable being admitted.
Subsequent events:
Later, before being taken to her room, the 2nd troponin returned at 1.01 ng/mL. This is diagnostic of myocardial infarction.
Heparin was started, but there does not seem to have been discussion of cath lab activation.
About 3 hours after admission, just after midnight, she had a 30 beat run of non-sustained VT.
They recorded a 3rd ECG at time 7 hours:
About this time, the 4th troponin, drawn at 8 hours after onset of pain, peaked at 20.956 ng/mL.
(For those of you who are accustomed to the units of high sensitivity troponin (ng/L), this is equivalent to 20,956.00 ng/L.)
Now you have ECG and troponin evidence of ischemia, AND ventricular dysrhythmia, which means this is NOT a stable ACS.
Again, cath lab was not activated.
What does this troponin level mean? Not much, but studies of STEMI and NonSTEMI show that about 70% of those diagnosed with STEMI have a peak troponin I above 10 ng/mL and that about 70% of those diagnosed with NonSTEMI have a peak troponin I below 10 ng/mL. Troponin elevation is dependent on presence or absence of occlusion (remember many OMI receive a diagnosis of NSTEMI), duration of occlusion (which is dependent on rapidity of therapy or the luck of spontaneous reperfusion), area of myocardium at risk, collateral circulation, and more.
Case continued
Fortunately, the patient remained stable. Next day, the patient was taken for an angiogram and found to have a reperfused LAD lesion with good flow that appeared to the angiographer as if it was a spontaneous coronary artery dissection. It seems that there was some uncertainly about this. The lesion was stented.
ECG at time 19 hours after cath:
Echocardiogram
Regional wall motion abnormality-distal septum and apex.
Regional wall motion abnormality-distal inferior wall.
ECG recorded at time 38 hours:
All ischemic ST Elevation and/or hyperacute T-waves evolve. The best evidence that ST elevation or large T-waves are ischemic comes from subsequent ECGs. It they are static, then they are not due to ischemia.
Ischemic ST elevation will increase, decrease, or resolve. Hyperacute T-waves will get larger, smaller, normalize, or invert.
This is better evidence for ischemia than any other data point. Wall motion abnormalities may disappear with rapid reperfusion. Angiograms may be negative due to spasm or thrombus lysis or small vessel disease, or it may be a type 2 MI. Troponins may be negative with very rapid reperfusion, or measured too late, or chronically elevated due to cardiomyopathy or renal failure. But the ECG, if it has a finding which is the result of acute ischemia, (and it does not always), will be dynamic. If the ECG findings are due to a pre-existing chronic pathology, or to normal variant, they will almost always be relatively static over 48 hours.
What is Spontaneous Coronary Artery Dissection (SCAD)?
I asked Angie Lobo (https://twitter.com/ALoboMD), a third year intermal medicine resident at Abbott Northwestern Hospital (and Minneapolis Heart Institute) and an aspiring cardiologist, to write a couple paragraphs on SCAD. She has done quite a bit of research on the topic.
-->
Case A 30-something woman with no past history, who is very fit and athletic, presented with 1.5 hours of substernal chest pressure. It was non-radiating and without other associated symptoms except for nausea. She had zero CAD risk factors.
Here was her ECG at time zero:
 |
| What do you think? |
There is ST elevation in V2 with large fat T-wave. There is ST depression in II, III, and aVF, and V3 to V6.
I saw this before any other information and knew immediately that it represented an LAD occlusion.
There is 1 mm of STE in lead V2. This must be explained, and normally would be explained by "normal variant," or "early repol." However, normal variant never has associated ST depression, and here we see ST depression in II, III, aVF and V3-V6. Moreover, there are large, fat T-waves in V2 and V3. The T-waves in V3-V6 are subtle "de Winter's" T-waves (ST depression followed by a large upright T-wave).
The physicians told me that they "knew something was wrong" with the ECG, but couldn't express exactly what.
The pain was resolving after nitroglycerine when this ECG was recorded at time 44 minutes:
 |
| The ST depression is less The T-waves are smaller |
The physicians did not notice this either. But this is what you are looking for if you do an ECG after pain resolution!! You MUST look for it. And then if you see it, it must make you realize that you missed the ST depression and hyperacute T-waves on the first ECG.
Next management step?
If you would not have activated the cath lab based on the first ECG, you really should strongly think about it now. This patient clearly has an unstable LAD lesion that at one point was occluded or nearly so. It is equivalent to a transient STEMI. It was late evening and the patient will be in the hospital overnight with a potentially very unstable LAD lesion.
The first troponin I returned at 0.022 ng/mL (99% URL = 0.030 ng/mL)
Not having seen the ECG findings, the providers discussed her very low risk with her and whether she would like to go home and follow up if her 2nd troponin remained negative, or be admitted to observation.
She felt more comfortable being admitted.
Subsequent events:
Later, before being taken to her room, the 2nd troponin returned at 1.01 ng/mL. This is diagnostic of myocardial infarction.
Heparin was started, but there does not seem to have been discussion of cath lab activation.
About 3 hours after admission, just after midnight, she had a 30 beat run of non-sustained VT.
They recorded a 3rd ECG at time 7 hours:
 |
| Now you can see complete resolution of hyperacute T-waves. There is no longer any STE in V2 There remains a bit of ST depression. |
About this time, the 4th troponin, drawn at 8 hours after onset of pain, peaked at 20.956 ng/mL.
(For those of you who are accustomed to the units of high sensitivity troponin (ng/L), this is equivalent to 20,956.00 ng/L.)
Now you have ECG and troponin evidence of ischemia, AND ventricular dysrhythmia, which means this is NOT a stable ACS.
Again, cath lab was not activated.
What does this troponin level mean? Not much, but studies of STEMI and NonSTEMI show that about 70% of those diagnosed with STEMI have a peak troponin I above 10 ng/mL and that about 70% of those diagnosed with NonSTEMI have a peak troponin I below 10 ng/mL. Troponin elevation is dependent on presence or absence of occlusion (remember many OMI receive a diagnosis of NSTEMI), duration of occlusion (which is dependent on rapidity of therapy or the luck of spontaneous reperfusion), area of myocardium at risk, collateral circulation, and more.
Case continued
Fortunately, the patient remained stable. Next day, the patient was taken for an angiogram and found to have a reperfused LAD lesion with good flow that appeared to the angiographer as if it was a spontaneous coronary artery dissection. It seems that there was some uncertainly about this. The lesion was stented.
ECG at time 19 hours after cath:
 |
| Wellens' Pattern A T-waves are present (terminal T-wave inversion) Pattern A is in contrast to Pattern B, which is a further evolutionary stage of Wellens and is more deep and symmetric. These are reperfusion T-waves (the same thing as Wellens' waves) |
Echocardiogram
Regional wall motion abnormality-distal septum and apex.
Regional wall motion abnormality-distal inferior wall.
ECG recorded at time 38 hours:
 |
| A further evolutionary stage of T-wave inversion. This is beyond Pattern A but not quite Pattern B yet. See examples of Pattern A and Pattern B at the very bottom of this post |
All ischemic ST Elevation and/or hyperacute T-waves evolve. The best evidence that ST elevation or large T-waves are ischemic comes from subsequent ECGs. It they are static, then they are not due to ischemia.
Ischemic ST elevation will increase, decrease, or resolve. Hyperacute T-waves will get larger, smaller, normalize, or invert.
This is better evidence for ischemia than any other data point. Wall motion abnormalities may disappear with rapid reperfusion. Angiograms may be negative due to spasm or thrombus lysis or small vessel disease, or it may be a type 2 MI. Troponins may be negative with very rapid reperfusion, or measured too late, or chronically elevated due to cardiomyopathy or renal failure. But the ECG, if it has a finding which is the result of acute ischemia, (and it does not always), will be dynamic. If the ECG findings are due to a pre-existing chronic pathology, or to normal variant, they will almost always be relatively static over 48 hours.
What is Spontaneous Coronary Artery Dissection (SCAD)?
I asked Angie Lobo (https://twitter.com/ALoboMD), a third year intermal medicine resident at Abbott Northwestern Hospital (and Minneapolis Heart Institute) and an aspiring cardiologist, to write a couple paragraphs on SCAD. She has done quite a bit of research on the topic.
Spontaneous Coronary Artery Dissection
Spontaneous
coronary artery dissection (SCAD) is an infrequent but increasingly recognized cause
of acute coronary syndrome (1- 4%) 1, most commonly affecting women (90%)
2. In middle age women, it accounts for 22-35% of all ACS
presentations 1,3, and the reported incidence of ST-elevation
myocardial infarction in this subset of patients is variable, but estimated to
be between 24-50%4. SCAD is a non-atherosclerotic, non-iatrogenic
and non-traumatic form of ACS, defined as a dissection occurring within the wall
of one or more coronary arteries (LAD being the most commonly affected 2),
leading to an obstruction of the lumen caused by formation of an intramural
hematoma (IMH) or intimal disruption rather than atherosclerotic plaque rupture
or intraluminal thrombus 2. SCAD occurs in patients with few or non-traditional
cardiovascular risk factors. There has been multiple factors associated with
SCAD that may predispose to a weaken arterial wall, fibromuscular dysplasia
(FMD) and pregnancy being the most common 2,5.
There are no randomized controlled
trials for treatment strategies in SCAD. The current American Heart Association
(AHA) consensus recommends a conservative approach (avoiding invasive therapies)
in hemodynamically stable patients with good TIMI flow. Invasive therapies,
such as percutaneous coronary intervention (PCI) or coronary artery bypass
graft (CABG) should be reserved for patients with ongoing ischemia, left main
artery dissection, or hemodynamic instability 6. It is of extreme
importance to suspect SCAD in this population (specifically women) in order to
deliver the adequate management (avoid management as atherosclerotic ACS,
unnecessary invasive strategy) and decrease the rate of complication.
1.
Nishiguchi
T, Tanaka A, Ozaki Y, Taruya A, Fukuda S, Taguchi H, Iwaguro T, Ueno S, Okumoto
Y, Akasaka T. Prevalence of spontaneous coronary ar- tery dissection in
patients with acute coronary syndrome. Eur Heart J Acute Cardiovasc Care.
2016;5:263–270. doi: 10.1177/2048872613504310.
2. Tweet
MS, Hayes SN, Pitta SR, Simari RD, Lerman A, Lennon RJ, Gersh BJ,
Khambatta S, Best PJ, Rihal CS, Gulati R. Clinical features, management,
and prognosis of spontaneous coronary artery dissection. Circulation.
2012;126:579–588. doi: 10.1161/CIRCULATIONAHA.112.105718.
3.
Nakashima
T, Noguchi T, Haruta S, Yamamoto Y, Oshima S, Nakao K, Taniguchi Y, Yamaguchi
J, Tsuchihashi K, Seki A, Kawasaki T, Uchida T, Omura N, Kikuchi M, Kimura K,
Ogawa H, Miyazaki S, Yasuda S. Prog- nostic impact of spontaneous coronary
artery dissection in young female patients with acute myocardial infarction: a
report from the Angina Pecto- ris-Myocardial Infarction Multicenter
Investigators in Japan. Int J Cardiol. 2016;207:341–348. doi:
10.1016/j.ijcard.2016.01.188.
4.
Saw
J, Mancini GBJ, Humphries KH. Contemporary review on spontaneous coronary
artery dissection. J Am Coll Cardiol. 2016;68:297–312. doi:
10.1016/j.jacc.2016.05.034.
5.
Saw
J, Poulter R, Fung A, Wood D, Hamburger J, Buller CE. Spontaneous coronary
artery dissection in patients with fibromuscular dysplasia: a case series. Circ
Cardiovasc Interv. 2012;5:134–137. doi: 10.1161/ CIRCINTERVENTIONS.111.966630.
6.
Hayes,
S.N., Kim, E.S., Saw, J., Adlam, D., Arslanian-Engoren, C., Economy, K.E.,
Ganesh, S.K., Gulati, R., Lindsay, M.E., Mieres, J.H. and Naderi, S., 2018.
Spontaneous coronary artery dissection: Current state of the Science: A
scientific statement from the American Heart Association. Circulation, 137(19),
p.e523.
doi:10.1161/cir.0000000000000564.
More on Wellens' Pattern A and Pattern B
From the original article:
 |
| At the time of this article, Wellens did not suggest that Pattern B was an evolutionary state from Pattern A. I don't believe anyone has ever written a peer reviewed article on this, but through long experience and through literature on reperfusion therapy for acute MI, I believe this to be true. It is only established if there are multiple ECGs. See this post: Classic Evolution of Wellens' T-waves over 26 hours |
This is one patient, with ECG recorded at time zero after pain resolution, then at time 2 hours, then at time 9 hours. It was long ago that I realized that Wellens' is a reperfusion pattern and the pattern A is early and evolves into Pattern B.

-----------------------------------------------------------
Comment by KEN GRAUER, MD (7/31/2018):
-----------------------------------------------------------
In my experience, the most instructive ECG cases consist of serial tracings with contemporaneous notation at each moment in time as the case evolves. KEY lessons to be learned in this case cannot be taught in isolation. For ease of discussion — I’ve put the first 4 sequential tracings in this case together in Figure-1.
- The patient profile in this case is deceptive = a seemingly healthy, athletic and very fit 30-year woman with no risk factors and no significant prior medical history. The 1st “lesson” is, “All bets are off” — when an adult of any age presents to the ED with new-onset chest discomfort.
- PEARL: When ECG findings are subtle — Look for subtle findings in multiple leads! Although by the time you are reading My Comment, you already know the outcome in this case — GO BACK and Take Another Look at the initial ECG @ Time = 0:00 (TOP tracing in Figure-1). How many leads show abnormal ST-T wave findings in ECG #1?
 |
| Figure-1: The first 4 sequential tracings in this case. Note that both frontal plane axis and the sequence of R wave progression is very similar in all 4 tracings — therefore, lead-to-lead comparison for assessment of ST-T wave changes between these serial tracings is much easier to accomplish than it would be if there was marked change in axis or in R wave progression across the chest leads (See text). |
ANSWER: Except for aVR — every lead in ECG #1 shows abnormal ST-T wave changes:
- Dr. Smith has already described the ST elevation in lead V2, in association with fatter-than-expected T waves in V2 and V3. He also noted the subtle pattern of deWinter T waves in leads V3-thru-V6 ( = ST depression in each of these leads, followed by rise to larger-than-expected T waves).
- There is also ST coving and elevation in lead V1. While ST coving in V1 is not necessarily abnormal — the presence of ST elevation in association with ST-T wave abnormalities in V2,V3 in a patient with chest pain is clearly cause for concern.
- As per Dr. Smith — each of the inferior leads (II,III,aVF) shows ST-T wave abnormalities. As is often the case when reciprocal ST-T wave changes are seen in the inferior leads — the most subtle changes tend to be seen in lead II. The amount of ST depression in lead II of ECG #1 is minimal — but — the ST segment in this lead “looks depressed” (because of the flat horizontal ST segment ledge, with abrupt transition from the end of the ST segment to the beginning of the T wave). If this picture of subtle-but-real abnormality in the ST-T wave in lead II of ECG #1 is not familiar to you — Memorize the shape of the ST-T wave in lead II!
- There is ST elevation in lead aVL. Again, the amount of ST elevation in aVL is minimal — but the importance of recognizing deWinter-like T waves in the chest leads of a patient with new-onset chest discomfort and reciprocal ST-T wave changes in all 3 inferior leads, and at least some ST elevation in lead aVL — is that the combination of these findings suggests an ongoing acute event, and localizes the lesion to the proximal LAD.
- Finally — the ST segment in lead I of ECG #1 is abnormally straight. This accounts for the rather abrupt transition between the end of the ST segment and the beginning of the T wave in this lead.
- NOTE: None of the above findings in isolation is diagnostic. But taken together — the picture in ECG #1 of subtle-but-real ST-T wave abnormalities in 11/12 leads in an adult with new-onset chest discomfort should suggest acute coronary occlusion until you prove otherwise.
As emphasized by Dr. Smith — the best way to demonstrate acute ischemia is by identifying dynamic ST-T wave changes in association with change in the nature of chest pain. This often requires careful lead-by-lead comparison between serial tracings.
- Take Another Look at Figure-1. How many leads show a difference when comparing the ST-T wave appearance in ECG #1 with that in ECG #2?
- KEY POINTS: ST-T wave changes in serial tracings may be exceedingly subtle. First, assess if frontal plane axis and the sequence of R wave progression across chest leads is similar between the 2 tracings that you are comparing — since a significant difference in either of these factors may make accurate comparison of serial tracings much more difficult. Go lead-by-lead — comparing the appearance of lead I in both tracings; then lead II in both tracings; then lead III … and so on. Because differences may be so subtle — you are often looking for a “Gestalt” ( = overall) impression as to whether there is qualitative difference between the 2 ECGs.
Our IMPRESSION: Lead-by-lead comparison between ECGs #1 and #2 to me suggests that except for lead III (for which the shallow T wave inversion looks the same in both tracings) — there is slight improvement in virtually all other leads. Given that chest pain is resolving at the time ECG #2 was recorded — this supports the concept of dynamic ST-T wave changes in this patient.
Now compare ECG #3 with the first 2 tracings:
- Looked at in isolation — the ST-T wave changes in ECG #3 are no more than nonspecific. But examined in context (ie, knowing this tracing was obtained 7 hours after ECG #1) — supports beyond doubt the concept of ongoing dynamic ST-T wave changes in this patient who presented with acute symptoms.
Cardiac cath performed the next day revealed a reperfused LAD lesion, that was thought to result from spontaneous coronary artery dissection. As per Dr. Smith — ECG #4 shows evolution to an ECG pattern consistent with Wellens’ Type A T waves (ie, ST-T waves marked by terminal T wave inversion in leads V2 and V3).
- Since ECG #4 was obtained after the infarction occurred (and shortly after cardiac cath showed reperfusion of the “culprit” lesion) — we define the ST-T wave appearance in the chest leads of this tracing as consistent with reperfusion T waves.
- But, IF the history associated with ECG #4 was different — clinical implications of these ECG findings might change dramatically. For example, imagine this patient had several hours of chest pain a day before she came to the ED — but that all chest pain had resolved at the time of presentation — and, that instead of ECG #1 being her initial tracing, that ECG #4 was her initial tracing. If this were the case, the appearance of the ST-T waves in the mid-chest leads of ECG #4 would be consistent with Wellens’ “Syndrome” — and would serve as an indicator of a tight, proximal LAD lesion in need of revascularization.


