
A 52 y.o. male presented with persistent central chest pressure, without radiation, SOB or diaphoresis, which began at rest approximately one hour prior to arrival. He had never had pain like this before. He felt slightly nauseous earlier but no vomiting. He is denying any back pain or abdominal pain.
An ECG was recorded during pain:

This shows significant ST depression in I, II, and V4-V6, with reciprocal ST Elevation in aVR. This suggests diffuse subendocardial ischemia.
However, along with that subendocardial ischemia, there is also STE in lead III with reciprocal ST depression in aVL, and some STE in V1. These suggest inferior OMI with possible RV involvement.
Both of these patterns together suggest Aslanger's pattern, recently published in J Electrocardiology: A new electrocardiographic pattern indicating inferior myocardial infarction. https://pubmed.ncbi.nlm.nih.gov/32526537/
This newly recognized ECG pattern is defined as "(1) any STE in III, but not in other inferior leads, (2) STD in any of leads V4 to V6, (but not in V2) with a positive or terminally positive T-wave, (3) ST in lead V1 higher than ST in V2."
One might argue that this case does not apply because of the ST depression in V2, but 1) V2 is probably misplaced and 2) it is not enough ST depression to negate the rule.
Here, we will ignore lead V2 because it doesn't make any sense at all: the R/S ratio is higher than in either V1 or V3, which suggests misplacement.
Here is an illustration of the ST vector in Aslanger's pattern:

Thus, this pattern was associated with simultaneous inferior MI AND diffuse ischemia due to LAD, Left Main, or 3 vessel disease.
HOWEVER, there is yet another entity which could produce this, and it is transmural septal ischemia. Could this be Septal STEMI (STE in V1 and aVR, with reciprocal ST depression in V4-V6?), with ADDED STE in III?
Aslanger added in the limitations in his article:
"Theoretically, an isolated basal inferoseptal infarction or an acute inferior MI in the presence of previous infarctions that may change the orientation of lesion vector can also cause a similar picture. Lastly, this pattern may represent a chronic change from a previous ischemic insult as seen in a limited number of the patients in the control group".
Vectors:
In diffuse subendocardial ischemia, which when due to ACS, is usually from LAD or Left Main insufficiency, all walls would have a negative vector pointing from the endocardium to the epicardium (positive vector from epicardium to endocardium, the opposite of OMI). Since there is no ventricular wall at the top ("base") of the heart (there are only atria), then the addition of all those negative vectors points towards the apex; if the entire heart has subendocardial ischemia, then the ST depression vector points towards the apex (II, V5), with a reciprocal STE vector towards aVR (and even V1).
In Septal STEMI, transmural ischemia of the septum is recorded by the overlying lead V1 as ST Elevation. aVR is similarly (but not exactly) placed and can show STE. Lead III is also on the right and might manifest ST Elevation in Septal STEMI.
It is important to remember that the ST depression of subendocardial ischemia does not localize. Here, the ST depression is in "lateral" leads, but this does not mean there is "lateral" ischemia. It may either be reciprocal to Septal STEMI, or due to subendocardial ischemia from the LAD insufficiency.
Case Continued
Bedside ultrasound was performed:
This shows an anterior wall motion abnormality, and highly suggests the LAD as the infarct artery. Often patients with subendocardial ischemia on the ECG do NOT have a wall motion abnormality, which contrasts with patients with OMI/STEMI who always have a wall motion abnormality, at least if the echo is of high enough quality and uses bubble contrast.
The patient was slightly tachypneic and mildly hypoxic in the stabilization room and therefore the physicians obtained a CT pulmonary angiogram as well as aortogram to rule out dissection and PE.
The initial Abbott hs troponin I returned at 52 ng/L (Upper reference limit for males is less than or equal to 34 ng/L). FYI: 52 ng/L is the threshold for "rule in" by European studies as it has a high positive predictive value in the setting of chest pain.
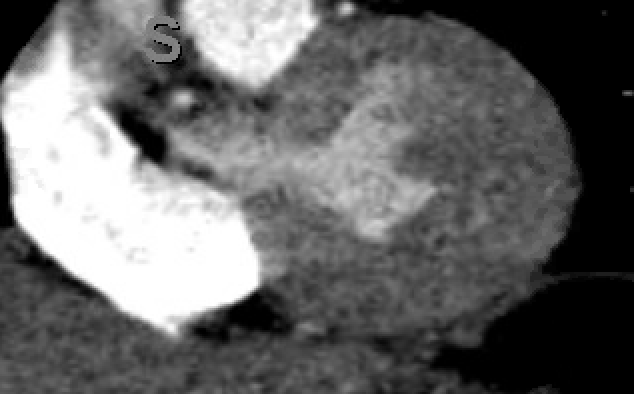
The D dimer was undetectable, so CTPA was probably unnecessary, but it did have interesting findings:

Top left: conventional CT.
Top right is colored iodine overlay; Blue areas of myocardium are ischemia.
Bottom left is plain iodine map.
Bottom right is low Kilo Electron Volt image which brings out iodine. See the 2 very dark areas, one in the septum and one near the apex. Notice that they correlate with blue on the colored spectral CT (blue is ischemia on spectral CT).
These areas of hypoperfusion are in the septum and apex, strongly suggesting LAD ischemia. In addition, they are indeed transmural!
This CT interpretation was made with moderate certainty
Contrast this CT transmural ischemia here with this CT subendocardial ischemia.
Below we can see a coronal image of the heart:
Case continued
The patient was placed on a nitroglycerin drip and chest pain gradually resolved. The emergency medicine faculty spoke directly with cardiology faculty and the decision was made to activate the cath lab via "pathway B." (Our "Pathway A" is for clear STEMI; "Pathway B" is intensive evaluation and discussion for patients who might need the cath lab emergently for possible OMI, but it is not as clear as with STEMI). The patient was subsequently given 5000 units of heparin, 180 mg of ticagrelor, and defib pads were placed on the patient in the event that he should have a cardiac arrest.
Angiogram
Culprit Lesion: 90% mid LAD stenosis with evidence of plaque rupture, TIMI III flow on angiography.
Troponin profile:

ECG after PCI:

Formal Echo:
The estimated left ventricular ejection fraction is 71%.
There is no left ventricular wall motion abnormality identified.
So the wall motion has recovered (remember we showed a definite WMA during the ischemia). Such quick recovery is uncommon in STEMI/OMI unless there is very quick reperfusion. If this case was indeed OMI, then there was very fast spontaneous reperfusion, as in indicated by the open artery with TIMI III flow. When reperfusion is not so fast, wall motion recovery may require many days to weeks. When recovery is delayed, it is often called "myocardial stunning."
detailed, and truly extraordinary, as always.
ReplyDeleteAslanger's pattern is a new one on me...
Steve, give me a chance too learn all the old patterns, gee-whiz.
excellent pod as always. now i need to learn to convince the cards fellows to rush this one to the cath table.
thanks, tom!
DeleteHi,
ReplyDeletebecause i see ST/S in V3 is under 0.25, Do you think if modified sabogassi scores in mi can be used in this case ?
modified sgarbossa is only used in LBBB and paced rhythm. So it does not apply here.
DeleteNice, I saw a similar ecg pattern yesterday with ecg changes resolved after GTN, CAG shows multi LAD lesion and critical LCX lesion
Deletenice
ReplyDeleteDear Dr. Smith, I am interested in which step I should go when I see "Aslanger's pattern".
ReplyDeletePrimary, emergent or early PCI?
Emergent (which is primary) PCI
DeleteThis comment has been removed by the author.
ReplyDeleteThere is no de Winter's pattern here. That is a depressed and upsloping ST segment followed by a hyperacute (bulky, wide, large) T-wave and in leads overlying the ischemic myocardium. The leads with ST depression have none of these characteristics.
DeleteNot sure Dr Smith as to whether any one has pointed it out, but leads II and III seem to be the wrong way round on the otherwise beautiful diagram... or was it meant to be easter egg?
ReplyDeleteYes, sorry about that mistake!
Delete