Monday, October 30, 2023

"Non-STEMI" is a worthless term.

A 60 yo with 2 previous inferior (RCA) STEMIs, stented, called 911 for one hour of chest pain. He had no h/o heart failure. 

Here is the first prehospital ECG (time 0, after one hour of pain): 

I do not see evidence of OMI, and neither did the Queen of Hearts


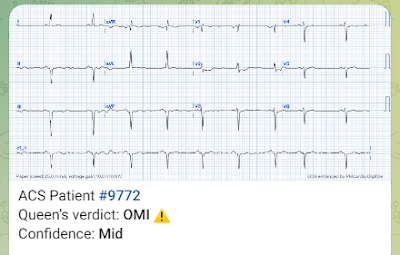
Here is the 2nd prehospital ECG (time 10 minutes, after 70 minutes of pain): 

No change


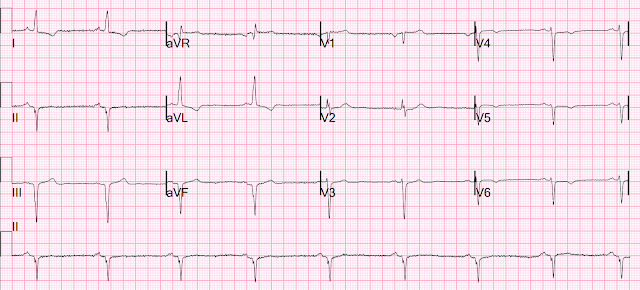
On arrival, the first ED ECG was recorded 20 minutes after the last one (90 minutes after pain onset): 

What do you think?


Here is his most recent previous ECG:

This was recorded after intervention for inferior STEMI (with massive ST Elevation, see below), and shows inferior Q-waves with T-wave inversion typical of completed inferior OMI.   Peak troponin at that time was 32.5 ng/mL (quite large).  The ejection fraction after this infarction was 60%; it had been 70% prior to the infarction.

Here is the presentation ECG for that inferior STEMI:

This looks like a large infarct on ECG.  The inferior STEMI 3 years prior to this had a similar ECG.


The ST depression in V2 is diagnostic of posterior OMI, especially when you can see that it is change from 20 minutes prior.

Here is the Queen's interpretation (she has no access to prior or serial ECGs -- that is something we plan to add in the future):


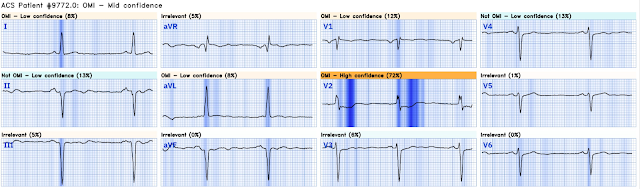
Unlike a lot of deep convolutional neural network artificial intelligence, which is a black box and thus engenders mistrust of the results (is she hallucinating, like chatGPT?), the Queen of Heart has explainability.  Here she explains why:


You can see that the ST depression of over 1mm (highlighted)  in the SINGLE lead of V2, in the context of a small QRS (highlighted), made the diagnosis.
The old inferior MI had not changed.


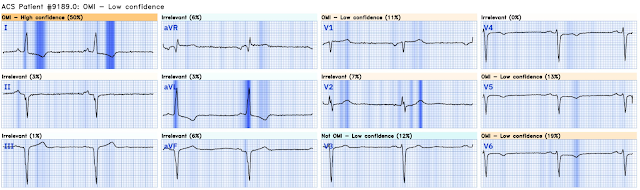
80 minutes after first ED ECG, patient's pain was much better:

The ST depression is diminishing, the artery is opening

Here is the PM Cardio Queen of Hearts Deep Neural Network AI interpretation:

OMI with mid confidence


Here is the explanation (explainability in AI)


YOU TOO CAN HAVE THE PM Cardio AI BOT!!  (THE PM CARDIO OMI AI APP)

If you want this bot to help you make the early diagnosis of OMI and save your patient and his/her myocardium, you can sign up to get an early beta version of the bot here.  It is not yet available, but this is your way to get on the list.


Case continued

The cath lab was activated rapidly.  DBT was 120 minutes, pretty good for a Non-STEMI OMI.

The first hs troponin I returned at 1100 ng/L

Angiogram

Lesion on 1st Obtuse Marginal: Proximal subsection = 90% stenosis Stented. Pre procedure TIMI III flow was noted. Post Procedure TIMI III flow was present.  So the artery had completely spontaneously reperfused prior to intervention; the duration of occlusion was perhaps 2 hours


The troponin peaked at 60,000 ng/L (a very large infarction)


Formal bubble contrast echocardiogram


--The estimated left ventricular ejection fraction is 46%.

--Regional wall motion abnormality-inferior.

--Regional wall motion abnormality-inferolateral.  (This means posterior in common terminology)

--Normal LV cavity size with moderately increased thickness.

Previous echo:

Normal estimated left ventricular ejection fraction - 60%

Regional wall motion abnormality, inferior and probably inferolateral.


So he has lost 25% of his ejection fraction in the acute phase.


Here is the next day ECG:

Some posterior reperfusion T-waves (slightly larger upright T-waves in V2 and V3).

2 years later, in the chronic phase, his ejection fraction after remodeling was 15-20%.  This is without any intervening infarction.  He has "ischemic cardiomyopathy" and "congestive heart failure."  And this is after undergoing very rapid intervention.  


What may appear to be a small "Non-STEMI" on the ECG is a very large OMI.  From this most recent "NSTEMI" he developed heart failure, in spite of rapid treatment.


This is why NSTEMI is a worthless term.  It has no function.  It should be abandoned. 


NSTEMI is a huge spectrum from tiny infarcts to massive OMI.  ST Elevation or its absence does not tell you whether there is acute occlusion or not and does not tell you how much myocardium is at risk.


This graphic shows this spectrum:

The vertical axis is infarct size as measured by peak troponin.


On the right is NSTEMI.  On each side is NSTEMI-OMI (to the left) and NSTEMI-Non-OMI to the right.  In the present STEMI/NSTEMI paradigm, these 2 greatly different (heterogeneous) infarcts are lumped together as one kind of infarct!

From:

Meyers, Bracey, Smith, et al.  Journal of Emergency Medicine.  Comparison of the ST elevation myocardial infarction (STEMI) vs. NSTEMI and Occlusion MI (OMI) vs. NOMI paradigms of acute MI


===================================
MY Comment, by KEN GRAUER, MD (10/30/2023):
===================================
What I like so much about today's case — is how modest the acute ECG changes are — but how with the simple historical fact of marked reduction in CP (Chest Pain) — how absolutelyl conclusive these modest ECG changes are of the diagnosis of OMI with need for prompt cath with PCI!
  • For clarity — I've selected just 2 of today's tracings, and have put them together in Figure-1. As noted on the repeat tracing — the patient's CP was much improved at the time this 2nd ED ECG was obtained, which was ~80 minutes after ECG #3.

Figure-1: The 3rd and 4th ECGs recorded in today's case (which were the 1st and 2nd ECGs recorded in the ED).


Lead V2 Tells the Tale:
The ECG marker of the patient's prior inferior MI is present in both of the tracings shown in Figure-1 — in the form of QS complexes that are seen in each of the inferior leads.
  • As highlighted within the colored rectangles — the KEY lead in both of the ECGs shown in Figure-1 is lead V2

  • The initial ECG recorded in the ED shows early transition (with a predominant R wave already by lead V2) — and a positive "Mirror Test" in the form of the "shelf-like" shape of abnormal ST depression in lead V2 (For more on "My Take" regarding the Mirror Test — See My Comment in the September 21, 2022 post of Dr. Smith's ECG Blog). Other ECG changes in this initial ED tracing primarily consist of nonspecific ST-T wave flattening in most of the remaining leads. It is because of lead V2 in this patient with new CP — that the diagnosis of acute posterior OMI is made.

  • The diagnosis of acute posterior OMI is solidified by the repeat ECG in the ED, that was done ~80 minutes after ECG #3. As shown within the RED rectangle — the shelf-like ST depression has virtually resolved in ECG #4 — which when correlated with marked reduction in CP — confirms the diagnosis of dynamic ST-T wave changes, with need for prompt cath with PCI. The remaining leads in this repeat ECG show subtle changes consistent with reperfusion — but in the absence of the above described dynamic change in lead V2, the ECG findings in other leads would be non-diagnostic.

Final Thought: As noted by Dr. Smith in his discussion above — the QOH AI Application correctly diagnosed acute OMI.
  • Appreciation of the modest-but-definitely-identifiable ST-T wave changes highlighted within the colored rectangles in Figure-1, when correlated to the presence and severity of the patient's symptoms — is a skill that can be taught to clinician's receptive to these ECG findings that are diagnostic of acute OMI.


Saturday, October 28, 2023

Continuous prolonged generalized weakness, lightheadedness, and presyncope. What might you suspect from the ECG?

A young man presented with continuous prolonged generalized weakness, lightheadedness, and presyncope.  There was some dyspnea but no chest pain.   

Here is his ECG.  

This shows LVH, with high voltage.

LVH can have very thick-walled ventricles and a correspondingly small LV cavity.  LVH is a common etiology of heart failure with preserved ejection fraction, as it may results in a stiff ventricle with poor diastolic relaxation.

See this articles: Heart Failure with Preserved Ejection Fraction (NEJM review)

One etiology of LVH on the ECG is Hypertrophic Cardiolmyopathy (HOCM), and sometimes ECGs in patients with HOCM are specific for HOCM.  

But this ECG is NOT specific for HOCM.

However, it is atypical for LVH: most ECGs with LVH that manifest as precordial high voltage have deep S-waves in V1-V3.  This one has very early transition: the only lead with a deep S-wave is lead V1.

See Ken's excellent tutorial on the ECG in HOCM below.

Case continued

We did a chart review and, indeed, this patient had known HOCM and an implanted ICD.  It was present during sinus rhythm with normal heart rate; therefore, the ICD not interrogated.

We did a bedside echo (original quality was not so good, and this is moreover an iPhone video of the screen -- but it is good enough):

Notice how small the LV cavity is.  It is only a slit.  This is because of the large LV myocardial mass due to HOCM.  There is very little filling, and thus very poor stroke volume.  
The heart rate is too fast for this poor filling. 
Preload must be increased and the heart rate slowed in order to allow more LV filling.

Further ultrasound showed no B-lines (no pulmonary edema).  

These patients are often on beta blockers to prevent such a scenario.  So we looked into the chart and this patient was indeed prescribed a beta blocker, and also verapamil.  He stated he had stopped taking them.

We gave him IV fluids and metoprolol, and his pulse normalized, after which he felt completely well.


See this even more interesting and more dramatic and fascinating case:

History of Hypertrophic Cardiomyopathy (HOCM), with Tachycardia and High Lactate


==================================
My Comment by KEN GRAUER, MD (10/28/2023):
==================================

QUESTION: 
For clarity in Figure-1 — I've reproduced today's ECG without the long lead rhythm strip. 
  • Can you diagnose HCM (Hypertrophic CardioMyopathy) from today's ECG?  

Figure-1: The ECG in today's case. 


ANSWER: 
The answer is NO. We can not diagnose HCM solely from the ECG in Figure-1:
  • All we can say about the ECG in Figure-1 — is that the rhythm is sinus with a normal axis (about +45 degrees), and essentially normal intervals (perhaps a borderline QTc given the heart rate).
  • Small and narrow q waves are seen in lateral leads I and aVL.
  • The zone of transition in the chest leads occurs normally between leads V2-to-V4 — but as per Dr. Smith, R wave amplitude abruptly increases to a 20 mm R wave already by lead V3!
  • Overall QRS amplitude is dramatically increased (even for a young adult) — easily satisfying voltage criteria for LVH (Left Ventricular Hypertrophy).
  • There is ST-T wave depression consistent with LV "strain" in no less than 8/12 leads! In addition — the tall ST-T wave in lead V1 is also a manifestation of LV "strain" in an anterior lead with a very deep S wave (that measures 28 mm in V1!).
  • The only reason we don't see LV "strain" in lead V2 — is that this is a "transition lead" that separates lead V1 with a huge S wave (and large upright T wave) — from lead V3 which has a very tall R wave (and marked ST-T wave depression).

ECG Findings in HCM — vs Echo?
The question of what ECG findings to look for when in search of HCM arises often. HCM is estimated to occur in ~1 in 500 young adults, making it among the most common inherited cardiac disorders. It is the most common underlying cause of sudden cardiac death (SCD) in asymptomatic young individuals — which raises the question of whether to screen those involved in regular (high performance) athletic activity? If so — WHO to screen? College and professional athletes? High school athletes? Others?
  • Echocardiography is diagnostic. With formal echo — accurate measurement of septal and chamber size can be obtained and followed on a serial basis. Echo also helps to sort through the large "spectrum" of HCM disorders, encompassing "lower risk" HCM (in those with modest or moderate hypertrophy — but without obstruction) — vs higher-risk obstructive forms of HCM.
  • Obtaining formal Echo is expensive. It's easier and cheaper to do screening ECGs in athletic individuals — reserving Echo for when ECG reveals any findings potentially suggestive of HCM.

Most patients with HCM do not have a normal ECG. Among the many ECG findings that may be seen in patients with HCM are the following: 
  • Increases in QRS amplitude.
  • Large septal Q waves (Sometimes known as "dagger" Q waves — because these are deep but narrow Q waves seen in lateral leads). 
  • Tall R wave in lead V1 and/or early transition in the chest leads (reflecting increased "septal" forces).
  • Abnormal ST-T wave abnormalities.
  • Conduction defects (ie, LBBB, IVCD).
  • WPW
  • Cardiac arrhythmias (especially AFib). 

  • The Problem: None of the above ECG findings are specific for HCM. It is also interesting (if not confusing) — how much of a variety one may see on the ECG of a patient with HCM (ie, While QRS amplitude and ST-T wave findings of LV "strain" are marked on today's ECG — large septal Q waves are no where to be found).

Regarding Today's Patient:
The bedside echo performed by Dr. Smith in today's case is truly impressive! As per Dr. Smith — the LV cavity is tiny! As compensation for greatly reduced LV filling — heart rate increases, which perpetuates the vicious cycle of further reducing the time for LV filling. No wonder today's patient presented with symptoms of dizziness and weakness (ie, essentially presyncope).
  • The diagnosis of severe HCM, presumably with a significant obstructive component is obvious from the above bedside Echo. 
  • The clinical severity of many cases along the large "spectrum" of HCM disorders may not be nearly as easy to evaluate without a more formal Echo study.

  • As per Dr. Smith — Today's patient may clearly benefit from the rate-slowing and negative inotropic effect of the beta-blocker he was prescribed, but stopped taking.
  • That said — Given severity of this patient's presenting symptoms and the extreme reduction in LV cavity size (with presumed obstruction in systole) — I suspect additional measures will soon be needed.

Recommended Treatment Measures for HCM:
In Figures-2, -3 and -4 below — I've reproduced the concise review by Jacoby et al on management measures for HCM (ACC.23/WCC — 2/21/2020).
  • In addition to beta-blocker therapy — Verapamil (sometimes combined with a beta-blocker) may be helpful.
  • The presyncopal symptoms of today's patient are potentially life-threatening, given the severity of his HCM. Referral to a center with special interest and expertise in the management of this complex and potentially life-threatening disorder is probably advised at this point.
  • Unless there is a dramatic response to being put back on beta-blocker therapy — consideration of Septal Reduction Therapy (SRT), in the form of either surgical myomectomy or alcohol septal ablation, performed at a center with experience in this area may soon be needed. 

Figure-2: Part 1 — from the Review of HCM Treatment by Jacoby et al (ACC.23/WCC — 2/21/2020).


Figure-3: Part 2 — from the Review of HCM Treatment by Jacoby et al (ACC.23/WCC — 2/21/2020).


Figure-4: Part 3 — from the Review of HCM Treatment by Jacoby et al (ACC.23/WCC — 2/21/2020).


Wednesday, October 25, 2023

A man in his 60s with syncope and ST depression. What does the ECG mean?


Written by Sean Trostel MD, peer reviewed by Meyers, Smith, Grauer, etc.


A man in his 60s with a history of severe alcohol use disorder and epidural abscess on long-term ciprofloxacin presented to the emergency department after an episode of syncope while standing in line at a grocery store.

He did not have chest pain.


Here is his triage ECG: 
  
What do you think?


My interpretation:

Sinus rhythm, normal QRS, widespread wavy ST depression leading into late T/U-waves with very prolonged QT. No evidence of OMI. QTc/QUc is in the range of 630 msec.


What is the most likely cause of the patient’s ECG findings, and what would be your first step in management?

ECG is consistent with severe hypokalemia and/or hypomagnesemia causing prolonged QT (QU) at high risk of Torsades (which is polymorphic ventricular tachycardia in the setting of a long QT interval).


A prior ECG was available for comparison:


Normal


One might be tempted to interpret the ST depression as ischemia, but as Smith says, "when the QT is impossibly long, think of hypokalemia and a U-wave rather than T-wave."

Check out this case: 

Are These Wellens' Waves??


The Queen of Hearts PM Cardio AI app was fooled into saying "OMI with low confidence," but she has never been trained in hypokalemia.  We just finished training version 2 with some cases of hypokalemia, so that is in the future.  Moreover, the Queen is only supposed to be used with a high pretest probability of ACS/OMI.

The patient’s VBG resulted as I was speaking with him and confirmed my suspicions, showing a potassium of 1.6 mEq/L. Magnesium later resulted at 0.8 mg/dL, and ionized calcium was 0.73 mmol/L.


The patient had pads placed in case of PMVT/VF, was immediately given 2g magnesium sulfate and 40mEq oral potassium, and had additional IV access obtained to start IV KCl.


This patient has many reasons to have long QT in this case:

Hypokalemia
Hypomagnesemia
Chronic ciprofloxacin use
Hypocalcemia (contributes to long QT but lower risk of TdP as discussed in this post)


With a chief complaint of syncope, it should be suspected that the patient went into torsades de pointes prior to arrival. The patient was admitted to the ICU for close monitoring and electrolyte repletion and had an uneventful hospital course.


See these other relevant cases:
  

What are these bizarre bigeminal PVCs??


More cases of long QT not measured correctly by computer (these are all fascinating ECGs/cases):

Bupropion Overdose Followed by Cardiac Arrest and, Later, ST Elevation. Is it STEMI?


Another diagnostic ECG of a potentially deadly condition


===================================
MY Comment, by KEN GRAUER, MD (10/19/2023):
===================================
Today's excellent case discussion by Drs. Trostel and Meyers brings home a number of important points regarding assessment of the QT interval. I focus my comment on some additional observations
  • For clarity in Figure-1 — I've labeled the initial tracing in today's case.


Figure-1: The initial ECG in this case — and a rapid method for estimating the QTc (See text).


MY Thoughts on Today's CASE:
Essential for assessment of the initial ECG — is the history. The patient is a man in his 60s with established severe alcohol use disorder — and epidural abscess being treated with longterm Ciprofloxacin — who presented to the ED following a syncopal episode.
  • NOTE: Each of the bolded words in the above paragraph are essential to our assessment.

As per Drs. Trostel and Meyers — the ECG in Figure-1 shows sinus rhythm with normal PR interval and normal QRS duration — but with a markedly prolonged QTc interval. The frontal plane axis is normal — and there is no chamber enlargement. There is diffuse ST segment depression, seemingly with terminal T wave positivity in multiple leads.


QUESTION #1:
  • Did YOU notice that beat #4 is a PVC with fusion

=================================

WHY is this PVC Potentially Relevant to Today's Case?
RED arrows in the long lead II rhythm strip in Figure-1 highlight sinus P waves. Note that the PINK arrow P wave is right on time! — but that the PR interval preceding beat #4 is slightly shorter than the PR interval of other beats in this long lead rhythm strip.
  • That beat #4 is a fusion beat — is best seen by looking at simultaneously-recorded beat #4 in lead aVL, in which the small, negative QRS complex clearly looks different than the small, upright QRS for beats #5 and #6 in lead aVL.
  • The reason for this difference in QRS morphology — is that this is a late-cycle (ie, end-diastolic) PVC — in which the on-time PINK arrow P wave begins to conduct to the ventricles — but before it can complete its path there, it encounters a ventricular impulse, thereby resulting in an intermediate (fusion) form sharing morphologic features of normal and ventricular conduction.

  • PEARL #1: Late-cycle PVCs are a common form of reperfusion arrhythmia — such that whenever I see them, I take an extra close look at the tracing to make sure there are no indications of recent infarction (More on this in a moment with regard to today's case!).

==============================
QUESTION #2:
  • If it were not for the markedly prolonged QTc — Wouldn't ECG #1 look like diffuse subendocardial ischemia? 


ANSWER:
As we've discussed on numerous occasions in Dr. Smith's ECG Blog — the diagnosis of diffuse subendocardial ischemia (DSI ) is made by the finding of ST depression in multiple (usually at least 6-7) leads in association with ST elevation in lead aVR (and sometimes also in lead V1).
  • In Figure-1 — there is ST depression in no less than 9 leads — with ST elevation in both leads aVR and V1 — such that IF the QTc would not be as prolonged as it is — our differential diagnosis would focus on conditions associated with DSI (diffuse subendocardial ischemia).

  • PEARL #2: It is important to remember that the ECG shows us the "net effect" of all that is going on. The relevance of this concept to today's case is that IF a patient has more than a single underlying condition (ie, severe hyper- or hypokalemia and ischemia— then the ECG manifestations of one of these conditions may "mask" the other. BOTTOM Line: Given all of the ST depression seen in ECG #1 — it will be impossible to rule out DSI until the ECG is repeated after correction of this patient's severe hypokalemia, hypomagnesemia and hypocalcemia.

  • PEARL #3: As we've often emphasized — DSI is not an indicator of OMI. Instead — it commonly reflects ischemia from severe underlying coronary disease. And although today's patient did not complain of chest pain — given his history of severe alcohol use, his longterm neurologic condition (ie, epidural abscess) — and his reason for hospital admission (ie, a syncopal episode) — the finding of the late-cycle PVC noted above provides one more reason for extra caution in this patient (who may not reliably recall all that he has experienced) — to rule out a recent event by repeat ECG after correction of his severe electrolyte disturbance.

==============================

How to Quickly Estimate the QTc:
As per Drs. Trostel and Meyers — the QTc in markedly prolonged in today's case. 
  • The quick and easy way to tell at a glance if the QTc is likely to be prolonged is the "eyeball" method. Assuming the heart rate is not too rapid (this method works less well with heart rates >90-100/minute) — one may suspect that the QTc will be long if the longest QT interval that you can clearly see on the tracing is more than half the R-R interval.
  • Measurement of intervals is one of the tasks that the computerized ECG interpretation is usually very accurate with (assuming that the computer correctly identifies the end point of the T wave).

  • PEARL #4: To quickly estimate a numerical value for the QTc — I developed a Correction Factor that has been surprisingly accurate for me in assessing too-numerous-to-count QTc values that I’ve estimated over the past 3+ decades.  As per the text under the ECG in Figure-1 — you only need to remember 3 values (ie, 1.1 for a rate ~75/min; 1.2 for ~85/min; and 1.3 for ~100/minute). With a little practice using this method — you can estimate the QTc within seconds.
  • Applying my method to the case at hand — the rhythm in ECG #1 is regular, with an R-R interval sightly under large boxes. I therefore estimated the heart rate at ~80/minute (ie, a bit faster than 300÷4)
  • I selected lead V3 as one of the leads where we can clearly define the onset and offset of the QT interval. I measure the QT in this lead to be ~530 msec. Using a correction factor of 1.15 (since the heart rate ~80/minute) — I estimate the QTc = 530 + [530 X .15 = 80) = 530 + 80 ~610 msec. For speed and ease of calculation — I usually round off values (it’s all an estimate anyway! ) — but I’ve enjoyed being able to get very close to computer-calculated QTc values by this simple correction factor method.

  • PEARL #5: Over the years, I have found recall of a short LIST of Causes of QT Prolongation to be of invaluable assistance. As per My Comment in the March 19, 2019 post of Dr. Smith’s ECG Blog — Assuming there is no bundle branch block, ischemia or infarction (as these entities can prolong the QT) — THINK OF: i) DRUGS (many drugs prolong the QT interval — and combinations of drugs may result in marked prolongation)iiLYTES (ie, Think of low K+ and/or low Mg++ and/or low Ca++)and/oriii) a CNS Catastrophe (ie, stroke, bleed, coma, seizure, trauma, brain tumor)

==============================

Which of the 3 Causes in the above LIST are Likely?
Actually — each of the above causes in my LIST may be contributing to the markedly prolonged QTc in today's case.
  • DRUGS —  Today's patient has been on longterm Ciprofloxacin for treatment of epidural abscess. Cipro is one of a number of drugs implicated in potentially significant prolongation of the QTc (including predisposition to Torsades de Pointes) — especially if administered with other agents that may affect the QTc or when there are other predisposing factors that might affect "repolarization reserve" (such as severe electrolyte depletion) — Prabhakar and Krahn (Heart Rhythm 1(5):624-6, 2004) — and — Blondeau JM (Clin Ther 21(1):3-40, 1999).

  • LYTES — All 3 of the electrolyte disturbances cited by Drs. Trostel and Meyers have been associated with QTc prolongation (ie, hypokalemia, hypomagnesemia and hypocalcemia). Hypokalemia and hypomagnesemia have been associated with identical ECG manifestations — that typically include diffuse ST segment flattening and/or depression and U waves (especially when U wave amplitude surpasses T wave amplitude!). Although difficult to prove in ECG #1 — I suspect that the reason for the very prominent terminal T wave positivity in multiple leads is that giant U waves are fusing with the end of the T wave (in which case rather than a very long "QTc" — we are probably looking at a long QU interval).

  • CNS — As a patient with longterm severe alcohol use disorder and a chronic epidural abscess — with the reason for hospital admission being a new syncopal episode — today's patient presented a series of potential neurological conditions that may be contributing to his marked QTc prolongation (ie, Rather than an episode of Torsades as the reason for this patient's prehospital syncope — perhaps he had an alcohol-related seizure?).


    Our THANKS to Drs. Trostel and Meyers for today's interesting case!
    • I'd love to see the follow-up ECG after correction of this patient's multiple electrolyte disorders. 


    Recommended Resources