Friday, October 29, 2021

A deadly alcohol binge: a man in his 30s with chest pain and initial high sensitivity troponin I within normal limits

Submitted and written by Emergency Physician Dr. Arjun J V, with some minimal edits by Smith and Meyers

A man in his 30s was rushed into our ED on a Sunday morning with continuous chest pain for 2 hours. The patient was drowsy but following simple commands and was pointing to his left chest where it hurt with a single finger. He said the pain started after he tried to vomit forcefully. He also had the odor of alcohol to his breath. The patient voluntarily told the team he had half a bottle of whiskey the previous night and he was uncomfortable ever since he woke up. He did, however, consume alcohol on a regular basis but never at such high amounts.

The information about the binge drinking made the whole team take a non-urgent approach towards the patient. We took our time to settle the patient into bed, secure IV access and by the time we had a cardiac tracing on the monitor, we had the following vitals: HR - 120 bpm; BP - 100/60 mm Hg; SpO2 - 95% on RA. The patient was given antacids, started on IV fluids including thiamine before getting a 12-lead ECG within 10 minutes of arrival. Our differentials included: ACS, Boerhaave syndrome, Pneumothorax, Pancreatitis & GERD.

The monitor showed upsloping ST segments in II. A 12-lead ECG was immediately obtained: 


Here is the same image processed by "PMcardio" app, which so far seems quite good at improving image quality and resolution:


Interpretation: Sinus tachycardia, with RBBB and LAFB. Concordant STE in V2, V3, I, and aVL. The QRS in V4 is isoelectric, with excessive STE. This pattern in ACS is diagnostic of proximal LAD or even left main occlusion. We have shown perhaps 10-20 cases of this ECG pattern on this blog (see links at bottom)!

The cath lab was activated.

ECG POCUS showed anterolateral hypokinesia with an EF of ~40%. It took a while for the team to understand the gravity of this new information and to expedite the further process.

The patient had HTN and DM but was not taking medications; he also smoked cigarettes for many years.

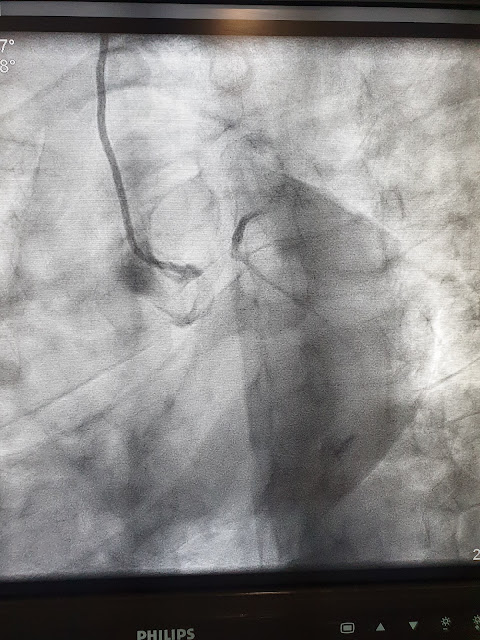
Meanwhile, the patient dropped his saturation and his SBP tanked to 70. Cardiology was also a bit late as it was a Sunday. The patient was taken to the cath lab approximately 60 minutes after arrival and was found to have a 100% occlusion of LMCA (see image below). Patient’s initial high sensitivity Troponin-I was found to be "negative": 17 pg/mL = 17 ng/L (the reported reference range for this assay is apparently 0-50 pg/mL or ng/L).


The above angiogram shows a 100% occlusion of the LMCA. There appears to be possible minimal flow or reconstitution of the LAD and LCX. 

RCA angiogram (above), showing a grossly patent proximal and mid RCA, but which appears to have some distal obstruction.


After PCI of the LM and IABP, the patient coded in the cath lab and was reverted after 2 DC shocks. After another 3 hours in the ICU, the patient had another cardiac arrest and could not be revived. ECMO was not attempted for unclear reasons.


TAKE-HOME POINTS:

Young patients and atypical presentations are important reasons for a delay or missed diagnosis of deadly ACS.

ACS with RBBB and LAFB, usually with some LAD distribution ST Elevation, is diagnostic of proximal LAD or even left main occlusion until proven otherwise. The mortality of such an ECG is very high even before arriving at the cath lab. This is perhaps the highest mortality OMI ECG of all.

You cannot simply hope that an initial high sensitivity troponin will help you realize which patients are high risk ACS and which aren't. A small but important percentage of OMI patients arriving soon after onset of symptoms will have an initial high sensitivity troponin within the normal range. When the troponin is negative or minimal, the benefit of reperfusion is maximal.

Follow up your cases, review their angiograms and clinical outcomes.


See 7 more cases of true total Left main occlusion here:

Here is a post on RBBB + LAFB and its significance, with links to many more such cases:

Here is another case of massive OMI in which binge drinking obscured the judgment of some:


Monday, October 25, 2021

Acute Pulmonary Edema, PEA Arrest, LBBB, First degree AV Block, and STD maximal in V3, V4

An elderly woman had sudden SOB and 911 was called.  Medics found her with labored breathing and 75% saturations.  She was put on high flow oxygen.   After placing her in the ambulance, she had a PEA arrest.  She was intubated and ventilated, and given compression decompression CPR with the ResQPod and ResQPump.

Aside: these 2 devices were invented by researcher Keith Lurie, who is in the Department of EM here at Hennepin; this is the only method of CPR ever proven in a randomized trial to improve outcome in cardiac arrest see this ResQTrial, published in Lancet in 2011: Treatment of out-of-hospital cardiac arrest with an impedance threshold device and active compression decompression cardiopulmonary resuscitation improves survival with good neurological outcome: results from the ResQTrial.  

This research team at Hennepin, which also includes Johanna Moore (Dept of EM) is now both studying and implementing compression decompression CPR with additional head up CPR, and a new head up CPR device called the Elegard.  See this study of head up CPR in porcine model:  Controlled sequential elevation of the head and thorax combined with active compression decompression cardiopulmonary resuscitation and an impedance threshold .  

Read more about the Elegard here at EMS worldRaises Head, Looks Around: The State of Elevated CPR


Case continued

After 2 doses of epinephrine, ROSC was achieved.

The patient arrived intubated and with severe pulmonary edema.

Here was the first ECG:

What do you think?


This shows sinus rhythm with a very long PR interval (extreme first degree AV block), and also shows an LBBB-like IVCD.  LBBB with extreme first degree AV block is similar to trifascicular block and portends complete (third degree) AV block.  If AV block is new and due to ischemia,  AV block suggests that that the RCA is the infarct artery, as it provides perfusion to the AV node.

Dave Richley (ECG guru) says that there are P-waves in the QRSs here and that it is 2nd degree block.  I don't see them but he probably has a better eye than I do.

There is ST depression of 1 mm in V3; this meets the 2nd criterion of the Modified Sgarbossa Criteria (MSC), and so in the setting of chest pain would be positive for OMI.  There is even more ST depression in V4, which in spite of not being part of the MSC, is even more diagnostic of OMI.  

When STD is maximal in V1-V4, it is almost always due to OMI, UNLESS there is tachycardia, especially atrial fibrillation with RVR.  In this case, there is no tachycardia (surprisingly).   One frequently sees ST depression after cardiac arrest due to supply demand ischemia (without OMI), but in such cases, one finds the ST depression of subendocardial ischemia, which is maximal in V5 and V6, with reciprocal STE in aVR.

One aspect is contradictory: OMI does not usually present as PEA in witnessed arrest; if there is witnessed arrest, it is usually shockable.  [In UN-witnessed arrest due to OMI, arrest usually is initiated by ventricular fibrillation which, due to absence of perfusion (no CPR or resuscitation), degenerates into PEA arrest]

With exceptions!!  When the OMI is causing severe pulmonary edema with hypoxia, then hypoxia may result in PEA arrest.  

The COACT trial (very flawed) and the more recent TOMAHAWK trial suggest that cardiac arrest "without ST elevation" is not an indication for immediate angiography.  Of course this does not apply to patients with acute pulmonary edema or cardiogenic shock, and I believe should not apply to patients whose ECGs show OMI (Positive MSC, or other findings).

The Emergency Physician called cardiology; cardiology was reluctant to take the patient to the cath lab.

30 minutes later, another ECG was recorded:
What do you think?


Now there is second degree AV block (P-wave not conducted 3 times).  The ST depression is less.

30 minutes later (time = 60 minutes):

Now there is 2:1 AV block


After this, the patient was taken for angiogram:

Successful temporary transvenous pacemaker placement

Severe multivessel coronary artery disease that includes 90% stenosis of

the mid RCA, severe stenoses of the ostial and proximal circumflex, chronic total

occlusion of the distal LAD, and possible hemodynamically significant

stenosis of the distal left main


In the setting of transient heart block following PEA arrest, severe RCA

stenosis was treated as a possible contributor


Formal Echo:

Regional wall motion abnormality-inferior

Regional wall motion abnormality-inferolateral.


Peak troponin I was over 10,000 ng/L, consistent with OMI.


ECG after PCI:

Notice no AV block at all, not even first degree


And 3 days later:


The patient had complete neurologic recovery.


She was considered a poor candidate for Coronary Bypass and thus would be managed medically with or without additional less invasive coronary intervention.


===================================

MY Comment by KEN GRAUER, MD (10/27/2021):

===================================

Fascinating case (!) by Dr. Smith — fortunately with a positive ending. In the interest of responding to the questions raised by David Richley — I wanted to comment on the cardiac rhythm for the first 3 tracings.


============================

NOTE #1: As per Dr. Smith — this patient's AV block, whch developed following successful resuscitation — totally resolved with reestablishment of normal sinus rhythm following PCI. Therefore — I fully acknowledge that my "deep dive" on the cardiac rhythm is an academic exericse. That said — there are important lessons-to-be-learned regarding arrhythmia interpretation that will be clinically relevant for other cases.

============================


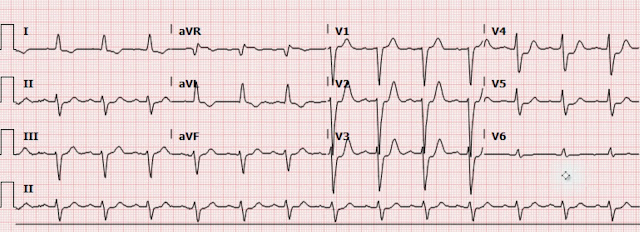
The 1st question that arose — was whether there was 1 or 2 P waves for each QRS complex in the 1st ECG of today's case (Figure-1).

  • Although impossible to be certain of the rhythm from this single ECG in Figure-1 — the reason I immediately suspected that there might be 2:1 AV block, is that the PR interval is so long (ie, ~430 msec.), that it almost occurs in the middle of the R-R interval. Especially given the clinical setting (ie, shortly after ROSC) — AV blocks are common.


My Approach was as Follows:

  • RED arrows in Figure-1 highlight definite sinus P waves.
  • The WHITE arrow highlights slight notching (similar to the slight notching seen within the RED arrow P waves) — but this subtle notching is not seen at this same point in any of the other 9 QRS complexes.
  • Although subtle — there is slight variation in the R-R interval, being just a little bit longer for the first R-R interval between beats #1-2 (which means that there is opportunity for the relative location of a P wave hiding within the QRS to "move" a little with respect to the QRS complex — as per the WHITE arrow).
  • And — IF an extra P wave was hiding within the QRS complex — its location should be precisely midway between RED arrow P waves. The PINK arrows show how this is possible.
  • NOTE #2: I did not yet know for certain that there was 2:1 AV block in this 1st tracing — because the findings I note above are subtle indeed. But I did strongly suspect it! ­— and subsequent tracings proved me to be correct.
  • PEARL #1: All bets are off regarding the cardiac rhythm during a resuscitation (or post-resuscitation) setting. "With code rhythms — the heart simply does not read the textbook". As a result, in this clinical setting — you can see anything, and AV blocks are common.


Figure-1: The first ECG in today’s case. There is sinus tachycardia with 2:1 AV block (See text).


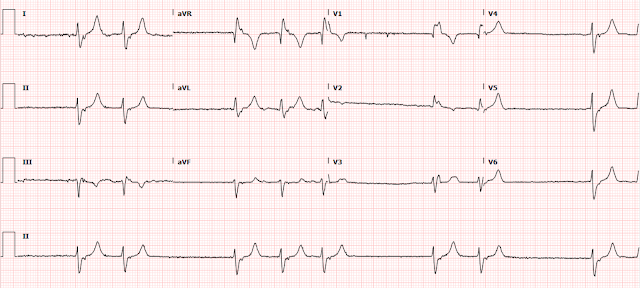
Then came the 2nd ECG — and as per Dr. Smith, some form of 2nd-degree AV block was now obvious. But — What kind of 2nd-degree AV block was present?

  • For clarity — I display the long lead II rhythm strip from ECG #2 with my proposed laddergram in Figure-2. But I immediately suspected this mechanism the moment I saw this tracing.


My Approach was as Follows:

  • RED arrows in Figure-2 highlight sinus P waves. Although some P waves are once again hidden (at least in part) by QRS complexes — there are several places in which we clearly see 2 definite sinus P waves in a row! IF you set calipers at precisely this P-P interval — you can walk out perfectly regular sinus P waves throughout the tracing (RED arrows in Figure-2).
  • PEARL #2: Note that the P-P interval for sinus P waves in Figure-2 is just over 2 large boxes in duration, which corresponds to a sinus tachycardia rate of ~130/minute. IF you return to Figure-1 — you'll note that the rate of the RED and PINK arrows I drew is exactly the same (ie, 130/minute) — and since ECG #2 was obtained just 30 minutes after ECG #1 — this essentially proves that the rhythm in ECG #1 was 2:1 AV block!
  •  
  • Returning to My Approach to the rhythm in Figure-2. Although the ventricular rhythm is not regular — there is group beating! By this I mean that the shorter R-R intervals — and the longer R-R intervals (ie, between beats #1-2; 5-6 and 7-8) are also the same. PEARL #3: Whenever you see group beating — strongly consider the possibility of some form of Wenckebach block.
  • Note that there are repetitive PR intervals in this tracing. That is — the PR intervals before beats #2, 6 and 8 are the same!
  • Calipers tell us that the PR intervals before beats #3,4,5; 7 and 9 are also all the same — albeit slightly longer than the PR intervals preceding beats #2,6,8. The fact that there are 2 sets of repetitive PR intervals tells us that there is conduction (and that there is conduction with an increase in PR interval ...).
  • Note that there is an extra non-conducted P wave between each of the longer R-R intervals in Figure-2. This is what suggested a dual-level of Wenckebach conduction to me, occurring at 2 levels within the AV node (DOTTED line within the AV Nodal Tier in the laddergram). Drawing the laddergram allowed me to prove this theory.


Figure-2: I've labeled P waves in ECG #2 — and added my proposed laddergram below the rhythm strip (See text).


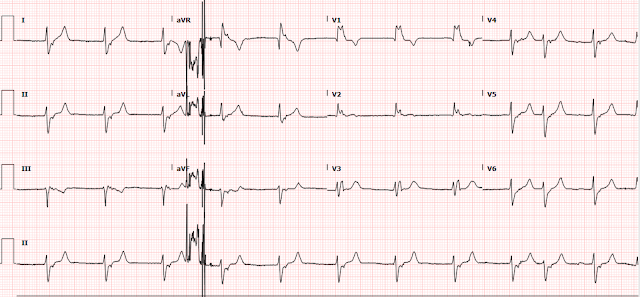
Then came the 3rd ECG. To me — this was the most complex tracing, because this post-resuscitation rhythm "simply does not obey the rules ... ". This 3rd ECG is not simple 2:1 AV block (Figure-3).

  • As shown by the RED arrows — sinus P waves are once again regular at the same atrial rate of ~130/minute. But something is changing ...
  • As I portray in the laddergram — I believe the first 4 beats represent a similar dual-level Wenckebach pattern as we saw for the longer R-R intervals in the laddergram for Figure-2. This explains why there are 3 P waves for each QRS complex for these first 4 beats in Figure-3. Note that the PR interval remains constant before the first 4 QRS complexes.
  • However — Note that the PR interval changes before beats #6 and 7. This is easiest to see if you focus the the P waves labeled "b" and "c" — which clearly show a changing relationship to their neighboring QRS (ie, to beats #6 and 7).
  • Note that the R-R interval gets longer at the end of ECG #3 (from 1240 msec. at the beginning of the tracing — to 1320, and then 1400 msec. at the end of the tracing). I do not know why ... Perhaps there is development of transient complete AV block with junctional escape beats? — or perhaps simply a change in the PR interval during Wenckebach conduction?


Figure-3: I've labeled P waves in ECG #3 — and added my proposed laddergram below the rhythm strip (See text).


In Conclusion: I thought this series of rhythms was fascinating. Even though I was unable to elucidate the specific mechanism for the 3rd tracing — the clinical points to emphasize are:

  • AV blocks are common in the setting of cardiac arrest — and these types of AV block "do not always obey the rules". 
  • Always consider the possibility of 2:1 AV block whenever you see PR prolongation with P waves consistently seen near the middle of the R-R interval.
  • Recognition of group beating and 2 or more repetitive PR intervals should suggest some form of Wenckebach conduction.
  • Various forms of AV Wenckebach that arise in association with acute MI (and/or cardiac arrest) may resolve when the acute ischemic process is controlled. Despite what seemed to be severe 2nd-degree AV block — no pacemaker was ultimately needed for this patient.

  • P.S. IF interested in learning more on how to read and/or draw LaddergramsCLICK HERE


Friday, October 22, 2021

An elderly man who dies 12 hours later - could he have been saved?

Sent by Anonymous, written by Pendell Meyers and Steve Smith


An elderly man with good neurologic baseline but history of CABG presented to the ED with acute lightheadedness, shortness of breath, and chest pressure radiating to both arms. He had just recently been admitted for similar symptoms which had been diagnosed as an NSTEMI, and he received a stent to the ostial LCX one week ago. At that time his EF was 30%. 

He returned to the same hospital where he had just received his LCX stent.


Here is his first ECG at triage, with chest pain temporarily resolved:


He then had spontaneous return of chest pain while in the ED, with this ECG:

What do you think?


The first ECG has an intra-ventricular conduction delay (IVCD) which is of the LBBB type (for textbook LBBB most would list a monophasic R wave in lateral leads V6 which is not present in this case).  For such a QRS complex, the modified Sgarbossa criteria should be used. With the exception of lead V2, there is appropriate ST segment discordance.  However, in V2 there is no discordance (i.e., it is isoelectric, which suggests that there is relative ST depression).  Moreover, the ST segment is downsloping, which should never happen in LBBB. This is nearly diagnostic of posterior OMI, to the point where serial ECGs and close investigation is mandated.  Additionally, there may be evidence of inferior involvement, with slightly too much STE and large volume T waves.

The 2nd ECG does indeed evolve to the point where the modified Sgarbossa rule is positive, with concordant STD in V2 and V3 (and also in V4,5)

Bottom line: the 2nd ECG clearly meets original and modified Sgarbossa criteria with concordant STD maximal in V1-V4. It is diagnostic of acute posterior OMI until proven otherwise, in the setting of this patient with clear ACS symptoms.


Here was his most recent ECG on file (not a baseline, recorded at the end of his stay for his NSTEMI)

Looks like posterior reperfusion T waves, which would make sense for a LCX STEMI(-) OMI. Notice the QRS is narrower at this time, without LBBB, but you could call it LAFB.


The EM provider diagnosed positive Sgarbossa criteria given the concordant STD in leads V2 and V3, and activated the cath lab.

The cardiologist cancelled the activation. 

The first troponin (high sensitivity trop T) returned at 1600 ng/L.   Again they tried to get the patient considered for emergent cath, with ongoing pain despite aspirin and heparin. But the cardiologist refused.

Side note: high sensitivity troponin T cannot directly be translated to compare to the older assays with which we have studied OMI, but we can make a rough guess: 2,000 ng/L roughly equals 2.00 ng/mL, well above our cutoffs used in our OMI studies (1.00 ng/mL for contemporary troponin T assays). This is a large MI.  (This level of troponin T is roughly equivalent to high sensitivity troponin I of over 20,000.)  

See this study of hs trop T in OMI: Baro R, Haseeb S, Ordoñez S, Costabel JP. High-sensitivity cardiac troponin T as a predictor of acute Total occlusion in patients with non-ST-segment elevation acute coronary syndrome. Clin Cardiol [Internet] 2019;42(2):222–6. Available from: https://onlinelibrary.wiley.com/doi/abs/10.1002/clc.23128

Troponin peaked at 2000 ng/L in the middle of the night.


Early the next morning the patient developed progressively worsening hypoxemia and hypotension.


He coded and died about 12 hours after ED arrival.


No angiogram was ever done during that visit, and no autopsy was requested.


It is clear that this patient died of untreated posterior OMI, leading to cardiogenic shock, with the thrombosis at the new LCX stent being the obvious culprit. 

This patient had countless indications for emergent cath, and several advocates who tried to get this patient the correct care. But still was denied proper treatment and died.

I get these cases all the time. Sadly, it is a normal event in 2021 under the STEMI paradigm, despite the fact that it is so easily diagnosable, and even when it is not diagnosed on ECG, there are multiple guidelines that indicate that this patient deserves angiogram for ongoing ACS despite medical management and ACS with cardiogenic shock.

If you are a cardiologist reading this case, I would really appreciate your insights for the following questions: given the fact that this case was most likely an occlusion at the site of his LCX stent that had just been placed 1 week ago, what are the "repercussions" of that event in terms of metrics and statistics? Is the cardiologist disincentivized to cath the patient for fear of diagnosing a "complication" of the stent 1 week ago? What actual, tangible repercussions happen to the cardiologist? to the cardiology department? Please help us understand why these seemingly easy decisions are more complicated than we can see.


Learning Points:

Use the modified Sgarbossa criteria for LBBB (studied and proven), ventricular paced rhythm (studied and proven), and also for other LBBB-like QRS complexes (not yet studied). The principles of appropriate discordance can be applied to all wide QRS complexes in general.

In the setting of ACS clinically, whether in LBBB or in normal conduction, STD max in V1-V4 is posterior OMI until proven otherwise.

Regardless of the ECG, patients with ACS with ongoing ischemia (as shown by ECG ischemia or ongoing symptoms) despite medical management, or with electrical instability or cardiogenic shock, should receive emergent angiogram as per all guidelines. 

"NSTEMI" OMIs have almost double the mortality of NSTEMIs without OMI. Patients like this one make it obvious why this is. 

Monday, October 18, 2021

I thought the ECG diagnosis was obvious. But many missed it. So I'm showing it.

I was reading ECGs in the system and came across this one:

What do you think?

Computer diagnosis: 

--ST DEVIATION AND MARKED T-WAVE ABNORMALITY, ANTEROLATERAL ISCHEMIA 

--ST DEVIATION AND MODERATE T-WAVE ABNORMALITY, CONSIDER INFERIOR ISCHEMIA 


I thought the ECG diagnosis was obvious, but no comment was made by the providers who ordered it.  That could be because they never saw it, as the patient eloped before full evaluation.  

But then I showed it to multiple smart providers and not a single one saw it.  So I thought it would be good to show it to blog readers.

Everyone went straight to the ST-T abnormalities, and came up with diagnoses such as pulmonary embolism, or subendocardial ischemia.

However: whenever you see ST-T abnormalities (abnormal repolarization), first look to see if they are secondary to (as a result of) abnormal QRS (abnormal depolarization).

Read the ECG systematically: Rate, rhythm, intervals, axes, voltages (QRS, ST, T), ratio of ST-T to QRS, morphologies

Here, the QRS is definitely abnormal.  The most obvious abnormalities are a large R-wave in V1 (and also V2, V3...) and also high voltage.  And also wide QRS interval -- so the QRS (depolarization) is clearly abnormal. But look more closely still: there is a short PR interval.  This should make you look for a delta wave.  

And there it is, pretty clearly evident in nearly all leads!!

This is WPW with typical repolarization abnormalities.  All of these ST-T abnormalities are expected, as they are secondary to the abnormal depolarization of pre-excitation.

I went to the chart:

This 20-something woman presented after smoking marijuana. She believes that it may have had some other drug added to it because she has had no similar reactions from past marijuana smoking. She reports that everything feels slow and distant. Endorses chest pain and auditory hallucinations. Denies EtOH/other drugs.

She had an ECG recorded and was put in the waiting room.  The wait was too long and she eloped.

After seeing this ECG, I called her back and made an appointment in Cardiology clinic.


Here are a number of interesting WPW cases:

WPW mimicking and obscuring acute MI (5 Cases)


(Case 5 is an amazing case that Pendell sent me when he was still an undergraduate)


Saturday, October 16, 2021

A 50s year old man with lightheadedness and bradycardia

 Written by Pendell Meyers with edits by Smith and Grauer


A man in his 50s with history of end stage renal disease on dialysis, prior bradycardia episode requiring transvenous pacemaker, diabetes, and hypertension, presented to the ED for evaluation of acute onset dizziness and lightheadedness starting several hours prior to arrival. These symptoms prevented him from going to dialysis, and his last session was three days ago. EMS found him with a heart rate of 30 bpm but normal blood pressure. He received 0.5 mg atropine with increased in heart rate to the 60s with improvement in symptoms. He denied chest pain or shortness of breath. 

Here is his triage ECG at 1533:


There is a regularly irregular rhythm with RBBB and possibly also LAFB morphology. The T waves are definitively peaked in many leads. The rhythm is possibly junctional with pauses or block, I'm not exactly sure. I asked Ken Grauer for help with this rhythm and he agrees it cannot be atrial fibrillation due to the irregular regularity, but with the artifact present also cannot definitively find atrial activity. His bottom line: "This rhythm is not 'following the rules' - so either hyperkalemia - or some other toxicity - or very severe and diffuse conduction system disease producing junctional escape with bifascicular block with some complex form of exit block." See his full comments reproduced at the end of the post. 

This ECG is diagnostic of significant hyperkalemia.

He was immediately given 2gm calcium gluconate, insulin and dextrose. Shortly after those therapies his heart rate is documented as improved to the 70s.

Initial labs showed a potassium level of 7.7 mEq/L.


Repeat ECG at 1801:

Improved heart rate and narrower QRS.


He later received a second dose of 2 gm calcium gluconate for down-trending heart rate.

He was emergently dialyzed and did well.

No more ECGs were recorded from this visit, unfortunately.


Approximately 1 year prior to this event, he had a similar event and presented with this ECG:

Junctional escape with similar RBBB and LAFB morphology, and peaked T waves. Notice the flat ST segments and narrow base of the T waves. This ECG was apparently not recognized as hyperkalemia (!). In my experience, these are some of the most commonly missed and dangerous hyperkalemia ECGs because many practitioners rely heavily on strikingly peaked T waves to start considering hyperkalemia on ECG. These T waves are in fact peaked, but they are more subtle than the textbook hyperkalemia ECG.


During this visit, the patient received transcutaneous pacing and an emergent transvenous pacemaker before the labs showed a potassium level of 7.3 mEq/L!

After treating his hyperkalemia, the pacemaker was successfully discontinued. He never received a permanent pacemaker.

After dialysis during that visit, a repeat ECG was recorded showing resolution of the RBBB/LAFB:

Notice the marked difference in the T-waves


Learning Points:

In medical school, I worry that the only consistent teaching you get about hyperkalemic ECG findings is peaked T waves and QRS widening. What should be taught includes the "Killer B's of Hyperkalemia": Broad (QRS widening), Brady (bradycardias), Blocks (AV blocks, bundle branch blocks), and Bizarre (bizarre morphology, OMI mimics, etc.). Some of the most important hyperkalemia ECGs are like the above: QRS widening that can be subtle or falsely blamed on RBBB alone, and T waves that are not perceived as classically peaked. Yet this ECG above is far more dangerous and far more hyperkalemic than the classic hyperkalemia ECG with only peaked T waves in the textbook.

Before you consider pacing a patient, consider hyperkalemia. I would go so far as to say that every patient about to be paced should receive calcium, unless there is certainty of a non-hyperkalemia diagnosis as the cause.


=====================================

Ken Grauer's comments on the rhythm in the first ECG of this case (he was completely blinded to all case details, just the ECG):

This is tough — and I do NOT have a definite answer. I labeled the tracing (Figure-1):

Figure-1: The 1st tracing in today's case.


Artifact makes it difficult to assess for the presence of atrial activity. I thought BLUE arrows might represent retrograde P waves (as their placement seems pretty consistent) — but there is a lot of “noise” in the baseline — so I’m not sure if this really represents retrograde atrial activity or not …

What we DO know — is that the QRS is wide, and NO P wave precedes any QRS. We also know (as per Pendell) — that this isn’t AFib, because there is a definite pattern ( = a “regular regularity” to the rhythm) — with both the short intervals (between #1-2; 4-5; 6-7) all equal — and the long intervals (between #2-3; 5-6; 7-8) also all equal.

My #1,2,3 questions are what is the serum K+ level? We have a wide QRS and T waves really are peaked in multiple leads (even though the base of these T waves isn’t as narrow as is usually seen with hyper-K+) — but Hyperkalemia is notorious for QRS widening, brady rhythms and ALL SORTS of conduction disorders that do not “obey the rules” …

So if K+ is normal — then we really have an RBBB/LAHB configuration without sinus P waves — so suggesting perhaps origin of a ventricular rhythm near the left anterior hemifascicle — vs junctional escape with bifascicular block … (the surprisingly narrow initial part of the QRS suggests origin not directly from ventricular myocardium).

What is unusual for a simple block (or “exit block”) — is that the duration of the pauses. You can have an ectopic ventricular focus (even VTach) with various degrees of “exit block” out of the ventricular focus — but against the usual form of exit block is the fact that the long intervals (between #2-3; 5-6; 7-8) is clearly MORE than twice the shortest interval …

Of note — the R-R interval between beats #3-4 is LONGER than that between #4-5. I do not think this is for chance — and this is what you tend to see with Wenckebach phenomenon — but unlike typical Wenckebach phenomena is the overly long pauses (more than twice the shortest R-R interval). NOTE — You CAN have a ventricular rhythm (including VTach) with a Wenckebach-type of exit block … 

BOTTOM LINE: This rhythm is not “following the rules” — so either hyperkalemia — or some other toxicity — or very severe and diffuse conduction system disease producing junctional escape with bifascicular block (vs ventricular escape near the anterior hemifascicle) with some complex form of exit block …

Hope the above is helpful. Let me know if you find out more clinically about the patient — :) Ken

==============================


Here are a couple other cases of hyperkalemia with small, but peaked, T-waves:

Patient with Dyspnea. You are handed a triage ECG interpreted as "normal" by the computer. (Physician also reads it as normal)


This is on a previous visit with K = 6.6:


After treatment: 


ST Elevation in I and aVL, with reciprocal ST depression in lead III


Thursday, October 14, 2021

A New Seizure in a Healthy 20-something

A 20-something year old who is the picture of good health presented with a new onset seizure.  A witness described what sounded like a 3 minute tonic-clonic seizure.  

Her seizure workup was negative and she was scheduled for an outpatient MRI and EEG.

Because she was persistently tachycardic, an ECG was recorded.  At the time her K was 3.2 mEq/L:

Here is the interpretation by the computer, confirmed by the over-reading physician:
JUNCTIONAL TACHYCARDIA
INTRAVENTRICULAR CONDUCTION DELAY  [130+ ms QRS DURATION]
ABNORMAL ECG

P-R Interval 116 ms
QRS Interval 158 ms
QT Interval 422 ms
QTC Interval 485 ms
P Axis 259
QRS Axis 88
T Wave Axis 36

What do you think?


When I saw it, I was immediately alarmed:

First, I think there are P-waves underneath all that artifact, so it is not a junctional rhythm.  

The abnormality is in the QRS and QT intervals.  I measure QT at 500 ms, with Hodges correction (what our computer uses) = 582 ms, Bazett = 668 ms. Part of this long QT is the wide QRS, which the computer measured at 158 ms. If you deduct that extra QRS duration, you get a QT of 440 ms.  I think the QRS duration was also erroneously measured and it is really 130 ms.  Thus, the QT would be about 470 ms without this extra QRS duration, with the corrections at 552 ms (Hodges) and 628 (Bazett).  

What constitutes a long QT in the setting of prolonged QRS such as LBBB, RBBB, and Paced rhythm is complicated and beyond the scope of this post, but suffice it to say that the JT and JTc intervals are very useful, as is the T-peak to T-end interval, which measures the part of the QT which is most prolonged in patients at risk for Torsades: the last part of the T-wave.

The findings are NOT due to a K of 3.2.

A QRS of this duration in an otherwise healthy patient is also a red flag — extremely abnormal — always requiring further investigation.   

NEVER trust the computer QT measurement.  NEVER.  

Below I put in links to 7 of the many cases I have in which the computer missed a dangerously long QT.

Here we write about this (full text): 

Screening for QT Prolongation in the Emergency Department: Is There a Better “Rule of Thumb?”   https://www.ncbi.nlm.nih.gov/pmc/articles/PMC7081881/pdf/wjem-21-226.pdf

Summary: if the heart rate is over 60, then use the rule of thumb that if the QT is more than half the RR interval, it is probably long and must be measured by hand.  If the heart rate is under 60, measure the QT and if the raw QT is over 485 ms, then it is too long.

Case Continued

I saw the patient in the ED and syncope never occurred to me.  It seemed so much like seizure by history that I did not even order an ECG.  Fortunately, after I left and before the patient was discharged, she did get an ECG recorded.

Unfortunately, the findings were not appreciated.

So when I was signing my charts the next day, and found that an ECG was recorded, I naturally looked at it (it is the ECG at the top of the post).

I texted the ECG and the story to our electrophysiologist, and he texted back "WOW!"

Outcome.

Next day she returned after I called her back.  This was her ECG with a K of 4.0:

Now there are prominent U waves in almost all leads, creating a long QU interval.  The QRS is again long at 140 ms.


Here is another:


And this one is STANDING (which is useful in congenital long QT syndrome)!!


There is more to the story which makes it even more fascinating, but that will have to wait for a formal published case report.


More cases of long QT not measured correctly by computer (these are all fascinating ECGs/cases):

Bupropion Overdose Followed by Cardiac Arrest and, Later, ST Elevation. Is it STEMI?


Recommended Resources