
A 60-something called 911 for chest pain.
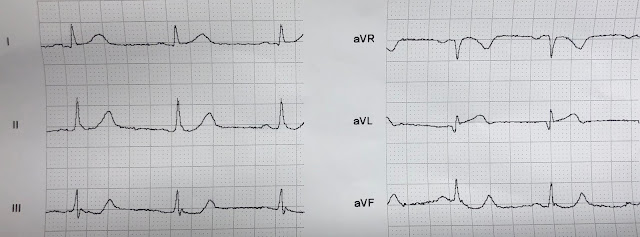
Medics recorded an ECG at time zero:

There is no ST elevation, but V2 has a definite hyperacute T-wave. Inferior leads have a tiny bit of ST depression (this is very significant). aVL has a tiny amount of coved ST elevation in the presence of a tiny QRS. These are all very very suspicious for proximal LAD OMI.
They recorded another at 20 minutes:
Repeat at 25 Minutes:

And another at 30 minutes:

The patient arrived in the ED.
This is the first ED ECG (at t = 40 minutes):
The cath lab was activated.
2nd ED ECG 60 minutes
A Proximal LAD occlusion was found and stented.
ECG after reperfusion
Next day
Peak trop I 85.6 ng/mL (very large OMI)
Anterior Wall Motion Abnormality
At no point in time did the computer read a STEMI
Learning Points:
1. Acute LAD occlusion frequently does not manifest ST Elevation that meets "criteria"
2. Look for hyperacute T-waves (relative to QRS amplitude/voltage)
3. Look for any inferior ST depression, even minimal
4. Do serial ECGs.


Medics recorded an ECG at time zero:

 |
| What to you think? |
There is no ST elevation, but V2 has a definite hyperacute T-wave. Inferior leads have a tiny bit of ST depression (this is very significant). aVL has a tiny amount of coved ST elevation in the presence of a tiny QRS. These are all very very suspicious for proximal LAD OMI.
They recorded another at 20 minutes:

 |
| Evolving anterior OMI, but with barely any ST Elevation. Look at the huge size of the T-wave in V4 relative to the R-wave. Increasing STE in aVL Increasing inferior reciprocal ST depression If you doubted LAD occlusion on the first one, there is no doubt any more. This is diagnostic |

 |
| Further evolution. Absolutely diagnostic of acute LAD occlusion. |
And another at 30 minutes:

 |
| The computer never noticed the myocardial infarction on any of these ECGs. |
The patient arrived in the ED.
This is the first ED ECG (at t = 40 minutes):
 |
| Computer did not comment on acute MI. The attending physician brought this to me without any of the other ECGs and asked my opinion: With 3 seconds, I said: Acute LAD Occlusion. It is diagnostic of LAD occlusion all on its own, without even comparing to the others. This is what my partner thought also, but just wanted confirmation. |
The cath lab was activated.
2nd ED ECG 60 minutes
 |
| Now there is diagnostic ST Elevation, but barely. Computer still did not comment on STEMI |
A Proximal LAD occlusion was found and stented.
ECG after reperfusion
 |
| Typical Reperfusion T-waves, similar to Wellens' waves (and same pathophysiology), but different in that true Wellens' waves have preservation of R-wave. This has a QS-wave in V2 because of extensive infarction, in spite of rapid reperfusion. |
Next day
 |
| QS-waves with reperfusion T-waves again |
Peak trop I 85.6 ng/mL (very large OMI)
Anterior Wall Motion Abnormality
At no point in time did the computer read a STEMI
Learning Points:
1. Acute LAD occlusion frequently does not manifest ST Elevation that meets "criteria"
2. Look for hyperacute T-waves (relative to QRS amplitude/voltage)
3. Look for any inferior ST depression, even minimal
4. Do serial ECGs.
===================================
Comment by KEN GRAUER, MD (6/26/2019):
===================================
Our THANKS to Dr. Smith for this superb example of serial evolution of acute LAD occlusion (OMI) — starting in the prehospital phase — passing through the ED — and following reperfusion of the occluded artery.
- I limit my comments to ECG #1 = the initial ECG done by medics in the field on this 60-something patient with new-onset chest pain. For clarity — I’ve put the 2 parts of this tracing together, and have added a few aids for ST segment shaping to facilitate visualization (Figure-1).
 |
| Figure-1: The initial ECG in this case, done by medics in the field (See text). |
My THOUGHTS on ECG #1 — Dr. Smith has done a great job with his tracing-to-tracing description of important findings for the 8 ECGs in this case.
- KEY Take-Home POINT: Given the history of new-onset chest pain in this patient — you should be 100% certain of the need for prompt cath from this 1st ECG alone. Your clinical assessment of ECG #1 in Figure-1 should be acute LAD occlusion until proven otherwise!
KEY ECG Findings in Figure-1:
- Leads V2 and V3 were the 1st to catch my eye! That the T waves in these 2 leads are hyperacute should be obvious from how disproportionate these T waves are compared to the tiny r wave in V3, and lack of any r wave at all in lead V2. Note how fat-at-their-peak and wide-at-their-base these T waves are. Note also straightening of the ST segment upstroke in lead V2 (angled BLUE line in this lead) — such that the normal upward concavity of the ST segment in lead V2 has been lost.
- There is loss of anterior R waves. A tiny initial r wave seems to be present in lead V1. This is completely lost by lead V2 (which manifests a deep QS complex). The r wave returns in lead V3 — but is still considerably smaller-than-it-should-be for a lead V3.
- Next, looking at “neighboring leads” — There is at least 1 mm of ST elevation with definite coving of the ST segment in lead V1 (“frowny”-shaped BLUE line in V1). This is not a normal lead V1 appearance — but rather reflects extension of the ongoing process (ie, the hyperacute T waves in leads V2 and V3). Thus, acute ST-T wave changes begin as early as lead V1.
- Continuing with the concept of “neighboring leads” — hyperacute T wave changes are clearly seen in lead V4 (with a disproportionately large T wave in V4, that is more than half the height of the R wave in this lead — as well as this T wave in V4 being fat-at-its-peak and wide-at-its-base). Although the T waves in leads V5 and V6 are not particularly tall — they share the fatter-at-their-peak-than-they-should-be appearance that we have already seen in leads V2-thru-V4. Leads V5 and V6 also manifest scooped and slightly depressed ST segments — that in the context of everything else are not normal.
- NOTE: Confirmation that ST-T waves in all 6 chest leads were abnormal in ECG #1 is forthcoming through comparison with the last 2 tracings (obtained after reperfusion) in this case.
PEARL: When contemplating the likely location of acute LAD occlusion — I look for the following 3 Clues, which when present suggest a more proximal LAD lesion:
- Is there ST elevation (or at least acute-looking ST segment coving) in lead aVL? ( = Yes, in Figure-1 — as suggested by the coved BLUE line in lead aVL). Note that this ST coving in lead aVL ends with terminal T wave inversion. There is also a surprisingly wide q wave in lead aVL, which may reflect the ongoing acute process.
- Is there reciprocal ST depression in the inferior leads? ( = Yes, in the form of scooped ST segments — as highlighted by curved BLUE lines in these inferior leads). Inferior lead T waves also look prominent in Figure-1 (a bit larger, and fatter-than-they-should-be at their peak).
- How early in the chest leads do acute/hyperacute ST-T wave changes begin? ( = slight ST elevation with ST coving begins as early as in lead V1 in ECG #1).
Bottom Line: Given the history of new-onset chest pain — You should be able within a minute (or less) of seeing this initial ECG in Figure-1 to: i) Be confident in strongly suspecting acute proximal LAD occlusion until proven otherwise; and, ii) Know that you should immediately contact the cardiologist on call as you are activating the cath lab!
- As per Dr. Smith — the diagnosis of acute proximal LAD OMI is solidified beyond doubt by subsequent tracings — but these subsequent tracings were not needed to justify immediate cath lab activation in this case. All that was needed given the history of new chest pain — was a quick look at ECG #1 in Figure-1.
this is another case of the "Zaftig T's" (pathologically large T's in relation to their QRS's). the third pre-hospital ecg also, i think, showed a de winter-ish wave in lead V3, but it was clearly OMI already.
ReplyDeletei wonder, were the EMS strips transmitted? could the cath lab have been called before the patient arrived?
just wondering.
thank you again Steve and Ken.
tom,
Deletewe don't transmit EKGs, and medics are not supposed to activate unless the computer reads ***Acute MI***
They sometimes do it anyway, but did not in this case.
Steve