
Written by Willy Frick
This blog has repeatedly made the point that ECGs must always be interpreted in clinical context. But sometimes just for fun we like to try to scrutinize ECGs in a vacuum. It increases the difficulty level. Look at this ECG and try to figure out what it represents.
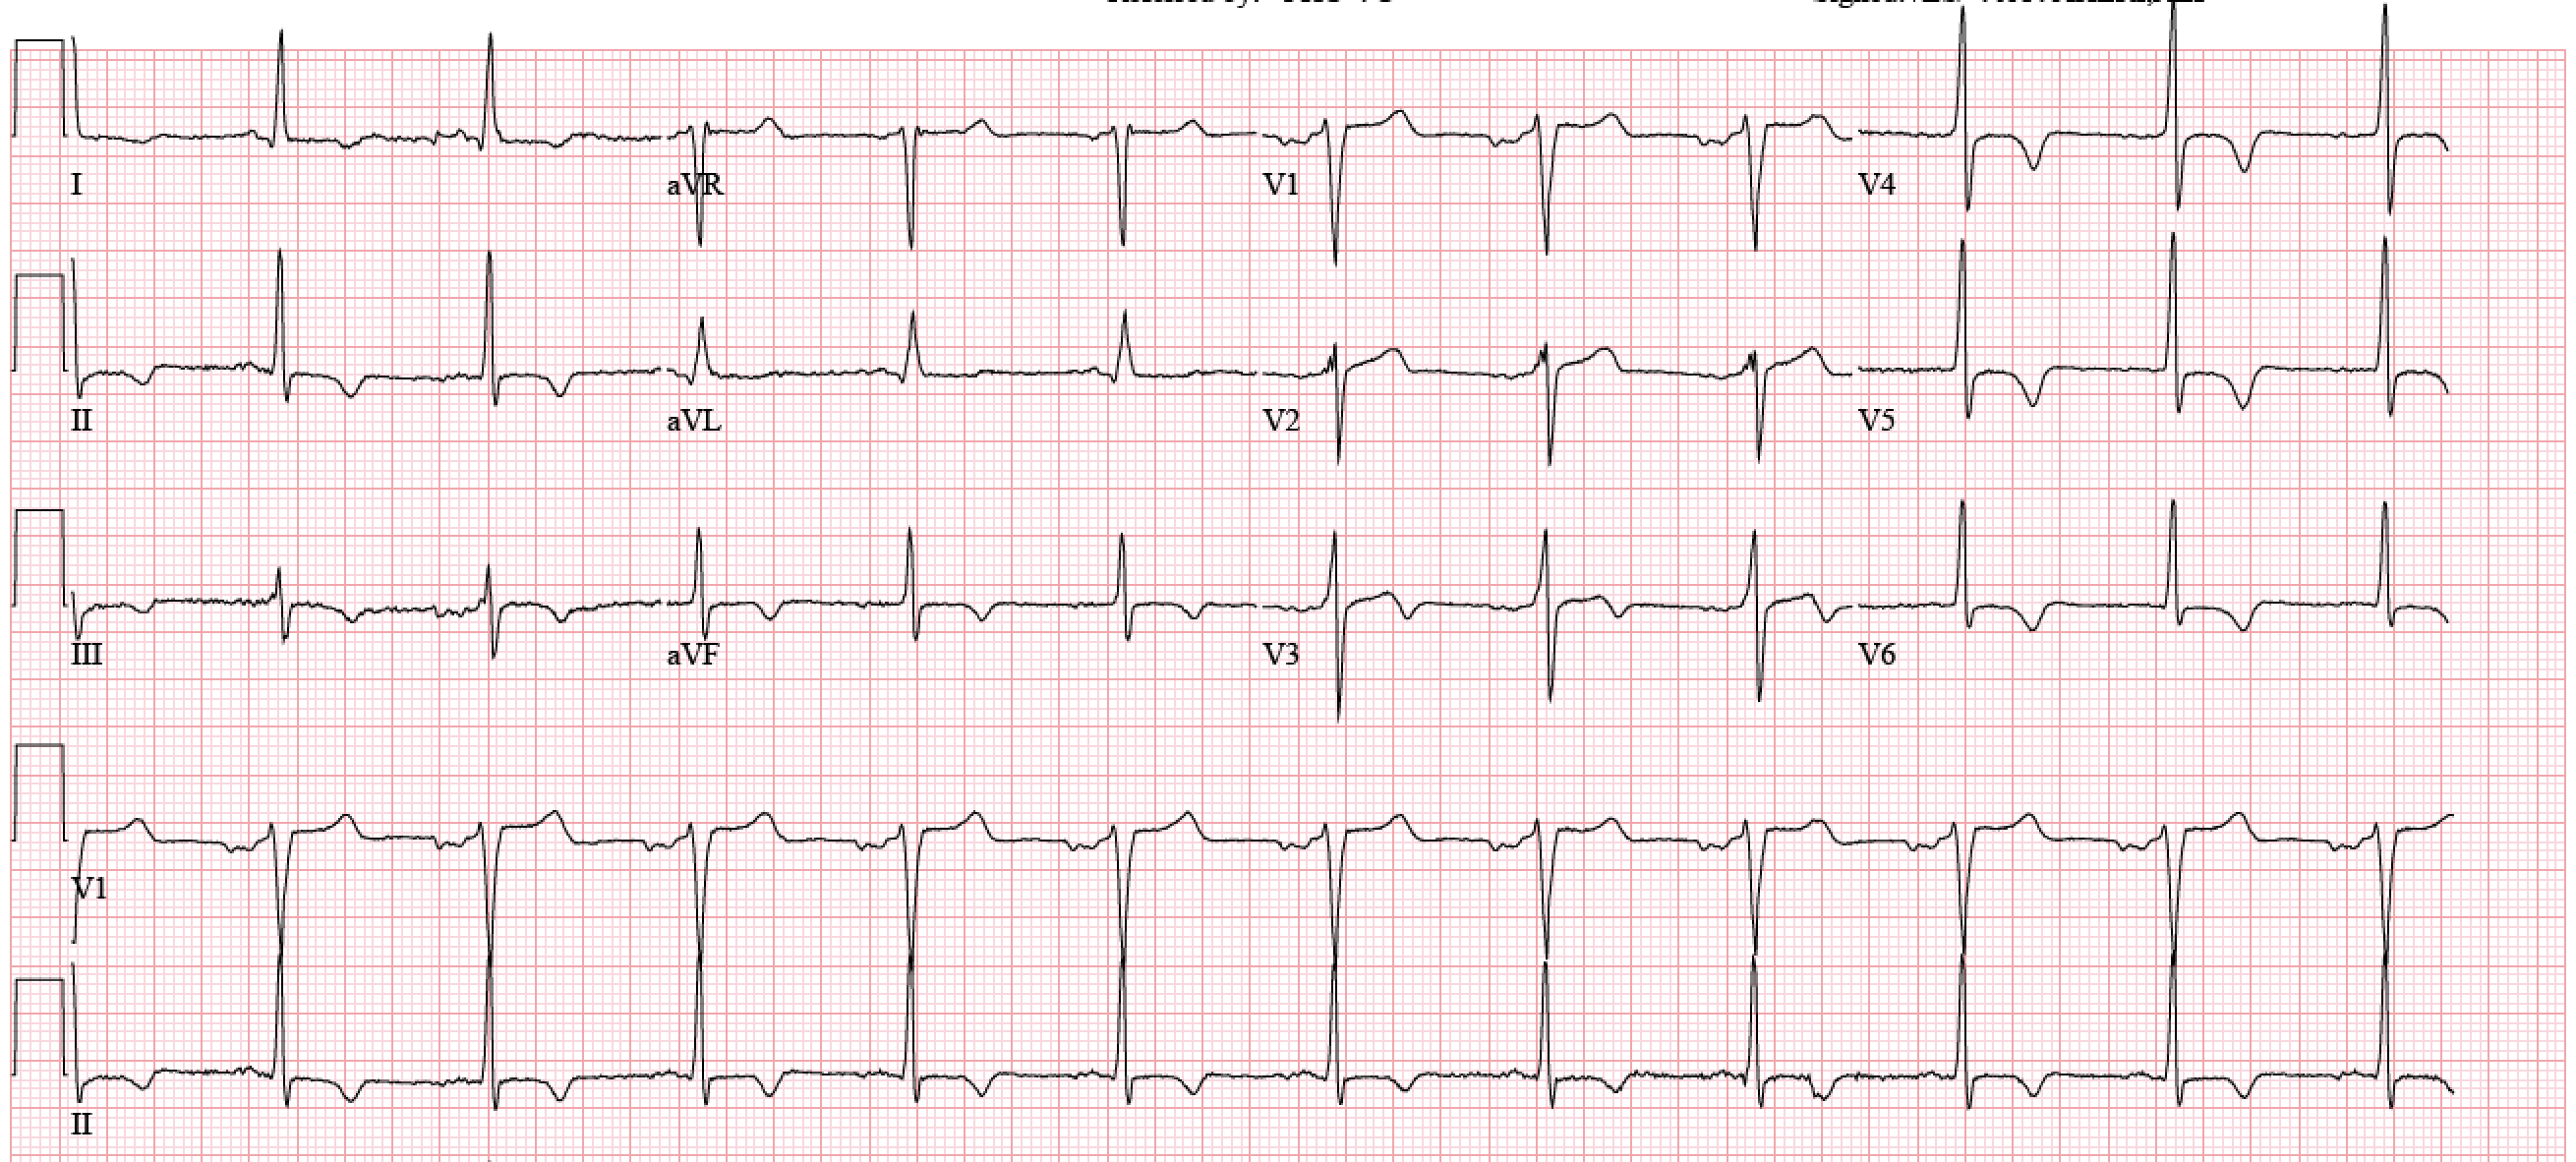
ECG 1

What do you think?
_______
Smith: I saw this before reading on, and was 95% certain it represented a reperfused OMI, vs. 5% for takotsubo. I did not think LVH at all. I see below that LVH was on Willy's ddx. But LVH rarely has an upsloping ST segment, as is the case here. There is also not a lot of voltage. The echo may show LVH, but the ECG does not. An upsloping ST segment, followed by a sudden downturn and a negative T-wave, is very typical of reperfusion.
This is identical to the pattern that Wellens described for the LAD territory. But he did not know that it is a reperfusion pattern, and that when the patient had active pain, there was active occlusion. He also did not know that the same pattern can happen in inferior and or lateral leads. And an analogous pattern (posterior reperfusion T-waves) can happen in right precordial leads as a reciprocal finding to T-wave inversion that would be recorded on the posterior wall if leads were placed there.
The best criteria for LVH are relatively new*: Take the sum of the amplitude of the deepest S wave in any lead plus the S wave in lead V4. If the deepest S-wave is in V4, then double that value. If the total is greater than 2.3 in women, and greater than 2.8 in men, the LVH is diagnosed." In this case, the deepest S-wave is V3. V3 = 11. V4 = 9. The sum is 20. Therefore not LVH by ECG criteria. I think also not by other voltage criteria.
Criteria are frequently falsely negative (or falsely positive). Repolarization (ST depression and T-wave inversion, of the LVH morphology) is very helpful in making the ECG diagnosis of LVH, and also has prognostic significance, with four times the risk of cardiovascular disease at 7 year followup .
*Peguero JG et al. JACC 69(23)1694-1703; April 4, 2017.
__________
Willy: I knew the outcome before I saw the ECG, so I cannot give my honest first impression. The most likely differentials are reperfused inferolateral OMI, takotsubo, and left ventricular hypertrophy with repolarization abnormality. If I had to pick the most OMI-like feature, I would say down-up T waves in aVL which is always very suspicious for inferior OMI.
Fortunately for this patient, diagnosis was not difficult. He is a man in his late 50s with hypertension, hyperlipidemia, and prior stroke who presented with acute onset, severe substernal chest pain with dyspnea and diaphoresis. His presenting ECG was positive for STEMI on the conventional machine algorithm.
ECG 2

Cath lab was activated and he promptly underwent coronary angiography which showed acute thrombotic occlusion of distal LCx status post drug eluting stent. His initial troponin was undetectable, but there were no repeat measurements.
ECG 1 was recorded after PCI, hence it does represent inferolateral reperfusion.
So why did ECG 1 look so confusing? I think if I had been blinded, I would have had a tough time deciding between inferolateral reperfusion and LVH. Answer: It's BOTH.
Apical 4 chamber shows inferoseptal wall on the left side of the image and anterolateral on the right

Apical 2 chamber shows inferior wall on the left side of the image and anterior on the right

Apical 3 chamber shows inferolateral wall on the left side of the image (hypokinetic) and anteroseptal on the right
This patient has severe left ventricular hypertrophy most prominent at the apex, possibly consistent with apical HCM (vs severe standard LVH). This explains why the ECG 1 is unusual looking. It shows inferolateral reperfusion layered on top of the patient's baseline LVH strain pattern, shown below in a prior ECG obtained during presentation for a non-cardiac complaint.
ECG 3: Prior baseline
Smith: notice that in this baseline ECG, the T-waves are all negative, without the upsloping ST segment (with the exception of V3, which is transitional between V2 and V4).
No comments:
Post a Comment
DEAR READER: I have loved receiving your comments, but I am no longer able to moderate them. Since the vast majority are SPAM, I need to moderate them all. Therefore, comments will rarely be published any more. So Sorry.