Written by Willy Frick
— Commentary added below on 6/4/2025 by Ken Grauer regarding ETT
A 90 year old man with history of hypertension, hyperlipidemia, and stroke with mild memory difficulty presented to his primary care clinic complaining of left shoulder pain radiating down the arm. He said the pain is often produced by activity, but sometimes comes on at rest. He walks to the post office daily and cuts his own grass. His primary care physician referred him for stress testing. His clinic ECG is shown.
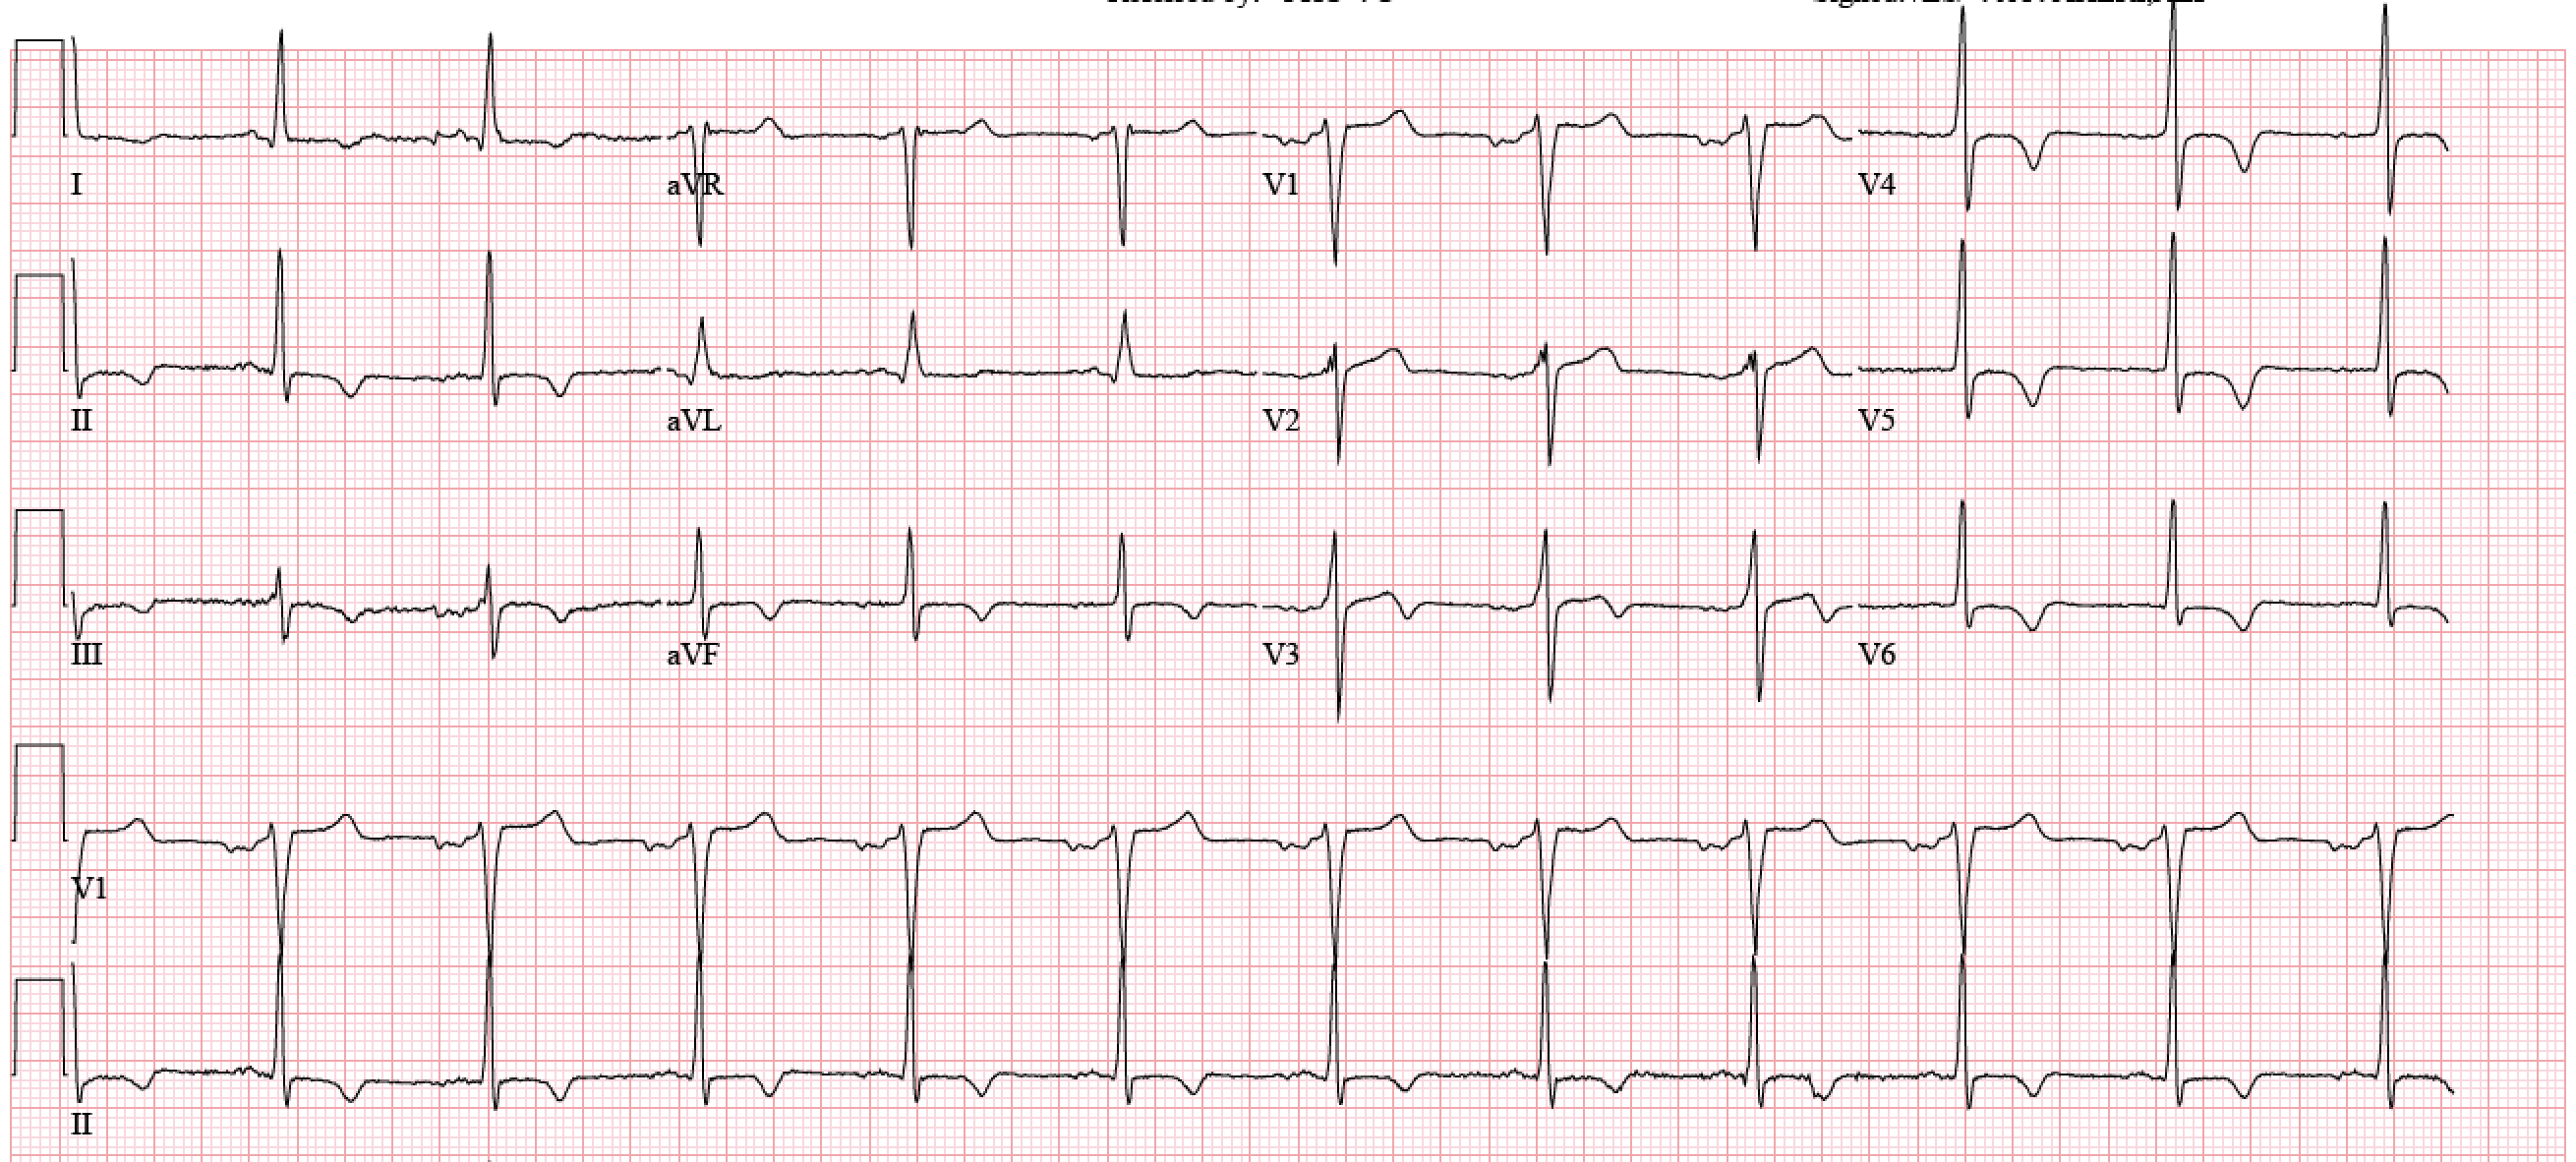
ECG 1
What do you think?
With the history of exertional shoulder pain, I thought this was highly suspicious for inferolateral reperfusion.
I sent this to Dr. Smith, and he said "It looks reperfused."
The Queen of Hearts diagnoses reperfusion:
Specifically, we see biphasic T waves in II, III, aVF, and to some extent in V5-V6.
New PMcardio for Individuals App 3.0 now includes the latest Queen of Hearts model and AI explainability (blue heatmaps)! Download now for iOS or Android.
The patient was set up for an outpatient stress test.
Smith comment: No patient with symptoms of ACS should go without troponin testing. If a patient arrives at a clinic that does not have that capability, he/she should be sent to an Emergency Department.
When the patient arrived for stress testing a few weeks later, he was asymptomatic. He said that since the stress test was ordered, he had begun having symptoms more frequently, and not always related to exertion. His resting ECG on the day of the test is shown below.
ECG 2
Compared to the clinic ECG, this ECG shows progression of reperfusion findings. Without more information from the interceding period, we do not know if there have been more episodes of occlusion and reperfusion. Here is a side by side comparison highlighting dynamic change:
Smith: this is not necessarily "persistent reperfusion". More likely, he has had several episodes of near occlusion (during which time he had symptoms) and it is "reperfused AGAIN."
Figure 1: Side by side comparison
In particular, we see:
- The inferolateral T waves are now inverted, or more deeply inverted
- The high lateral leads show reciprocal "overly upright" T waves
- V2 and V3 (which may have been showing posterior reperfusion before) now definitely have overly upright T waves consistent with posterior reperfusion
In a world where OMI ECG findings are understood, there would be no need to perform this test. The history and ECGs are already diagnostic at this point. But in the world of STEMI, these ECGs are considered non-specific, so the patient instead submits to stress testing with the risk that entails.
What follows are 24 consecutive ECGs during treadmill exercise. At the top of each ECG is information about the test explained in the figure below:
Figure 2: Exercise test legend
Here are the ECGs in order.
At this point, the patient stopped the test due to chest discomfort. Obvious inferior OMI. The following ECGs show recovery.
At the conclusion of recovery, we see return of reperfusion morphology. The chest discomfort resolved completely. The patient was loaded with aspirin and clopidogrel and underwent coronary angiography.
Video 1: RCA prior to intervention
He received overlapping stents covering the entire length of the RCA into the PDA.
Video 2: RCA after intervention
Troponin I obtained 90 minutes post peak stress was 0.012 ng/mL (ref. <0.033). Repeat the next morning was 0.020 ng/mL, higher but still within the reference range. It is possible that troponin may have briefly risen above the reference range in between these measurements (if it had been checked). One final ECG obtained the day after PCI is shown below. It shows persistent reperfusion.
ECG 3: One day after intervention
Discussion
To begin, kudos to the primary care physician for sniffing out this high risk patient. In a 90 year old patient, symptoms can be very muted. This is not just true with cardiovascular disease, but with everything. You must maintain a much higher index of suspicion in elderly patients. In this case, exertional shoulder pain is very worrisome, especially with radiation into the arm. She recognized that and acted accordingly.
Second, what a beautiful example of dynamic ECG change. I've included representative waveforms from the inferior leads before stress, at peak stress, and after recovery (post).
Figure 3: Serial comparison
We see the expected evolution of ST-T changes. But notice also that the voltage is attenuated at peak stress and recovers post stress. Ischemia routinely attenuates voltage, which is yet another reason why arbitrary millimeter rules are preposterous.
Finally, what do we call this and what is the best treatment? There are three related but distinct questions worth asking ourselves.
1. Was this a myocardial infarction?
Since the patient's troponin never rose above the reference range, it is not a myocardial infarction by definition. But as Dr. Smith said to me, "Sometimes you get a rise and fall beneath the 99% URL. There’s nothing magic about the 99% URL. It is just a definition." This patient apparently had a rise (from 0.012 ng/mL to 0.020 ng/mL) which I suspect is more than just lab error.
2. Was there plaque rupture?
There is no clear angiographic evidence of plaque rupture at time of angiogram. (However, as Dr. Smith points out it probably did occur at some point in the recent past.) We often say the way to know for sure is with intravascular imaging (such as intravascular ultrasound [IVUS] or optical coherence tomography [OCT]). But even that is not always definitive for several reasons. For example, this patient had heavily calcified disease, and the IVUS catheter would not pass into the distal vessel before at least some preliminary balloon angioplasty. The interventionalist did make appropriate use of IVUS, but even after ballooning he was not able to pass the IVUS into the distal vessel. So, even if he saw a plaque rupture (which he did not report), you would not know for sure if that was pre-existing or if it occurred after initial ballooning. Thus, this is a question with an unknown answer. However, based on the subacute presentation, my opinion is that it is unlikely.
Smith: I think plaque rupture is by far most likely. The patient had symptoms at rest. This is likely due to intermittent brief occlusion or downstream showering of platelet-fibrin aggregates from a disrupted plaque. With troponins below the 99th percentile, this is then "Unstable Angina." But I also think that, if troponins had been measured at the clinic visit, then they would have been elevated and the diagnosis would have been "Reperfused OMI" (or also possibly "NOMI.")
3. Is this stable angina?
Unstable angina is often thought of as biomarker negative acute coronary syndrome. So if we think plaque rupture is unlikely, then ostensibly this must be stable angina which should be managed medically which is the lesson we learned from ISCHEMIA, right?
I would argue that this is a more clinically determined unstable angina. I do not think there was plaque rupture, at least on the day of the stress test. But I think a 90 year old who develops transmural inferior ischemia walking 1.6 mph at a 12% grade is clinically unstable. In fact, the patient reported that his symptoms were coming on more frequently, including at rest. To me, this must be considered unstable angina, and he is very likely to benefit from intervention. Fortunately, he did well and was discharged home the following day.
In summary,
I had many interesting discussions with Dr. Smith and others about what exactly to call this. Some of this hair splitting is probably beyond the point. What matters is that the patient had unstable ischemic symptoms and ECG evidence of occlusion. In an ideal world, he would have come in for an angiogram weeks prior based on symptoms and ECG. But he was lucky and did not apparently sustain a large infarct prior to PCI. If the primary care physician had had access to QOH, the workup and treatment could have been expedited.
===================================
MY Comment, by KEN GRAUER, MD (6/4/2025):
===================================
As a family physician educator who performed and taught ETT (Exercise Treadmill Testing) locally and nationally to my specialty during the 30 years I served as full-time Family Medicine Faculty at our Residency Program — I felt a need to add a comment to the above insightful presentation by Dr. Frick.
- NOTE: My comment comes late. (This case was published on 5/26/2025). I am unable to tell from the description who performed the ETT (ie, Depending on the state, local practice and/or institution privileging — it could have been a primary care clinician or internist or cardiologist who did the ETT). Clinician credentials are not the point. The point is simply that there is much that must be learned from this case.
The Pre-ETT ECGs:
The above discussion is instructive between Drs. Frick and Smith regarding ECG #1 ( = the initial 12-lead ECG from the primary care clinic) — and ECG #2 ( = the repeat ECG, done a few weeks later, just before beginning the ETT).
For clarity — I repeat Dr. Frick's Figure-1, in which he provides side-by-side comparison between ECG #1 and ECG #2.
- Drs. Frick and Smith make the essential point that given the history in this 90-year old man with radiating left shoulder pain over some period of time — that ECG #1 strongly suggests that the patient has had a recent OMI, and his clinic ECG is now clearly showing ST-T wave changes of reperfusion.
- From a primary care perspective — this patient should have been admitted to the hospital based on the above history and the abnormal ST-T wave changes in ECG #1, as described by Dr. Frick. Although subtle — in a patient with symtoms — the T wave inversion in leads III,aVF; V5,V6 should not be missed.
- As per Dr. Frick — symptoms of acute MI often are difficult to assess in elderly patients. That said — this patient remains symptomatic (with left shoulder pain radiating down the arm that is often produced by activity). Depending on when his MI occurred — Troponin may or may not still be elevated. In an older patient with an abnormal ECG who continues "often" with anginal-equivalent symptoms on exercise — This patient should be directly admitted to the hospital until adequate evaluation can determine if he is stable (Ideally, given the history — this patient should have been admitted to the hospital from the primary care clinic — cardiology should be immediately consulted — and cardiac cath should be performed no later than the next day to define the anatomy and perform PCI if/as indicated).
- In any event — an ETT is not the appropriate test to order. This is because the baseline ECG ( = ECG #1) is clearly abnormal. When ST-T waves are abnormally flat, or there is baseline T wave inversion — sensitivity of an ETT is significantly reduced, because it will be so much harder to interpret superimposed ischemia. This is especially true in a 90-year old in whom the level of exercise achieved is likely to be low (making it that much more difficult to see additional ischemic change on top of an abnormal baseline tracing).
Luckily, despite more frequent occurrence of his symptoms — this patient survived for several weeks until it was finally time for his ETT.
- As per Dr. Frick's Figure-1 in which he compares ECG #1 with ECG #2 — there has been an increase in the ST-T wave abnormalities. Regardless of whether these ST-T wave changes reflect progression of reperfusion changes or recurrent episodes of coronary occlusion — NO ETT should have been done given the increase in ST-T wave abnormalities that are now seen in ECG #2!
- Instead, given the history that this patient "has begun having symptoms more frequently" since ECG #1 was done — and, given that ECG #2 now shows an increase in ST-T wave abnormalities — the ETT should have been cancelled — and the patient taken to cardiac cath for definitive diagnosis and treatment.
 |
| Figure-1 by Dr. Frick: Side-by-side comparison of ECG #1 and ECG #2 in today's case. |
Lessons to Learn from the ETT that was Done:
The above said — an ETT was done. While I fully acknowledge that I reviewed this case in the comfort of my home office in front of my large computer screen — there are lessons that must be learned from this ETT that was done.
For clarity in Figure-4 — I have excerpted leads III and aVF in 6 of the tracings that Dr. Frick showed above (taken between 2:50 minutes in Stage 2 — and 7:23 minutes when the ETT was stopped).
- Things move fast during an ETT. As a result — it is essential to know what your end point of the ETT will be before you begin the test. This is especially true in today's case given this patient's advanced age (90 years) — his history of worsening anginal-equivalent symptoms — and his abnormal ECGs (with an increase in ST-T wave abnormalities in ECG #2 compared to ECG #1).
- The only reason for possibly doing an ETT on this patient — would be if you were not yet sure that cardiac cath is needed. That means — the moment you see anything on this ETT that suggests ischemic CP (Chest Pain) with exercise — you should STOP the test. This is because it will be dangerous to continue exercise beyond this point (since you do not want to precipitate an MI).
There is more to assess on an ETT than simply the ECG recordings. We need to pay attention to:
i) Target Heart Rate;
ii) Blood Pressure response during exercise;
iii) Patient Symptoms during the test;
and,
iv) How the Patient "Looks" during the test.
- The patient's resting heart rate (as seen on ECG #2 — done just before the test) — is just under 60/minute. As a rough estimate — maximal predicted heart rate = 220 — Age ( = 220 — 90 = 130/minute). Assuming no other reason for stopping an ETT — the goal is to obtain ≥85% max. predicted HR — which for this 90-year old man would be 111/minute.
- To Emphasize — The ETT does not need to continue until ≥85% of max. predicted HR is achieved IF other parameters suggest stopping the test before this point.
- This patient's BP = 177/76 at 2:50 minutes in Stage 2. I see no further indication of his BP until 0:14 minutes in recovery. It's important to appreciate that if ever BP drops during an ETT for assessment of ischemia — that the ETT must be immediately stopped at that point, because this suggests acute cardiac failure. (The fact that the BP in Recovery remained high suggests that this patient's BP did not drop during exercise — but BP should have been frequently checked during the ETT of a patient like this one).
- If an ETT was to be done on a patient such as this one — it's essential to watch the patient intensely throughout the entire test — ready to stop at any point: i) If there are potential ischemic ST-T wave changes; ii) If this patient gets CP during the test; and/or, iii) If despite denying CP — the patient looks like they are becoming symptomatic during exercise. But there is no notation on any of these ETT tracings as how the patient looks, nor whether or not the patient had any CP during the test. Did this patient's CP only suddenly begin at 7:23, when the test was stopped?
ST-T Wave Changes that were Missed During ETT:
I draw attention to the following:
- There is a tremendous amount of artifact on each of these ECG tracings obtained during exercise. Sometimes this amount of artifact is unavoidable — but we must appreciate how much more difficult it becomes to interpret these ETT tracings when there is so much artifact. Our threshold for stopping the ETT needs to be lowered when there is this much artifact — or we risk missing the evolution of an acute MI under our eyes.
- Despite the artifact present in the 2:50 minute tracing — I thought the ST-T waves were essentially isoelectric.
- Compared to this 2:50 minute tracing — Isn't there at least a hint of beginning ST elevation in leads III and aVF at 3:50 minutes?
- At 4:50 minutes — Isn't the suggestion of ST elevation in III and aVF becoming more clear?
- At 5:50 minutes — Is there still doubt about ST elevation increasing in these leads?
- At 6:50 minutes — Don't we see even more ST elevation?
- P.S. — There is no need to wait precisely for the next minute IF you see suspicious ST-T wave abnormalities beginning to develop. Best to get more frequent tracings ...
- P.P.S. — It is not at all common to see ST elevation on an ETT. When you do — this suggests a localized wall motion abnormality (If you truly see ST elevation during an ETT of a patient with suspected ischemia — STOP the ETT! ).
Editorial Comments:
As we were not there during the ETT — it's impossible to know exactly what transpired. But we need to learn from this case.
- An ETT should not have been done.
- If an ETT was done — the threshold for stopping the test should have been greatly lowered — with attention to stopping the test the moment the test became positive.
- It is dangerous to continue exercise in a patient like this one if artifact is preventing you from appreciating increasingly abnormal ST-T wave changes.
- Realize that diagnostic ECG changes often occur in recovery — especially when the patient has exercised to ≥85% max. predicted HR (ie, Why push a high-risk 90-year old man beyond this level?).
-USE.png) |
| Figure-4: Leads III and aVF at 6 points during the ETT (from 2:50 minutes in Stage 2 — until the test was stopped at 7:23 minutes). |


-USE.png)