
Case 1
A middle aged woman presented with acute chest pain and shortness of breath, unclear time since onset, and likely with episodic symptoms off and on throughout the day. Her vitals were within normal limits.
ED1 @1512
 |
| What do you think? |
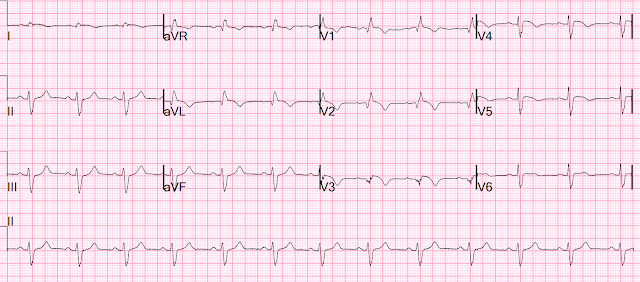
Meyers: Very clear and specific for acute LAD OMI, with hyperacute T waves in the LAD distribution including leads V2-V6, II, III and aVF. Only very slight STE which does not meet STEMI criteria at this time. I am immediately worried that this OMI will not be understood, for many reasons including lack of sufficient STE for STEMI criteria, as well as the common misunderstanding of "no reciprocal findings" which is very common with this particular pattern. This ECG is pathognomonic, regardless of any information, prior ECG, etc available: it means the LAD territory is undergoing immediate and hyperacute full thickness infarction, with the most likely etiology being type 1 ACS.
Prior ECG available on file from 2 months before:
 |
| We do not know the clinical events happening during this ECG, but there is borderline tachycardia, PVCs, and likely some evidence of subendocardial ischemia with small STDs maximal in V5-6/II, slight reciprocal STE in aVR. Probably not the patient's "baseline" ECG, but it was the prior on file. Notice the normal precordial T waves. |
That first ECG (the one at the top) was interpreted as "no evidence of ischemia."
A single high sensitivity troponin I was measured from triage (around 1500), which now returned elevated at 2,271 ng/L (upper limit of normal 12 for women, 20 for men).
(Amazingly, no further troponins were ever measured for this case)
ED2 @1559
 |
| Continued evolution of LAD OMI, with increasing STE and now likely meeting STEMI criteria to those who actually measure it. |
With the elevated troponin and repeat ECG showing new STE, the patient was discussed with local PCI center, and the cath lab was activated. The patient was transferred.
Angiogram @ 1830 (3.3 hours after that first diagnostic ECG):
Mid-LAD culprit lesion, 99% stenosis, no pre-intervention TIMI flow available, but described as "severe subtotal lesion", which was stented with reported TIMI 3 flow resulting. Another lesion in the proximal LAD with 80% stenosis was stented as well. Other vessels had scattered 30-40% stenoses.
Post-cath ECG @1921
 |
| Significant evolution of MI including worsening precordial Q waves, notable absence of deflation of the T waves. This is very concerning after reportedly "successful PCI" (successful in restoring flow in the epicardial coronary artery, but not necessarily to the downstream cells). Concerning for ongoing injury, concerning for the "No Reflow" phenomenon. |
No peak troponin was measured. We do not know if the patient's symptoms resolved.
Next morning:
 |
| Slight evidence of reperfusion (or just completion) with terminal T wave inversion in many leads. QS waves from V2-V5 consistent with LV aneurysm morphology. |
EF 50%, akinesis of mid-apical anteroseptal, inferior, and inferoseptal myocardium. Normal RV, no valve stenosis or regurgitation.


The patient survived and was able to be discharged.
2 weeks later:
 |
| Some slight R wave recovery in V4-V5, but overall still LV aneurysm morphology, and lingering T wave inversions which could be consistent with reperfusion or completed OMI. |
Case 2.
Contrast the last case with this case, from a different institution, which operates by the OMI/NOMI paradigm:
70-something male presents through triage with 9 hours of chest pain.
Here is the triage ECG:

Sinus rhythm with Left Anterior Fascicular Block.
There is subtle STE in V2 - V4, I and aVL, diagnostic of proximal LAD OMI. There is one hyperacute T-wave (in V3).
There is a QS-waves in V2: is this "Old MI with persistent STE (otherwise known as LV aneurysm morphology)"? The T-wave in V2 and V3 are too large for this: a T/QRS ratio >0.36 in one of leads V1-V4 is acute until proven otherwise.
T/QRS ratio in V2 is 2.5/6.5 = 0.38. In V3, it is even higher.
In this case, the MI is subacute, with symptoms of 9 hours duration. QS-waves are typical of anterior OMI of this duration, as are the relatively flat T-waves (not hyperacute). (When symptoms are present for more than 6 hours, the T/QRS ratio may be small due to subacute MI -- absence of hyperacute Ts).
It is difficult to say whether this ECG meets "STEMI criteria:" there is 2 mm of STE in V3. But V2 does not have 2 mm and V4 is very close to 1 mm. The computer did read "STEMI".
The cath lab was immediately activated.
Later, the initial hs troponin I returned very high.
Angiogram:
Primary PCI for Acute Antero-lateral STEMI.
Culprit is 100% stenosis in the Proximal LAD.
Culprit lesion was reduced to 0% and stented.
90% ostial LAD-D1 reduced to 35% with PTCA and stented.
Next day ECG:

There is now RBBB in addition to LAFB.
Some persistent STE in V2-V5 (with RBBB, there should be STD depression discordant to the positive R'-wave, so this is particularly worrisome)
Reperfusion T-waves in I, aVL, V2-V5,6
Echo
Normal left ventricular size and wall thickness with severely reduced systolic function.
The estimated left ventricular ejection fraction is 31%.
Akinesis in LAD territory:
- Basal to apical septum
- Mid to apical anterior wall
- Entire apex
The delay in patient presentation resulted in large irreversible infarction.
Learning Points:
Note that expert ECG interpretation diagnosed OMI at the time of arrival, STEMI criteria possibly at 45 minutes later, and the patient underwent cath at 3 hours after arrival, for a delay of approximately 3 hours since first medical contact. Better ECG interpretation would likely have led to more rapid reperfusion.
Understanding the entire OMI progression including hyperacute T waves is critical for diagnosing OMI.
The ECG is usually a better indicator of reperfusion than the angiogram.

==================================
My Comment by KEN GRAUER, MD (1/28/2023):
==================================
After reading about the course of case presented by Dr. Meyers — I have mixed emotions. I find it gratifying that so many of our readers have become highly competent interpreters, who are able to immediately recognize that the initial ECG in today's case is (as per Dr. Meyers) — "very clear and specific for acute LAD OMI".
- In this middle-aged woman who presented to the ED with new chest pain producing symptoms "on and off" throughout the day — the need for prompt cath lab activation with PCI is indisputable.
- That said, on seeing the initial ECG for the 1st time — I shared Dr. Meyers' concern that this acute OMI might not be "understood" for the same reasons he expressed (ie, lack of millimeter criteria to be called a "STEMI" — and a "lack" of reciprocal changes).
- On reading what happened — I have to admit my frustration at learning that despite the incriminating history and diagnostic initial ECG in today's case — PCI was delayed for over 3 hours.
I focus my comment on the case presented by Dr. Meyers — specifically regarding interpretation of the first 2 tracings in his case, which I consider at 2 LEVELS: i) The BASICS (ie, Why even less experienced interpreters should not misinterpret the diagnostic initial ECG); and, ii) PEARLS for the more advanced readers of Dr. Smith's ECG Blog (in which I'll point out some interesting subtleties in these first 2 tracings).
- For clarity in Figure-1 — I've reproduced and labeled these first 2 tracings in today's case.
-USE%20copy.png) |
| Figure-1: I've reproduced and labeled the first 2 tracings in today's case. |
My Initial Thoughts on Reading Today's CASE:
The aphorism, "Listen to the patient — he/she is telling you the diagnosis" — has been attributed to Dr. William Osler, the "Father" of Medicine. Ignoring this truism was the 1st oversight in today's case.
- Awareness that not only did the patient in today's case present to the ED with new chest pain — but that she indicated having this symptom "on and off" throughout the day. Knowing this history explains many of the ECG findings that were overlooked in the initial tracing.
The initial ECG shows sinus rhythm with a PAC ( = the early beat in leads V1,2,3). All intervals (PR, QRS, QTc) are normal. There is no chamber enlargement (On the contrary — overall QRS amplitude is decreased).
- The frontal plane axis in ECG #1 (Top tracing in Figure-1) — is markedly leftward, with a predominantly negative QRS in lead II. This suggests an axis of at least -45 degrees, and is consistent with LAHB (Left Anterior HemiBlock).
- PEARL #1: It's often difficult to appreciate inferior infarction in association with LAHB (and vice versa). This is because the initial component of ventricular depolarization is oppositely directly with LAHB vs inferior infaction. The fact that there is a small-but-real initial q wave in lead II in this patient with LAHB (BLUE arrow in lead II) — consistent with a qrS complex in lead II, suggests inferior infarction has occurred at some point in time, in addition to the LAHB.
- In support of this premise that inferior MI has occurred at some point in time are: i) The QS in lead III (without any initial positive deflection at all); and, ii) The fragmentation we see in the tiny QS complex in lead aVF (this variable fragmention in lead III most probably produced by the beat-to-beat opposing orientation between the initial vectors from the LAHB and inferior MI).
Continuing my interpretation of ECG #1 — by assessing Q-R-S-T Changes:
- There are QS complexes in leads V1,V2,V3.
- We again see small initial q waves in leads V4,V5,V6.
- As a result of these QS complexes and the overall reduced voltage — there is poor R wave progression (with delayed transition, in that the R wave does not ever become taller than the S wave).
- PEARL #2: Although small and narrow septal q waves may normally be seen in lateral chest leads — this is not what we see in ECG #1. Instead — the fact that following QS complexes in the first 3 chest leads — the initial negative deflection ( = q wave) that occurs before the tiny r in lead V4 is indicative of the extensive anterior infarction that has occurred at some point in time.
- In support of this premise of extensive anterior MI — is continuation of the tiny R wave amplitude through to lead V6, with persistence of tiny q waves in V5,V6 (BLUE arrows in leads V4,5,6 in ECG #1).
- PEARL #3: As we've pointed out on a number of occasions (ie, See My Comment at the bottom of the page in the November 12, 2020 post in Dr. Smith's ECG Blog) — the finding of low voltage in a patient with ongoing acute MI may be indication of cardiac "stunning" from extensive infarction.
The MOST Abnormal Lead in ECG #1:
The reason for my frustration in reading what happened in today's case — is a result of providers not realizing the abnormality in lead V4.
- PEARL #4: Changes of acute OMI may often be subtle in many leads. As a result — I find it most helpful to look for those 1 or 2 leads that you know are definitely abnormal. Once these definitely abnormal leads are identified — it becomes far easier to assess neighboring and reciprocal leads for changes that may not be as obvious. In ECG #1 — regardless of the experience of the interpreting clinician — there should be no doubt that in a patient who presents to the ED with new chest pain — that the ST-T wave lead V4 is disproportionately tall. Indication that this T wave in V4 is hyperacute is forthcoming from ST segment straightening of its upslope and its hypervoluminous T wave (clearly taller-than-it-should-be with a much wider base than should be present given tiny amplitude of the QRS).
- I've added parallel RED lines in a number of other leads in ECG #1 — to highlight ST segment straight (and coving in lead V2) — that all provide support of the ongoing acute LAD occlusion.
WHY So Many Q Waves IF the MI is Acute?
The answer to this important question is forthcoming IF we remember Sir William Osler's famous quote: "Listen to the patient — he/she is telling you the diagnosis".
- Today's patient was having chest pain "on and off" throughout the day. As a result — there was more than ample time for infarction Q waves to develop — with resultant loss of QRS amplitude — and possibly some return-to-baseline of previously elevated ST-T waves.
Comparison with the Prior ECG:
As per Dr. Meyers — there is a significant difference between the 2 tracings in Figure-1. To emphasize — We do not know the circumstances under which the prior tracing was obtained — and this prior ECG #2 does show sinus tachycardia, PVCs and nonspecific ST segment flattening with slight depression in many leads.
- The above said — My frustration in this case is that IF any provider (at any level of clinical experience) made a lead-by-lead comparison between the initial tracing in today's case — and the prior tracing — it should be impossible not to notice the change in ST-T wave morphology.
- PEARL #5: The EASY way to get good at comparing serial tracings — is to go lead-by-lead. Doing so (as I illustrate in Figure-1) — should reveal more left axis deviation in ECG #1 (new development of LAHB) — lack of inferior and lateral chest lead Q waves and small-but present initial R waves in leads V2,V3 (GREEN arrows in ECG #2). Most notable should be the change in ST-T wave morphology between the 2 tracings (shape of the RED lines I've drawn in ECGs #1 and #2 in Figure-1).
BOTTOM Line: The acute OMI in today's case should not have been missed, given the history and the appearance of the first 2 ECGs.
- There are simple things even less experienced providers can do to improve their ECG interpretation ability — so that oversights as described in today's case do not occur.
No comments:
Post a Comment
DEAR READER: I have loved receiving your comments, but I am no longer able to moderate them. Since the vast majority are SPAM, I need to moderate them all. Therefore, comments will rarely be published any more. So Sorry.