A 66 y.o. male who presented for chest pain that started this AM when he woke up, and has persisted throughout the day prompting him to call 911. He says the pain is dull in nature and located across the chest, does not radiate, that it is worse with exhalation. He denies worsening with activity or positioning. He endorses SOB and requested to sit up. He says this has not happened to him before. He endorses cough productive of yellow sputum. He denies any edema. Denies history of venous thromboembolism. He endorses a 50 pack year history of smoking. He denies recent illness or recent sick contacts. He denies fevers, sweats, chills, headache, dizziness, lightheadedness.
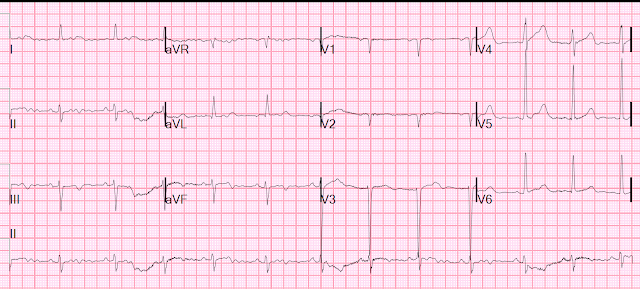
Here is his ED ECG:
I saw this patient and on my history, his pain had been present and constant for 12-36 hours.
We did an ED bedside cardiac ultrasound, which was normal.
After a single troponin returned "negative" at 8 ng/L (URL = 34 ng/L; Limit of Detection = 4 ng/L), I believed we had ruled out MI.
Here is the Assessment
- CBC, Chem, and dimer were all unremarkable
- EKG was non ischemic
- Cardiac US was within normal limits
- CXR showing posterior costophrenic angle interstitial opacities with atelectasis or infiltrates. No distinct osseous abnormality.
- Given albuterol nebulization, with improvement.
The first troponin returned at 4000 ng/L, consistent with subacute OMI.
I was distraught.
Angiogram:
Normal
Diagnosis: Takotsubo, probably due to pneumonia.
So it was not acute coronary syndrome at all. I had not sent ACS home. Phew!
Formal echo day 3:
Mildly enlarged left ventricle with severely reduced systolic function. Estimated ejection fraction 21%.
Severe hypokinesis to akinesis of the mid and apical left ventricle in all segments with best preserved function in the basal inferolateral wall.
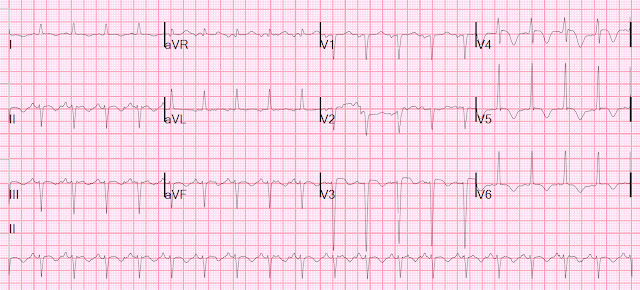
Day 4 ECG:
Day 6
Echo recovery with EF 45%
Learning Points:
1. Takotsubo mimics LAD Occlusion
2. Otherwise, I'm not certain! Except to say that this case is not a counterexample for sending a patient home who has had pre-arrival chest pain for 12 hours and a single troponin that is measurable but below the URL.
- For clarity in Figure-1 — I've reproduced the first 2 tracings in today's case.
- There is a large amount of artifact, especially in the limb leads.
- The rhythm in ECG #1 is sinus. The axis is leftward, consistent with LAHB (Left Anterior HemiBlock).
- QRS amplitude in a number of chest leads is significantly increased — consistent with voltage for LVH (based on the very deep S in V3 >25 mm — and the tall R in V5).
- Although difficult to assess because of limb lead artifact — T waves appear to be negative in all 3 inferior leads (RED outlining in these leads). Whether this is in response to predominant negativity of the QRS in these leads — or whether it reflects some element of ischemia is uncertain from this artifact-marred picture.
- A QS complex is seen in leads V1 and V2 — and no more than a tiny r wave is seen in lead V3. Whether this poor R wave progression is the result of LAHB (which results in unopposed posterior forces initially) — or — the result of LVH (which may produce prominent posterior forces with loss of anterior r wave amplitude) — or — anterior infarction at some point in time — is uncertain from this single tracing.
- I found it a bit unusual for the ST-T waves in leads V1,V2,V3 to be nearly flat — especially in view of probable LVH that typically produces a definitely upright (if not slightly elevated) ST-T wave in anterior leads as a manifestation of LV "strain" when there are deep anterior S waves. Could this be pseudo-normalization?
- To EMPHASIZE: This initial ECG #1 is not suggestive of acute OMI. But in a 66-year old man with risk factors and a concerning history — I thought the above ECG findings opened some questions. In view of the importance of this tracing in the decision-making process — and in view of all the limb lead artifact — I would have repeated the tracing.
- Why might the frontal plane axis in ECG #2 be so different than it was the day before in ECG #1?
-USE.png) |
| Figure-1: The first 2 tracings in today's case. |
- The “tipoff” to LA-LL Reversal in ECG #2 — is that the P wave in lead I is clearly larger than the P wave in lead II (and that is distinctly unusual when there is sinus rhythm).
- The other "tipoff" that something is amiss — is the marked right axis in ECG #2, that of itself is unusual outside of the context of RVH. Lead-to-lead comparison of ECG #1 with ECG #2 shows a dramatic shift from a leftward axis — to a rightward axis over the course of 1 day. That rarely happens.
- P.S. — In the July 28, 2020 post in Dr. Smith’s ECG Blog — I cited my favorite on-line “Quick GO-TO” reference for the most common types of lead misplacement, which comes from LITFL ( = Life-In-The-Fast-Lane). Simply put in, “LITFL Lead Reversal” into the Search bar — and the link comes up instantly!
-USE.png) |
| Figure-2: Showing the effects of LA-LL Lead Reversal (See text). |
- There is no significant difference in heart rate or frontal plane axis between ECG #2a and ECG #3.
- There may be slight change in chest electrode lead placement (ie, the S wave in lead V2 is much deeper in ECG #2a compared to ECG #3). That said — this difference is unlikely to alter our overall assessment of these 2 tracings.
- The overall "shape" of ST-T waves is similar in most leads — with the main difference being some improvement in ECG #3, which was done 2 days after ECG #2a.
- For review of the ECG findings seen with Takotsubo Cardiomyopathy — Please check out My Comment at the bottom of the page in the March 25, 2020 post in Dr. Smiths Blog.
-USE.png) |
| Figure-3: Comparison of the 2nd and 3rd tracings in today's case (accounting for what ECG #2 would look like if leads were correctly placed). |


No comments:
Post a Comment
DEAR READER: I have loved receiving your comments, but I am no longer able to moderate them. Since the vast majority are SPAM, I need to moderate them all. Therefore, comments will rarely be published any more. So Sorry.