Don't miss Ken Grauer's comments at the bottom!
An elderly woman is found down in her bedroom. On arrival, she was alert, slightly tachycardic, and her BP is 225/115. She has no CP or SOB or Abdominal Pain. She had no past history relevant to her ECG. Other than the BP, her exam was unremarkable.
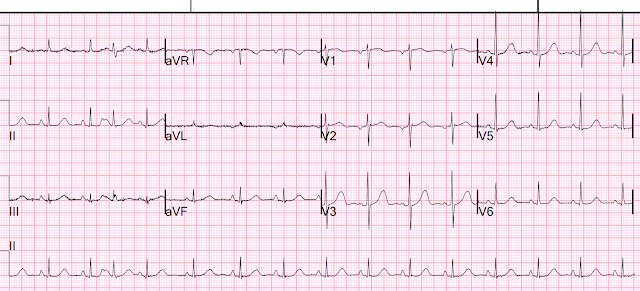
She had an ECG recorded:
There is apparent VERY DEEP ST depression. HOWEVER, it is really not nearly as deep as it appears. Notice the PR segment. There is very deep PR depression. In fact, there is a deep atrial repolarization wave which will result in an ST segment that is depressed relative to the TP segment, but not so depressed relative to the PQ junction (QRS onset).
II, III, aVF have very deep atrial repol waves without additional ischemic STD. Lead aVR has ST Elevation due to the atrial repolarization wave (the P-wave is negative, the repolarization wave is positive).
There is ADDITIONAL ischemic ST depression in V2-V5. As we have often stated, STD maximal in V1-V4 is specific for posterior OMI UNLESS there is reason to suspect demand ischemia. In this case there is tachycardia and severe hypertension, which is the likely etiology of the ischemia.
Atrial Repolarization Wave (Ta-wave): See this case and this drawing and schematic:
Sudden CP and SOB with Inferior ST Elevation and in STE in V1. Is it inferior and RV OMI?
Case Continued
The ischemic component of the ST depression was managed with supportive care of tachycardia and hypertension, at which point another ECG was recorded:
The peak hs troponin I was 80 ng/L, due to type 2 MI
Echo
Normal left ventricular size and wall thickness with hyperdynamic systolic function.
The estimated left ventricular ejection fraction is >75%.
No regional wall motion abnormality.
Normal right ventricular size and systolic function.
Mild mitral insufficiency.
No significant valvular stenosis.
Based on IVC geometry, the estimated right atrial pressure is low.
Several days later
There is no atrial repolarization wave now.
I do not know why this phenomenon happens and why it resolved.
More cases like this:
Low atrial rhythm, with atrial repol wave, mimics ST Elevation in lead V1: Sudden CP and SOB with Inferior ST Elevation and in STE in V1. Is it inferior and RV OMI?
ST Elevation of Pericarditis is Hidden by Atrial Repolarization Wave: Teenager with chest pain and slightly elevated troponin. What happens then?
This is a great one: Look at this ST Depression
Nice summary (below) of literature from this article:
Manne JRR. Atrial Repolarization Waves (Ta) Mimicking Inferior Wall ST Segment Elevation Myocardial Infarction in a Patient with Ectopic Atrial Rhythm. Case Rep Med [Internet] 2018;2018:1015730. Available from: http://dx.doi.org/10.1155/2018/1015730. Full text: https://www.hindawi.com/journals/crim/2018/1015730/
Literature cited
1) F. Holmqvist, J. Carlson, and P. G. Platonov, “Detailed ECG analysis of atrial repolarization in humans,” Annals of Noninvasive Electrocardiology, vol. 14, no. 1, pp. 13–18, 2009. (full text) https://doi.org/10.1111/j.1542-474X.2008.00268.x
2) R. Childers, “Atrial repolarization: its impact on electrocardiography,” Journal of Electrocardiology, vol. 44, no. 6, pp. 635–640, 2011. https://doi.org/10.1016/j.jelectrocard.2011.07.031
Discussion from above article by Manne JRR.
Atrial repolarization wave (Ta wave) is usually not perceptible on the ECG as it has low magnitude of 100–200 microvolts and is usually concealed by the ensuing QRS complex [1]. Occasionally, they are seen as shallow negative deflections right after the P wave in conditions with prolonged PR interval, but they are best seen in patients with complete heart block, when the Ta waves and QRS complexes are uncoupled [2]. In contrast to the QRS complex and T wave which under normal conditions have the same polarity, the polarity of the P wave is always opposite to that of the Ta wave in all leads [2]. The duration of Ta wave (average duration of 323 ± 56 ms) is generally 2-3 times longer than the P wave (average duration of 124 ± 16 ms) [2].
===================================
MY Comment by KEN GRAUER, MD (12/9/2021):
===================================
We often ignore the Ta wave (Atrial Repolarization Wave) — because we usually don't notice it, even when it is there. That's because its location is typically hidden within the QRS complex. But as we've shown on a number of occasions in Dr. Smith's ECG Blog — an exaggerated Ta wave may make its presence known in the form of unexpected ST segment deviations that cause diagnostic challenges.
- The most notable example of this is the Emery Phenomenon — in which large negative P waves in the inferior leads with a short PR interval (typically from a low atrial or junctional rhythm) — may simulate the ST elevation of acute infarction (For illustration of this phenomenon — See My Comment in the June 3, 2020 post in Dr. Smith's ECG Blog).
- Today's case shows the opposite effect — in which overly large P waves result in an ECG picture that simulates ischemic ST depression.
My theory for why today’s patient developed such impressive negative Ta waves that simulated ischemic ST depression — and why these exaggerated Ta waves subsequently disappeared is the following:
- Not only is the normal Ta wave polarity opposite that of the P wave in all leads — but normal duration of the Ta wave is significantly longer than normal P wave duration (between 2-3 times P wave duration — Francis). This may account for some of the "exaggerated" effect on the ST segment when the P wave (and therefore the Ta wave) is large — especially if other factors may be contributing to an exaggerated response to atrial repolarization (perhaps in a similar way that drugs or electrolyte disturbance may exaggerate the response to ventricular repolarization in the form of QT prolongation).
- In my experience over years — Patients with acute heart failure sometimes manifest acute increase in P wave dimensions on ECG (simulating LAA or RAA) that are not related to baseline atrial size — and which mysteriously resolve within 24-48 hours after treatment of their acute event. I have always attributed this as a "pressure phenomenon" — which I theorized resulted from acute heart failure with increased end-diastolic pressure being transmitted back to the atria. I have never seen this phenomenon described in the literature — but I observed it on many occasions through interpretation of serial ECGs on these patients that I followed clinically.
- Acute diastolic dsyfunction could theoretically produce the same phenomenon. As a consequence of longstanding hypertension with resultant LVH — the thicker (stiffer) left ventricle manifests reduced diastolic filling — resulting in increased ventricular diastolic pressure — with transmission of this elevated pressure to other cardiac chambers. So perhaps it is “atrial stretch” that accounts for this increased P wave amplitude that I transiently observed on these patients until their acute clinical condition resolved (at which time P wave size on ECG would return to normal).
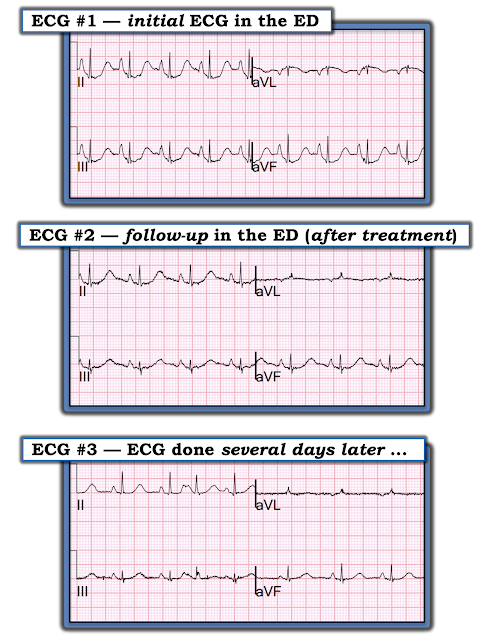
- Diastolic dysfunction is by far most common in older women with longstanding hypertension (which appears to be the profile of the elderly patient in today’s case). Today’s patient was found "down" in her bedroom. She was markedly hypertensive when found (225/115 mm Hg) — and her initial ECG showed very tall, peaked inferior lead P waves. Successive ECGs showed progressive resolution of this increase in P wave size — as her clinical condition improved (Figure-1).
My Theory: To emphasize — Many patients have large P waves without exhibiting an exaggerated Ta response that simulates ischemic ST depression. This is not a common phenomenon — or else we would see it more! But it may be that a subset of patients who are overly sensitive to exaggerated Ta wave effects may respond to acute “atrial stretch” from acute systolic and/or diastolic dysfunction (both often occur together!) — with abrupt increase in P wave size on ECG, accompanied by an exaggerated Ta wave response on ECG that simulates ischemic ST depression. And then, when the patient’s clinical condition improves (and BP returns to “pre-stress” levels) — the abnormal P waves and ST segments return to their baseline.
 |
Figure-1: Note progressive decrease in P wave size over the course of these 3 serial ECGs. Not only are inferior P waves less tall — but the peak of these T waves is less pointed. Note that size and shape of the negative P wave in lead aVL is similarly affected over the course of these serial ECGs.


No comments:
Post a Comment
DEAR READER: I have loved receiving your comments, but I am no longer able to moderate them. Since the vast majority are SPAM, I need to moderate them all. Therefore, comments will rarely be published any more. So Sorry.