Thursday, April 27, 2017

A 40-something woman with chest pain. A medic takes control of the situation.

A 40-something woman with Chest Pain of 20 minutes duration called 911.

It started while at rest and she describes it as crushing pain radiating to the left arm. She has a history of HTN for which she takes Lisinopril.  Denies any other medical history.

She appears well but in obvious pain.  She was diaphoretic but pink and warm. BP remained 150-160 systolic throughout care.  

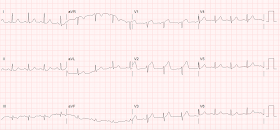
This prehospital ECG was obtained.
There are very suspicious ST elevation and T-waves in V2, but without 2 consecutive leads with STE of greater than or equal to 1.5 mm, it does not meet STEMI criteria. 


With a computerized QTc of 430, the formula value was 24.94.  Since this is greater than 23.4, the ECG represents LAD occlusion with a high degree of certainty.


Because of this, they bypassed the nearest hospital and transported the patient to the nearest STEMI receiving facility, which has PCI capabilities.

On the way, they recorded 3 more ECGs:

Time 5 minutes
No major change

This one was transmitted to the receiving facility, with request to activate the cath lab.
The receiving physician would not activate, did not agree.


When the emergency physician would not activate, the medic took things into his own hands and contacted the cardiologist himself.  As soon as the cardiologist saw the ECG, he activated the cath lab. 

2 more ECGs were recorded en route:


Time 30 minutes
Still no major change


Time 33 minutes
Still no major change


The patient bypassed the ED and went directly to angiogram:
There is a cutoff of the LAD (100% occlusion)
The location is, to my eye, immediately after the takeoff of the first diagonal.
(This is my interpretation of the angiogram and angiography is not my expertise -- I might have the exact location wrong)


After stenting, there is good flow in the LAD


Learning Point

Subtle LAD coronary occlusion can be diagnosed by medics, especially with use of the formula.  It may greatly aid in triaging patients to the appropriate hospital and aid in improving door to balloon time.

Wednesday, April 26, 2017

A 60-something with Syncope, LVH, and convex ST Elevation

Note 2 other similar cases at the bottom that come from my book, The ECG in Acute MI.

Case

While I was busy seeing patients, a resident brought me this ECG of a 60-something with a history of syncope only.  There was no chest pain or SOB at the tim of the ECG:

Computerized QTc is 464 ms
A previous ECG from 8 years prior was normal.
What do you think?


There is sinus rhythm at a rate of nearly 100 (nearly tachycardic)
There is 2.5 mm STE in lead V1 and 3 mm in lead V2, with convexity, and 1.5 mm in V3.
This meets "STEMI criteria"
However, there is very high voltage, with a very deep S-wave in V2 and tall R-wave in V4.
This is massive LVH and the ST elevation is not atypical for LVH with superimposed stress.
The morphology is not right for STEMI.

My interpretation: LVH with secondary ST-T abnormalities, exaggerated by stress, not a STEMI.


Is there a formula to help with this? Maybe.  See discussion at the bottom.

I did not have more information at the time.  To the ED providers, the patient denied CP, SOB, or drug use.

My opinion was that it was not a cath lab case, but I did suggest they do a bedside ultrasound to look for an anterior wall motion abnormality.

Absence of chest pain or SOB at the time of the ECG is important; had the patient had active chest pain, I would have recommended at least an emergency formal echo, if not cath lab activation.


This is the ED bedside echo, recorded during ST elevation:

Parasternal short axis shows huge concentric LVH.  The anterior wall is contracting normally.  This is very good evidence that the ST elevation is not due to STEMI.

Notice also the very small LV cavity size at both diastole and systole (poor LV filling with good contractility) and apparent low stroke volume.

So there is poor LV filling.  This can be due to one or both of very poor compliance (which is no doubt present here, due to LVH) and to low LV filling pressures.  When there is poor compliance, as with massive LVH, the heart is particularly vulnerable to low LV filling pressures.

Low LV filling pressures are due to several etiologies, most commonly due to volume depletion (dehydration or hemorrhage), but also due to other etiologies including, but not limited to: mitral stenosis, pulmonary hypertension (chronic, or due to pulmonary embolism), or poor RV performance.

A view of the inferior vena cava showed it to be completely collapsed, confirming volume depletion.

This is just the sort of stress that can lead to ST elevation when there is this degree of LVH.


Here is the long axis view:


Massive LVH with good septal wall motion, and poor LV filling.

The RV was small and IVC empty, making pulmonary embolism extremely unlikely.  (Acute PE can also result in right precordial ST elevation due to RV stress and ischemia)


90 minutes later, I was shown this followup ECG without any knowledge of the ultrasound results:

There is significantly less ST elevation, and the ST segment is now concave.
Does this make you think that the previous ECG did indeed represent LAD occlusion, and the followup represents reperfusion?


No.

I had not seen the cardiac ultrasounds at this time.

This repeat ECG did not convince me.  When a heart with LVH is under stress, the ST segments may rise and become convex.  When the stress is relieved, it resolves.  There was some stress associated with the syncope, whatever the cause of the syncope.

I remained unconvinced that this was due to ACS.

The history given was still that there was no chest pain and no other significant findings.

There was a positive initial troponin I at 0.115 ng/mL.

The patient was given aspirin and heparin and admitted to the hospital.


This ECG was recorded at 3 hours:
Consistent with LVH alone


This was recorded the next AM:


Further clinical data

Later physicians obtained history that  the patient had been on 3-day binge of cocaine, heroin, and marijuana.  He reportedly did complain of atypical chest pain and intermittently, including some measurements in the ED, had a very elevated blood pressure (up to 210/110) because he had not been taking his antihypertensives.

With the added history, and the entirety of the presentation, it was determined by cardiology that the clinical presentation was not due to ACS.

See similar cases below from my book, The ECG in Acute MI


New 4-Variable Formula

I have published a new formula for Early Repolarization vs. Subtle LAD Occlusion that solves the problem of false positives due to LVH by adding a 4th variable, QRS in V2.  The higher the QRS voltage in V2, the less the likelihood of LAD occlusion.  The article is published online (manuscript only at this point, corrected proofs available in a few days) in the Journal of ElectrocardiologyA New 4-Variable Formula to Differentiate Normal Variant ST Segment Elevation in V2-V4 (Early Repolarization) from Subtle Left Anterior Descending Coronary Occlusion - Adding QRS Amplitude of V2 Improves the Model.

The new formula is:  0.052*QTc-B - 0.151*QRSV2–0.268*RV4 + 1.062*STE60V3.   The cutpoint with the highest accuracy (92.0%) was at a cutoff value  of 18.2 (higher indicative of LAD occlusion).  

Definitions
QTc-B is the computerized Bazett-corrected QT interval
QRSV2 is the entire QRS in millimeters in lead V2
RV4 is the R-wave amplitude in millimeters in lead V4
STE60V3 is ST elevation, relative to the PQ junction, at 60 milliseconds after the J-point, in millimeters.

This formula was derived in populations of LAD occlusion and early repolarization. Does it apply to LVH also?  I'm not sure, but I suspect it is.  That is worth study.

Let's apply the formula to the first ECG aboveWith values for QTc of 464 ms, STE60V3 of 2 mm, QRSV2 of 44 mm, and RAV4 of 35 mm:
The value = 10.3.   This is very low. 

The sheer amplitude of the R-wave in V4 and the S-wave in V2 make LAD occlusion extremely unlikely.


Here are a couple cases from my book, The ECG in Acute MI:


Case 1, from chapter on Cocaine Associated Chest Pain (CACP)


Case 2, from chapter on LVH


Sunday, April 23, 2017

A 16 year old girl with altered mental status and possible overdose

A 16 year old girl presented with altered mental status, probably due to alcohol intoxication, but also with possible overdose.

As part of her workup, she had an ECG:
The computer interpreted this as Left Bundle Branch Block
The overreading physician confirmed this read.
2 subsequent identical ECGs were confirmed as left bundle branch block, by different physicians.
What do you think?


This ECG was texted to me in real time by the resident, asking what it was.
My immediate reply: WPW

Notice the very short PR interval and the profound delta waves.  This is clearly NOT left bundle branch block.

Case continued

The patient awoke from her intoxication without complications.  She and her mother denied ever having palpitations, tachycardia, chest pain, or shortness of breath.

Diagnosis:

Asymptomatic WPW.


Management:

The management of asymptomatic WPW is beyond the scope of this blog.  Suffice it to say that there is a very high incidence of serious events in untreated children with this ECG finding.

See this publication: 

The Natural History of Asymptomatic Ventricular Pre-Excitation: A Long-Term Prospective Follow-Up Study of 184 Asymptomatic Children.  Journal of the American College of Cardiology.  Volume 53, Issue 3, 20 January 2009, Pages 275–28.


Such cases should all be referred to cardiology, pediatric cardiology, or an electrophysiologist, avoid exercise until follow up, and call 911 for chest pain, SOB, or palpitations.


Computer interpretations:

The computer is often wrong, but leads to serious diagnostic momentum.  What would the overreading physicians have interpreted had the computer:

1) Given some other diagnosis?  
2) Given no diagnosis at all?  
3) Or if the physicians read the ECG first, then looked at the computer interpretation?

I don't know. How did you interpret it?  Correctly?  Or as LBBB?


I will be presenting an abstract at SAEM on the diagnosis of atrial dysrhythmias by computer and by overread, compared to a new neural network, machine-learning algorithm.  When the standard diagnostic algorithm falsely diagnosed atrial fibrillation, the physician corrected it only half the time.  By the way, the new algorithm performed far better.


Learning Point

1.  Blind yourself to the computer interpretation until you make your own.
2. Only then look at the computer interpretation.
3. Then look back at the ECG if the computer sees something (accurate or not) that you did not.


Friday, April 21, 2017

ST Elevation and QS-waves in a patient with Dyspnea

I was shown this ECG of a patient with dyspnea:
My interpretation: "Subacute STEMI"
In other words, STEMI of at least 6 hours duration, and more typically greater than 12 hours.


ECG differential may include: Old anterior MI with persistent ST Elevation (LV aneurysm morphology).

Which is it?

My rule for differentiating acute STEMI from LV aneurysm really only reliably distinguishes between:
1. acute STEMI on the one hand
2. subacute STEMI or LV aneurysm on the other.

What is the rule?

First, there must be ST Elevation.
Second, the ECG differential diagnosis much be LV aneurysm vs. acute STEMI.

This rule should not be used for early repol vs. acute STEMI.  Conversely, if the differential is LV aneurysm vs. acute STEMI, then you should NOT use the early repol formula.

When should LV aneurysm be on the ECG differential diagnosis?  Primarily when there are well-formed Q-waves, with at least one QS-wave, in V1-V4.  A QS-wave is defined by absence of any R-wave or r-wave of at least 1 mm.  (If there is an R-wave or r-wave, we call the whole wave a QR-wave, Qr-wave, or qR-wave, depending on the relative size of the Q-wave vs. R-wave.)

The rule: If there is one lead of V1-V4 in which the T/QRS ratio is greater than 0.36, then acute STEMI is the likely diagnosis, though subacute STEMI is also possible.  Since both require the cath lab, if the ratio is greater than 0.36, and the clinical situation is right (i.e., unexplained chest discomfort), then cath lab activation is indicated.  I both derived and validated this formula, for which the cutoff has good sensitivity and specificity:
Derivationhttp://www.sciencedirect.com/science/article/pii/S0735675705000811
(accuracy of formula = 93.2%)
Validationhttp://www.sciencedirect.com/science/article/pii/S0735675715001904
Validation full text
Sensitivity 91%, specificity 81%

False negatives had pain duration greater than 6 hours. Thus, it may classify those patients with prolonged chest pain as LV aneurysm when they are really subacute STEMI.

This case

If the formula were used here, then lead V4 would have a T/QRS ratio of 5/11.5 = 0.43.  Only one lead is needed, so the criterion is met for acute STEMI.

Really, however, LV aneurysm was never on my differential diagnosis when I glanced at this ECG.

Why?     It is true that there are QS-waves in all of V1-V4, which might lead you to believe it is LV aneurysm.  However, this ECG has up to 4 mm of ST elevation (in V4, 4 mm STE is relative to an 11.5 mm S-wave), and I have never seen an LV aneurysm case with this much ST elevation.


This is a typical LV aneurysm:


Then my partner told me about the case:

A middle aged woman presented in pulmonary edema. She had suffered from chest pain 2 weeks earlier.

She had an immediate bedside ultrasound:


Many B-lines of pulmonary edema


Here is a view of her left ventricle:


Akinetic Septum and Apex.  Echo differential is large anteroseptal MI vs. Takotsubo.


Short axis view:

Akinetic septum.  Since this is more focal, takotsubo is much less likely.


Here is a view using Speckle tracking strain echocardiography, which can be done on our ED POCUS machines.


There is a surprising amount of collapse of the inferior vena cave (IVC):


She was stabilized on noninvasive positive pressure ventilation and was able to lie flat for an angiogram.

The patient was taken to the cath lab and a 100% thrombotic mid-LAD occlusion was found.


Troponin I profile:
This troponin profile is consistent with an MI that occurred many days ago and was much higher then.  The slight rise may be due to the additional stress of acute pulmonary edema. 


Echo on day 3:
38% ejection fraction
Anteroapical Wall motion abnormality.
ECG:
Now the T/QRS ratio is 4/13,which is less than 0.36
But it is more than it should be after successful reperfusion.
This is a bad sign and indicates poor microvascular reperfusion.
Such persistent ST elevation after reperfusion is an ECG sign that an LV aneurysm will develop.


Friday, April 14, 2017

What is the culprit artery? Not what you think.


An elderly woman who was quite healthy except for some chronic renal insufficiency and hypertension had 3 days of classic angina lasting only 10-15 minutes at a time, but which became more constant on the day of presentation.

She called 911.  Medics palpated a pulse of 80 and a BP of 140 systolic, and recorded this prehospital ECG (day 1):

Atrial Fibrillation at a rate of about 120.
Profound ST depression: leads I, II, III, aVF, V3-V6.
There is STE in aVR (reciprocal ST elevation, reciprocal to the ST depression)
This is classic diffuse subendocardial ischemia.


She was given a sublingual nitroglycerin and her BP dropped to 80 systolic.

On arrival, she still had chest pressure and this ECG was recorded:
Atrial fibrillation with rapid ventricular response
Diffuse ST depression, as with prehospital ECG


Is the ischemia a result of atrial fib with RVR, or is atrial fib with RVR just exacerbating ischemia whose source is acute coronary syndrome?

The history is highly suggestive of ACS.

The patient was given a diltiazem bolus and drip, her pulse slowed, and her chest pain completely resolved.  Another ECG was recorded:
Atrial Fib with a controlled rate
The ST Depression is mostly resolved with this slower rate

The first troponin was, not surprisingly, elevated at 1.07 ng/mL.  

The blood pressure was well maintained.  The patient was started on heparin and aspirin, and coronary angiography was planned for the next morning but also with plans to take her emergently to the cath lab if her pain recurred or if the ST depression recurred.

She did well overnight.  The troponin peaked on day 2 at 3.0 ng/mL (expected with complete resolution of ischemia -- this rise is due to ischemia that occurred before the rate control).

The ECG showed near complete resolution of ischemia on day 2:
Now converted to sinus rhythm.
Only minimal residual ST depression


Formal Echo showed a subtle inferior wall motion abnormality.

For various reasons, partly due to her calculated risk of angiography, she did not go to the cath lab that day.

The next day (day 3), the pain recurred and another ECG was recorded:
Inferior-posterior-and lateral subtle STEMI


At this point, she went emergently to the cath lab and had a circumflex occlusion with thrombus.


Comment 1:

You thought it was going to be LAD or Left Main, right?  It certainly could have been.  But it is important to remember that ischemic ST depression does not localize.  When there is diffuse subendocardial ischemia, it can be due to any culprit artery.  This is proven in stress testing, in which the location of the ST depression during stress does not predict the stenosed artery.  Why is this?  Uncertain.

In this case, the thrombus in the circumflex on day 1 was non-occlusive, resulting in subendocardial ischemia that manifested as ST depression in many leads.  It is tempting to say that the ST depression was "posterior STEMI" on these initial ECGs, but that is not so.  The ST depression was not V1-V3 (as in posterior STEMI), but rather V3-V6 (which is what is seen in subendocardial ischemia).  Furthermore, there was ST depression in I, II, III, and aVF.  The ST depression vector was inferior and anterior, with a reciprocal ST elevation vector that is superior (resulting in STE in aVR).

2 days later, when the artery completely occludes, real STEMI results, with an ST elevation vector towards inferior and posterior walls.  Complete occlusion reverses the ST vector! 


Comment 2:

This is a great example of how the dichotomy between STEMI and Non-STEMI is false.  They are both due to thrombus in the coronary artery and both are very dangerous.  STEMI and NonSTEMI exist on a spectrum.  Thrombus can lyse and propagate, and NonSTEMI can convert to STEMI.

Saturday, April 8, 2017

8 year-old with report of "syncope and an abnormal ECG".

This case was contributed by John Dunbar, an outstanding Hennepin EM Resident.

A previously healthy, fully immunized 8 year-old African American boy presented with a report of "syncope and abnormal ECG" by EMS.  

On arrival to the ED, he was awake but lethargic with EMS report of normal prehospital glucose by EMS, HR in the 90s and BP's in the 110s/70s and O2 sats of at least 98% on room air.  Immediately, a bedside cardiac ultrasound was performed while the ECG was being setup and this showed good global function, no effusion, no overt ventricular enlargement or septal hypertrophy (measurements not taken) and a normal caliber IVC without B-lines bilaterally.  A 12-lead ECG was performed as below and looked similar to the prehospital ECG (not available): 
Figure 1.
Sinus rhythm with normal axis.
Biphasic T-waves with asymmetric T-wave inversion in V1-V4
ST elevation in V1, V2, V3.
Unusual T-wave inversion in V2 and V3

The ECG was texted to Dr. Smith contemporaneously with the patient's ED evaluation and this is what Smith wrote:"Is he African American?  This is a different kind of normal variant.  This is not a case of classic juvenile T-waves.  Check out the following blog post which shows some other normal variants, of which this is one: Persistent Juvenile T-wave Pattern. This post has examples of various benign T-wave patterns."

Normal variants T-wave inversion includes, but is not limited to:
1.  ST-T Normal Variation (STTNV) 
2. "Persistent" Juvenile T-waves 
      --As they're not really "persistent," it is more appropriately called Juvenile T-W Pattern (JTWP) because this T-wave pattern is normal for the very young and up until adolescence, but it is not necessarily persistent, in that it may come and go.
3.  Benign T-wave Inversion (BTWI), which is often lumped together with STTNV (1).  

I like to differentiate BTWI from STTNV.  BTWI, which Dr. Smith first learned about in Chou's textbook "Electrocardiography in Clinical Practice," has STE and T-wave inversion primarily in V3-V6; STTNV primarily in V2 and V3. 


The pattern in this 8 yo is consistent with ST-T Normal Variation (STTNV), also called “ST Elevation and Inverted T Wave.”  It is a normal variant of early repolarization that can persist just like Juvenile T-wave Pattern (JTWP).
Here are two examples of STTNV from the earlier post which was written largely by Brooks Walsh (http://hqmeded-ecg.blogspot.com/2015/01/persistent-juvenile-t-wave-pattern.html):

Choo 2002 (2)
T-wave inversion is mostly in V2 and V3
STTNV
Figure 2.

2009 Papadakis (3)
STTNV
Again, mostly in V2 and V3
Figure 3.

1. The ST elevation in V1-V3 with the asymmetric t-wave inversions is what makes this STTNV. This pattern is less commonly seen in children. Some consider it a variant of JTWP, though others feel it is a separate entity (1).  This pattern is subtly different from Benign T-Wave Inversion, which is primarily in V3-V6 (see 3 examples below) and this post: Benign T-wave Inversion: view video or read text


2. Juvenile T-wave pattern (JTWP) does have asymmetric inverted T-waves in V1-V3, as in this normal ECG from a 3 year old, borrowed from Chan et al. (10).  These T-wave inversions can extend to V4.
Juvenile T-wave Pattern
Figure 4: ECG of 3 year-old girl showing characteristics of JTWP:
Shallow T-wave inversions, limited to V1-V3, V4
Assymetric morphology of the inverted T-wave
No significant ST Elevation


Here is are 3 examples of Benign T-wave Inversion:
Notice the precordial T-wave Inversion is primarily in V3-V6.  There is typical STE of early repol in V2.  There is a small S-wave and large R-wave in V4.  Often there is also T-wave inversion in inferior leads.


Commentary

JTWP, BTWP, and STTNV can persist into adulthood and complicate presentations for chest pain, syncope, palpitations, SOB, etc. as these patterns have to be differentiated from ACS, PE, ARVD, etc.

- PJTWP typically resolves by age 19 in males and age 30 in women and is more common in women (4, 5, 6, 7, 8, 9)  

- BTWI is more common in African American males and athletes. (1).

Dr. K. Wang has shown that STTNV (which Smith calls BTWI, as the ECGs in this cohort all had T-wave inversion in V3-V6) is by far most common in African American males.   Smith has studied all the EKGs in his cohort and found that:

1. There is a relatively short QT interval (QTc less than 425ms).  
2. The leads with T-wave inversion often have very distinct J-waves.
3. The T-wave inversion is usually in leads V3-V6 (in contrast to Wellens' syndrome, in which they are V2-V4)
4. The T-wave inversion does not evolve and is generally stable over time (in contrast to Wellens', which evolves). 
5. The leads with T-wave inversion (left precordial) usually have some ST elevation 
6. Right precordial leads often have ST elevation typical of classic early repolarization 
7. The T-wave inversion in leads V4-V6 is preceded by minimal S-waves 
8. The T-wave inversion in leads V4-V6 is preceded by high R-wave amplitude 
9. II, III, and aVF also frequently have T-wave inversion.

Case Continued

With respect to this specific case, the history was more consistent with a seizure: while at the store, he reported to his mother he didn't feel well with a mild frontal headache. He then collapsed and was noted by an EMT bystander to have eye deviation, rhythmic tongue movements and increased tonic activity.  When EMS arrived 6 minutes later, he remained confused with his eyes open unable to follow commands more consistent with postictal state than syncope. On arrival to the ED he was drowsy with a non-focal exam and persistence of his mild headache that resolved over 30 minutes or so. He had no prodromal symptoms other than headache, no antecedent illness and no fevers.

However, given the perceived ECG abnormalities, Peds Cardiology was asked to review the ECG and reported it was normal but did not expand.  When sent to Dr. Smith, he immediately recognized the T-wave inversions are a normal variant similar to STTNV.  This has been reviewed in the blog before and you can explore the prior posts (http://hqmeded-ecg.blogspot.com/search?q=juvenile) for more details.  Differentiating pathologic findings from normal variants among both adult and pediatric ECGs is paramount both for rapid diagnosis and prevention of therapeutic delay on the one hand, and avoiding excessive downstream testing on the other. 

After normal labs and period of observation patient was discharged with close follow up with pediatric neurology and diagnosis of first time seizure.  

References:
(1) Roukoz H.  Wang K.  ST Elevation and Inverted T Wave as Another Normal Variant Mimicking Acute Myocardial Infarction: The Prevalence, Age, Gender, and Racial Distribution.  Annals of Noninvasive Electrocardiology 16(1):64-69, January 2011.   doi:10.1111/j.1542-474X.2010.00410.x.
This is Benign T-wave Inversion

(2) Choo JK, Abernethy III WB, Hutter Jr. AM. Electrocardiographic observations in professional football players. Am. J. Cardiol.2002;90(2):198-200. doi:10.1016/S0002-9149(02)02454-2.

(3) Papadakis M, Basavarajaiah S, Rawlins J, et al. Prevalence and significance of T-wave inversions in predominantly Caucasian adolescent athletes. Eur. Heart J. 2009;30(14):1728-1735. doi:10.1093/eurheartj/ehp164.

(4)  Marcus FI.  Prevalence of T-Wave Inversion Beyond V1 in Young Normal Individuals and Usefulness for the Diagnosis of Arrhythmogenic Right Ventricular Cardiomyopathy/Dysplasia.  Am J Cardiol 2005;95:1070-1071.

(5) Kaid KA, Maqsood A, Cohen M, Rothfeld E. Further characterization of the “persistent juvenile T-wave pattern” in adults. J. Electrocardiol. 2008;41(6):644-645. doi:10.1016/j.jelectrocard.2008.08.028.

(6) Aro AL, Anttonen O, Tikkanen JT, et al. Prevalence and Prognostic Significance of T-Wave Inversions in Right Precordial Leads of a 12-Lead Electrocardiogram in the Middle-Aged Subjects. Circulation 2012;125(21):2572-2577. doi:10.1161/CIRCULATIONAHA.112.098681.

(7) Assali A-R, Khamaysi N, Birnbaum Y. Juvenile ECG pattern in adult black arabs. J. Electrocardiol. 1997;30(2):87-90. doi:10.1016/S0022-0736(97)80014-3.

(8) Malhotra A, Dhutia H, Gati S, et al. 103 Prevalence and significance of anterior T wave inversion in females. Heart Br. Card. Soc.2014;100 Suppl 3:A60. doi:10.1136/heartjnl-2014-306118.103.

(9).  Rawlins J, Carre F, Kervio G, et al. Ethnic Differences in Physiological Cardiac Adaptation to Intense Physical Exercise in Highly Trained Female Athletes. Circulation 2010;121(9):1078-1085. doi:10.1161/CIRCULATIONAHA.109.917211.

(10).  Chan TC, Sharieff GQ, Brady WJ. Electrocardiographic Manifestations: Pediatric ECG. J. Emerg. Med. 2008;35(4):421-430. doi:10.1016/j.jemermed.2007.09.039.


Thursday, April 6, 2017

Wide complex tachycardia and an ICD that is not firing

A 40-something woman with a history of MI and ischemic cardiomyopathy and previous VT, with an implanted cardioverter-debrbrillateror (ICD) and on no antidysrhythmics had the acute onset of fluttering in the chest along with dizziness while she was sitting.  She called 911 after 15 minutes without resolution.

She was found alert with a normal BP and good oxygen saturations, not in distress.  There was no CP or SOB.

Here is the prehospital rhythm strip:
Regular, Wide Complex Tachycardia


Very wide complex, regular, rate 150
Here is the 12-lead:


Here is a printed version of the prehospital ECG.  It shows more detail:

Wide-complex tachycardia at the rate of 150 bpm. 
The R-wave is upright in aVR and the initial part of the QRS is wide.
These ECG features, with ischemic cardiomyopathy and presence of an ICD, all highly suggest VT.


Patient was given a trial of adenosine 6 mg which did not convert to sinus rhythm, so the medics performed synchronized electrical cardioversion after giving 5 mg of midazolam.

Comment: Electrical cardioversion is not inappropriate, but also not necessary, as she was very stable.  The downside is that sedation with midazolam is not always so benign.  It can result in hypotension or hypoventilation.  Fortunately, she had neither and did not remember the cardioversion later.

Here is her post-conversion prehospital ECG:


Sinus Rhythm at a rate of 77
Rather bizarre very wide complex, neither RBBB nor LBBB.  

This wide complex should make you scrutinize the morphology of the tachycardia to ascertain whether this wide complex that we see in sinus rhythm is the same wide complex seen during the tachycardia.  If it is identical, then the rhythm would have been SVT.

On arrival, the patient stated that she had never felt her ICD fire.   This suggests that her rhythm was not her usual VT, but some other rhythm which her ICD is not programmed to detect.  She also stated she had had several episodes of self-terminating palpitations in the past week.

She denied any CP or SOB at any time.

An ECG was recorded:
Now there is sinus with obvious ventricular pacing and PVCs.

If you look closely at the QRS, it is identical to the prehospital ECG (the one that has sinus rhythm).
This proves that the post-cardioversion prehospital was also paced and explains that baseline bizarre wide complex.
Pacer spikes are often very difficult to see.

Electrolytes were normal.  We interrogated the ICD in the ED and found that the ventricular rate had indeed been 150 and the atrial rate 95 (this confirms AV dissociation, proving VT).  The tachycardia detection rate was 167.  The previous VT for which the ICD was implanted had a rate of 180 which thus would have been detected by the 167 threshold.

The tachycardia today at 150 was NOT detected; this turns out to be a second source of VT at a slower rate.


No underlying provoking factor was found (ACS, electrolytes) and the ICD was reprogrammed for a rate of 150.

It was decided not to start any antidysrhythmic, as that might not work, might have adverse effects, and could possibly change the rate of any future VT rendering the ICD ineffective again.