Wednesday, July 30, 2014

Look at the PVCs (again)!!

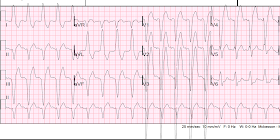
An elderly woman awoke with bilateral upper chest pressure and SOB.  She called 911.  Here is the first prehospital ECG:
Sinus rhythm with a PVC.
There is subtle ST elevation in aVL, with reciprocal ST depression in III.
There is also suggestive STE and large T-waves in V5 and V6.
Look more closely at the PVC in aVL: there is 1 mm of STE after a 3 mm S-wave, for a high ST/S ratio of 0.33.  If this were LBBB, it would suggest STEMI.  But does this apply to a PVC?

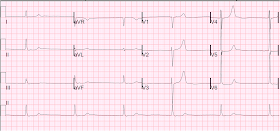
Here is the second prehospital ECG:
There is a PVC in V4-V6.  The PVC in V5 has 2 mm STE after an 8 mm S-wave, for a ratio of 0.25.  This would also be a high ratio for LBBB, but is it for a PVC? 

No single finding here is diagnostic of MI, but the whole pattern is: an elderly patient with typical ongoing pain, subtle STE with reciprocal STD, and 2 suggestive PVCs.

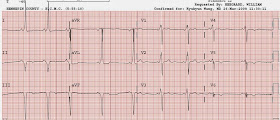
On arrival, pain persisted and an ED ECG was recorded:
Now there is reciprocal STD also in aVF, and new ST depression in V2 and V3, diagnostic of MI, almost certainly posterolateral.

I saw this patient and activated the cath lab immediately.

Angiography showed a large OM with 99% thrombotic occlusion in its proximal segment.

But it also showed: a mid LAD lesion with a 99% occlusion in its mid segment.  (not noted whether this had acute thrombus)

The LAD lesion was a surprise to me, and whether it was a co-culprit is not noted.  The large T-waves in V3 and V4 could be de Winter's waves, rather than posterior STEMI.  These two entities may be confused.

Both lesions were stented.


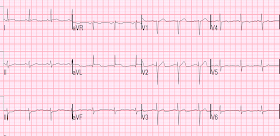
Here is the post cath ECG:
The ST depression is gone.  T-waves in V3-V6 are all flattened now.


The troponin I peaked at 16.4 mEq/L

The post cath echo showed:
Normal LV size, mild concentric LV hypertrophy and severe systolic dysfunction, EF 20%.
Regional wall motion abnormality-distal septum anterior and apex, large and akinetic .
Regional wall motion abnormality-anterolateral, akinetic .
Regional wall motion abnormality-inferolateral, hypokinetic.
Regional wall motion abnormality-distal inferior, hypokinetic.

A study 2 days later was slightly improved, and one 3 days after the first had the following:

Contrast echo study: "MUCH OF THE RESTING RWMA NOTED YESTERDAY APPEARS TO HAVE NORMAL PERFUSION, IMPLYING POTENTIAL RECOVERY OF FUNCTION"

Which turned out to be true, as a 3 month convalescent echo showed:
The estimated left ventricular ejection fraction is 54%
The estimated pulmonary artery systolic pressure is 26 mmHg + RA pressure.
Normal estimated left ventricular ejection fraction lower limits of normal.
No wall motion abnormality

The patient did well.

Lessons:

1. Look at PVCs for evidence of ischemia.  Here are many more such (great!) cases
2. Frequently, one finding on the ECG is not diagnostic, but the combination of several, which match ischemia of one or more coronary distributions, will make the diagnosis.

Tuesday, July 29, 2014

LBBB on Cardiac Ultrasound: do not be fooled into diagnosing a wall motion abnormality!

The last case on the blog of LBBB with very high voltage was actually first identified as LBBB by ED bedside echo, which was done PRIOR to the ECG.

The images were captured on one of our new ultrasound machines, with Speckle Tracking, which uses software to outline the movement of the myocardium, making it easier to see the wall motion.


The sonographers acquiring the image stated "there is a wall motion abnormality."


Question:

Is there a wall motion abnormality?  Better question: the wall motion is abnormal, but why?

Here is the Apical view:


apical from HQMedEd on Vimeo.

Here is a still picture with annotation:
White oval: Right Ventricle.  Blue Arrow is Septum.  Yellow Arrow is LV free wall.
The graph on the right show that different walls (see color coding of graph lines which correspond to the line colors of the speckle tracking on the image) have movement at different times, with the LV free wall (light blue) both contracting (positive deflection) and relaxing (negative deflection) later than the septum (lavender color)

Answer:  the wall motion is abnormal because of an abnormal sequence of activation: the RV and septum move before the LV free wall.

I was looking at this image when the MDs doing the exam claimed there was a wall motion abnormality.  I could see that this was due to an abnormal sequence of activation.


My response was: "The ECG will show Left Bundle Branch Block."


LBBB activates the septum and RV first, through the intact right bundle.  Next, the impulse travels through myocardium (not through the high speed purkinje system) to activate the rest of the LV, including the LV free wall.


Here is the Parasternal Short Axis View:


short from HQMedEd on Vimeo.

As on the previous video, the septum (left side of outlined LV is activated before the LV free wall.

Here is the ECG:


Comment:

Diagnosing a wall motion abnormality on bedside echo is very difficult and requires a high degree of expertise, and even then is difficult without having contrast material such as Definity (R).


False negatives are very common.


But there are also false positives: a common false positive is due to bundle branch block.  BBB causes an abnormality in the sequence of activation and thus causes wall motion to appear abnormal.  However, the wall motion is not abnormal because of decreased motion; it is abnormal only because it is activating in an abnormal sequence compared to the remainder of the heart.


Saturday, July 26, 2014

Is there excessively discordant ST Elevation in this ECG with Left Bundle Branch Block?

A patient complained of atypical chest pain and cough.  Here is his ECG:
There is sinus tachycardia at a rate of 120 with LBBB.  By the way, this is a New LBBB.  Where do we measure the ST elevation in the right precordial leads????  See below.


It is easy to find the J-point in lead V1, and all other J-points beneath it are simultaneous.  So I drew a line from the J-point directly down.  The intersection of the left side of this line with the tracing in leads V2 and V3 is the J-point.  It is 8 mm in V2 and 14 mm in V3.  

8 and 14 mm of ST Elevation!!  In a patient with new LBBB!

Surely this must be an acute anterior STEMI, no?

Again, the ECG is always proportional, with repolarization proportional to depolarization.  In this case, the S-wave in V2 is 42 mm and the S-wave in V3 is well over 60 mm (it goes far off the page).

Ratios:
V2: 8/42 is less than 0.20
V3: 14/(greater than 70) is less than 0.20

We found that a ratio greater than or equal to 0.25 was very sensitive and specific for coronary occlusion.  A value greater than 0.20 is almost always occlusion as well.

But a normal maximum ratio from V1-V4 is about 0.11, so I think any ratio greater than 0.15 should be scrutinized, with serial ECGs/echo.

So the ratios are not excessive, but they are borderline.  In this case, there was no STEMI, and there was indeed no MI in this case.

Another point: in LBBB, an increased heart rate will often increase the ST elevation.  So before coming to conclusions, it is wise to lower the heart rate.  In this case, the patient was dehydrated, so he received some fluids and his heart rate came down to about 95:
See the annotated EKG below


Now there is:
 V2: 5.5 mm of STE with a 35 mm S-wave (ratio = 0.16)
 V3: 7.0 mm of STE with a 57 mm S-wave (ratio = 0.12)


So BOTH the QRS voltage and the ST elevation voltage have come down, but the ratio has come down even more.

You may object: "the ST elevation ratio is dynamic!  There must have been a transient STEMI!!"

But this is not the case: tachycardia gives false + ST elevation in LBBB.  In this case, the ST elevation ratio is under the threshold of 0.20 - 0.25 both before AND after the heart rate is brought down.

Lessons:

1. Tachycardia elevates the ST segments in Left Bundle Branch Block
2. The significance of ST elevation depends on its proportion to the QRS
3. Finding the J-point in any one lead may be difficult.  Use the other leads to draw a vertical line to find it!

Friday, July 25, 2014

Syncope and Bradycardia

An elderly woman had syncope while having a bowel movement.  She had an aortic stenosis murmur.  Here is her ECG:
Computer only read sinus bradycardia.  Anything else?
Or are there P-waves buried in the T-waves, and this actually 2nd degree AV block, Mobitz II?
Computer Measurements:
PR interval 174 ms, QRS 106 ms, QT 474 ms, QTc 442 ms, QRS axis 43, T wave axis 53.
Thoughts?


The differential of her syncope was listed initially as:
--sick sinus syndrome (because of the bradycardia)
--normal sinus, but 2nd degree AV block, Mobitz II
--aortic stenosis
--Valsalva syncope (on the toilet)
What is the most important entity missing from this differential?


Long QT.  Again, the computer fails at measuring the QT interval.  Here is another case I recently posted.

Here is a manual measurement in lead V5.  One measures this be drawing a line along the downward slope of the T-wave until it intersects with the baseline:
From the beginning of the QRS (vertical line) to the end of the T-wave (slanted line) is 15.75 little boxes, each of which is 40 ms.  40 ms x 15.75 = 630 ms
The preceding R-R interval is 1200 ms = 1.2 sec.  The square root of 1.2 is 1.095.  The QTc is then: 630 divided by 1.095 = 575 ms

The computer read a QTc of 442 ms (vs. our manual measurement of 575 ms!!)

Sometimes, what appears to be a prolonged QT is really a QU interval (a U-wave is making it appear as if there is a long QT).  Is that the case here?  No.

Case Progression:

The patient was given 2 g of IV Magnesium.  A Mg level returned low at 1.2 mEq/L.  The patient was admitted to telemetry.  More Mg was given until the level was up to 2.2 mEq/L.

While on telemetry, she had a 12 second episode of Torsade de Pointe.  She also had several runs of Non-sustained VT and many PVCs.  Echo showed only moderate aortic stenosis.

She was found to be on a couple antibiotics that can prolong the QT interval.  More magnesium was given.  There was a plan for isoproterenol infusion should this recur.

See here for full management of Polymorphic Ventricular Tachycardia.

Again, the computer measurement of QT interval fails.  The computer does well at measuring QT intervals of less than 450 ms.   I have been unable to find studies of the accuracy of computerized QT interval when it is long.  But in my very long experience, and paying a lot of attention: when the QT is long, the computer usually fails to register this abnormality.  

Lesson:

1.  You must assess the QT interval visually.  If it appears long, then measure it manually (in the lead in which it is longest).  A QTc interval greater than 500 ms is potentially dangerous.

2.  Acquired long QT is more likely to cause torsade when the patient is bradycardic ("pause dependent").  A longer pause creates a longer QT interval, allowing more time for a PVC to land on the vulnerable part of the T-wave.  Thus, increasing the heart rate with isoproterenol or overdrive pacing prevents Torsade.

3.  Although a slow heart rate results in a shorter QTc (corrected for heart rate), it also leads to a higher risk of Torsade at any given QTc!

Tuesday, July 22, 2014

Are these peaked T-waves the patient's baseline T-waves?

A middle-aged patient presented feeling moderately ill.  He had an ECG recorded.
QRS 102 ms.  There are peaked T-waves. See V4 especially.  The ST segment is horizontal until it abruptly rises to a very peaked T-wave.  The T-wave is "tented" to a point.  It is all but pathognomonic for hyperkalemia.

By history, the patient had no reason to have hyperK on history. A recent previous ECG, done at a K of 4.5 mEq/L, was sought by the residents:
The old ECG also shows very peaked T-waves.  The residents concluded that these were his baseline T-waves.  Were they correct? 


No!  Notice the ST segments in the ECG at presentation are much more flat, and they then rise much more quickly to a peaked T-wave, especially in lead V4. 

Case Conclusion

Residents had already made the comparison and decided that it was not different.  Several minutes later, I saw these two ECGs and immediately saw the difference.   I could see that the new ECG was diagnostic of hyperkalemia, and told the residents that they must immediately start treatment.  As we were walking to his room, and before Calcium could be given, the patient had a v fib arrest while in his room, before his K returned from the lab.  This was a presumed hyperkalemic arrest.  He was immediately defibrillated and given Calcium.  His K returned at 7.0 mEq/L.

Some say you don't need to treat hyperK unless there is QRS widening, claiming that merely having peaked T-waves is not enough.  This is only one case, and anecdotal, but we found no other etiology of arrest in this patient.  The patient had new renal failure as the etiology of hyperK.


1.  Peaking of T-waves occurs in other conditions than hyperkalemia, such as early repolarization.  Comparison with the previous ECG must be done very carefully

2.  I always treat immediately if I think the ECG is affected by hyperK.  I do not wait for the laboratory results

Friday, July 18, 2014

Subacute AnteroSeptal STEMI, With Persistent ST elevation and Upright T-waves

A man in his 60's presented after 4 days of chest pain, with some increase of pain on the day of presentation.  Exact pain history was difficult to ascertain.  There was some SOB.  He had walked into the ED (did not use EMS).  He was in no distress and vital signs were normal.  Here is his ECG:
What is your interpretation?  Obviously there is MI.  How acute is it?


Description
There is atrial fibrillation at a rate of 95.  There is Right Bundle Branch Block with a QR particularly noted in V1-V3 (no rSR', because there is an initial Q-wave; this is diagnostic of infarction in the anterior wall and septum).  The Q-waves extend to V5 and are very wide (80 ms in V2).  There are also inferior Q-waves which can mimic a left anterior fascicular block, as they result in left axis deviation.  There is rather massive ST elevation, and this is not only anterior but inferior (see analysis below).  


The end of the QRS is best seen in lead V1 (and results in a QRS duration of 176 ms).  If one draws a line down to lead II across the bottom, one can find the end of the QRS in lead II.  From there, one can find the end of the QRS in all leads.  This analysis shows that there is ST elevation after the end of the QRS in lead II, III, and aVF, and reciprocal ST depression in aVL.  Thus, this is BOTH an anterior and inferior STEMI in the setting of RBBB.


How old is this antero-inferior STEMI?  

Could it be acute (vs. subacute or days old)?  Although the patient has had pain for 4 days, could the artery have fully occluded only within hours?  Very unlikely.  Although acute anterior STEMI frequently has narrow QR-waves within one hour of onset (1. Raitt et al.), such Q-waves are associated with larger MI and worse outcomes (2. Armstrong et al.), the presence of such well developed, wide, anterior Q-wave suggests completed transmural STEMI.  

So this patient likely has a several day old infarction, with persistent ST elevation and persistently upright T-waves.

The wide Q-waves suggest "transmural" MI (completed MI with infarction of the entire thickness of the ventricle).  This was common in the days before reperfusion of STEMI, but still happens in patients who present late and therefore do not get timely reperfusion therapy.  When there is MI extending all the way to the epicardium (transmural), that infarcted epicardium is often inflamed (postinfarction regional pericarditis, or PIRP).  


What complication is the patient with post-infarction regional pericarditis at risk for?

The patient was taken to the cath lab emergently and a 100% mid LAD occlusion was opened but opening resulted in no flow.  The initial troponin I was 23.7 ng/ml and was falling, confirming infarction days ago.

Case Continued

2 days later the patient became increasingly tachycardic, hypotensive, ashen, clammy (in cardiogenic shock) and had a new murmur.  This was the 12-lead ECG. 

Add caption

Not much change, except a slightly faster ventricular response at 110 bpm.  No resolution of ST elevation.  The T-waves are persistently positive.  This remains consistent with PIRP, as was the first ECG.  Notice also how easy it is to diagnose ST elevation in the PVC.

An echocardiogram showed no hemopericardium, but Doppler showed a new small ventricular septal defect with left to right shunting.  This was in addition to a large septal, anterior, and apical wall motion abnormality, and moderately severely decreased LV function.

An intra-aortic balloon pump was placed, and the patient was taken for immediate surgical repair but did not survive.

Discussion

When there is full thickness infarction, there is epicardial inflammation (post-infarction regional pericarditis), and the myocardium is at risk of "rupture."  The term "rupture" makes it sound like some sort of explosion or massive blowout, but it is usually a small, slow leak that, over time, can cause tamponade and death.  Rupture can be either free wall rupture (causing tamonade) or septal rupture, causing ventricular septal defect with left to right flow and resulting pulmonary edema and shock.  If detected early by ultrasound, the patient can be saved.  Our own Dave Plummer of HCMC reported on survival of 2 of 6 patients with STEMI who had free wall myocardial rupture diagnosed by presence of hemopericardium on bedside ultrasound in the ED.(3)

Oliva et al. (4) strongly associated myocardial rupture with postinfarction regional pericarditis (PIRP), and associated PIRP with persistent upright T-waves.  He found 2 ECG patterns of atypical T-wave development in PIRP:
1) persistently positive (upright) T-waves 48 hours after AMI onset. 

2) premature, gradual reversal of inverted T waves to positive (upright) deflections by 48 to 72 hours after MI onset in the presence of well formed Q-waves.

Lessons:

1. Well formed Q-waves with persistent ST elevation, especially in a patient with prolonged pain, should alert to transmural MI with possible post-infarction pericarditis. One should be on the alert for myocardial rupture.  
2. In the case of septal MI, as here, be on the alert for development of a ventricular septal defect.
3. Bedside echo may detect these in a timely way.
4. Additionally, these patients have a high incidence of LV aneurysm with mural thrombus.
5. Although rupture has a high mortality, it is not uniformly fatal


References

1.  Raitt MH, Maynard C, Wagner GS, Cerqueira MD, Selvester RH, Weaver WD. Appearance of abnormal Q waves early in the course of acute myocardial infarction: implications for efficacy of thrombolytic therapy. J Am Coll Cardiol 1995;25(5):1084-8.

2.  Armstrong PW et al.   Baseline Q-wave surpasses time from symptom onset as a prognostic marker in ST-segment elevation myocardial infarction patients treated with primary percutaneous coronary intervention.  J Am Coll Cardiol 53(17):1503-9. Apr 28, 2009.


3. Plummer D.  Dick C. Ruiz E. Clinton J. Brunette D. Emergency department two-dimensional echocardiography in the diagnosis of nontraumatic cardiac rupture.  Ann Emerg Med 1994; 23(6):1333-42.

4.  Oliva PB, Hammill SC, Edwards WD. Electrocardiographic diagnosis of postinfarction regional pericarditis: ancillary observations regarding the effect of reperfusion on the rapidity and amplitude of T wave inversion after acute myocardial infarction. Circulation 1993;88(3):896-904.

5. Oliva PB.  Hammill SC.  Edwards WD.  Cardiac rupture: a clinically predictable complication of acute myocardial infarction: report of 70 cases with clinicopathologic correlations.  J Am Coll Cardiol 1993;22(3):720-6


Sunday, July 13, 2014

Bradycardia, SOB, in a Dialysis Patient

A dialysis patient presented with dyspnea and a heart rate of 33.  His medications included amlodipine and carvedilol.  He has a history of hypertension and DM.  His BP was 150/45 (bradycardia leads to long run-off time after each systolic beat, leading to low diastolic pressure).  He appeared comfortable, in no distress.
QRS duration is normal at 97 ms.  What is the diagnosis until proven otherwise?


This ECG shows a junctional bradycardia (either sinus arrest with junctional escape, or severe sinus bradycardia with junctional escape), with retrograde P-waves (see the negative deflection just after the QRS in lead II, and the positive deflection just after the QRS in V1).  Because this patient has LVH and left atrial enlargement, he normally has a negative P-wave in V1 (see below); with retrograde activation, the atrium depolarizes from inferior to superior, changing its polarity on the ECG to upright.

A dialysis patient with bradycardia has hyperkalemia until proven otherwise.  In this case, the K was 7.5 mEq/L.  Notice there are no other signs of hyperK such as peaked T-waves.


Here is his ECG from 2 weeks prior, when his K was 6.5 mEq/L:
It looks nearly identical, except for the rhythm, which is sinus bradycardia


Of course, this bradycardia could be caused by carvedilol and/or amlodipine, or the combination.  And also by sick sinus syndrome.

If the K had not been high, these would have been the likely culprits.

Management:

Before waiting for the K level to return, he was immediately given 3 grams of calcium gluconate, with no change.  Another 3 grams were given, still with no change.  Atropine 1 mg was given with no change (as expected).  Given his stability, no further ED treatment was given and he was taken for immediate emergent dialysis.

After dialysis, he returned to sinus rhythm at a normal rate.

Lesson:

Bradycardia should always prompt consideration of hyperkalemia
Bradycardia may be the only ECG sign of hyperkalemia

Friday, July 11, 2014

Repost: a certain pattern of PseudoSTEMI, with or without superimposed STEMI

I posted this on March 1, 2012.   I was inspired by a post by Len Jin Yee to repost.   But this time without the answers.  These are all on a theme, which will quickly become obvious.


Case 1.  A patient presented with an irregular and fast wide complex tachycardia and was electrically cardioverted.  Here is the post cardioversion ECG:
What is going on?  See below.


This  is WPW with secondary repolarization abnormalities.  Notice the very short PR interval and the delta waves, best seen in leads V5 and V6.  This mimics both anterior STEMI and/or left bundle branch block.  


This patient turned out to have Ebstein's anomaly, (a description of which is beyond the scope of this blog) with WPW.

_______________________________________________________________________

Case 2.  A patient with chest pain
Is it inferior-posterior MI, whether acute or old? There appear to be inferior Q-waves with possible hyperacute T-waves, reciprocal T-wave inversion in aVL suggestive of inferior MI.  There are tall right precordial R-waves with ST depression and T-wave inversion suggestive of concomitant postererior MI.  See below.


In this case, WPW mimics inferior and posterior MI.  There was no superimposed MI of any age.  Note that there are Q-waves in II, III, aVF and that the T-wave in these leads is upright. In a study of 50 patients with inferior Q-waves due to WPW and not due to MI, 47 had an upright T-wave.  The author, Ary Goldberger, suggests that in the presence of a delta wave and Q-wave, the T-wave should be discordant (opposite the Q-wave) as it is in this case, or at least isoelectric.  He suggests that if it is concordant, then one should suspect inferior infarction.  Accordingly, lateral QRS and T-wave should also be discordant.

Other than the study on inferior Q-waves and its implications for diagnosis of inferior MI, I know of no other studies assessing this phenomenon.  I am not sure if, in WPW, there is a predictable pattern. Are the QRS and ST-T complex normally concordant or discordant?  Not sure.


_______________________________________________________________________

Case 3: A patient with chest pain
There is anterior ST Elevation (V1, V2) with ST depression in inferior and lateral leads.  Looks like a septal STEMI, right?


I think you are catching on that WPW can mimic acute STEMI, with ST elevation and ST depression.  However, if you remember to always evaluate ST elevation and depression in the context of the QRS, and the abnormal depolarization results in abnormal repolarization, you will look at the QRS and recognize how abnormal it is: wide, with short PR interval and delta waves.  The ST-T abnormalities are secondary to the WPW, not primary.

_____________________________________________________________________

Case 4.  A patient with chest pain

Again, there are delta waves with subsequent inferior ST elevation and reciprocal ST depression in I and aVL, as well as V2.  You are now tuned into this, and realize that the ST elevation is secondary to the WPW, right?      


Wrong!!  This patient has acute inferior STEMI superimposed on baseline WPW.  There is simply too much ST elevation for this to be due to WPW alone.  Here is his baseline ECG for comparison.


____________________________________________________________________


Case 5.  A male in his 50's presents with 1.3 hours of chest pain.
Clearly there is WPW, with short PR interval and delta waves.  There are deep QS-waves (negative delta waves) in III and aVF, with concordant T-waves.  T-waves are upright in I and aVL.  Is there old or new inferior MI?  There is ST depression in V3-V6.  There are nonspecific ST and T-wave findings in V4-V6.  Are these all due to WPW, or is there something hiding?


14 minutes later, this was recorded:
Minimal changes

Neither of these ECGs, in my opinion, clearly show ischemia because WPW can so often mimic ischemia.  However, perhaps simply because of worrisome symptoms, or perhaps because they were unaware that these ST-T repolarization changes can be entirely due to WPW, the clinicians took the patient for an angiogram, which showed a 95% stenosis of the first diagnonal with TIMI 2 flow.  It was stented.


8 hours later, post reperfusion, this was recorded:
Many T-waves are now flattened or inverted.


Day 2 ECG: (troponin I peaked at 32 ng/mL)
Inferior T-waves are now clearly upright, lateral T-waves clearly inverted.  So these discordant T-waves in III and aVF, and I and aVL appear to be the normal discordant T-waves that one finds when there are inferior Q-waves due to WPW.  This appears to be a case of pseudonormalization of T-waves, but it is not true pseudonormalization because it is not from re-occlusion, but rather from reperfusion.   In other words, after reperfusion, the T-wave vectors are in the expected direction for WPW, not inverted from normal as is common in reperfusion.


Day 3, after ablation of the accessory pathway:
QRS is normalized except for Q-waves in I and aVL (due to the lateral AMI suffered on this occasion).   Interestingly, the T-waves are inverted in III and aVF, but not in I and aVL; that is to say that there are apparently no lateral reperfusion T-waves.  There are large T-waves in V2 and V3 which may represent posterior reperfusion T-waves (or early repol, but without a comparison from prior non-WPW ECG, this is uncertain).


Summary


WPW has abnormal depolarization through a bypass tract, manifesting as a delta wave.  And like other ECG abnormalities that have abnormal depolarization (LVH, LBBB, RBBB, Brugada, hyperkalemia, and others), they also have abnormal repolarization.  "Secondary repolarization abnormalities."  (Not primary, meaning the QRS is normal but repolarization is abnormal, as in ischemia).

Above I showed 5 cases: 
Cases 1-3 are of WPW with secondary repolarization abnormalities that could mimic old or acute MI.
Case 4 shows a baseline WPW, then with MI superimposed on it.
Case 5 is a case in which WPW conceals acute MI. 


Learning points:

1. WPW alters both depolarization and repolarization and can both mimic and obscure acute MI.
2. In WPW with inferior Q-waves (but without new or old MI), the T-wave is usually upright (discordant).  
3. In WPW with inferior Q-waves, a concordant T-wave should raise suspicion for MI, either old or new.
4. I am uncertain as to whether there are other concordance and discordance rules that may help decipher ischemia in the presence of WPW.

Friday, July 4, 2014

Is the LAD really completely occluded when there are de Winter's waves?

A male in his 30's complained of sudden severe substernal chest pain.  He was rushed to the critical care area where they recorded this ECG:
Obvious Antero-lateral STEMI due to proximal LAD occlusion (proximal because it is proximal to first diagonal, resulting in high lateral STEMI with ST elevation in I, aVL and reciprocal ST depression in inferior leads)

The cath lab was activated, and just before going to the cath lab (19 minutes after the first ECG), this ECG was recorded:
There are de Winter's T-waves (ST depression with upsloping ST segment and hyperacute T-waves).


I have often wondered if de Winter's T-waves really are due to complete occlusion, or to severe, subtotal occlusion.  Perhaps they indicate an open artery with minimal flow and severe subendocardial ischemia, but not total subepicardial ischemia.

Since ACS is so dynamic, with thrombi forming and lysing continuously, and because the ECG and angiogram are rarely simultaneous, it is probable that de Winter's T-waves are recorded in a window when the artery is barely open.

At cath, there was a 99% lesion with some flow.

Here is the first post cath ECG, shortly after opening.
(QTc = 383).  Now there are very subtle Wellens waves


Here is the ECG the next day:
QTc 440.  Well developed Wellens' waves (reperfusion T-waves after opening of LAD occlusion)

de Winter's waves

de Winter et al. (Heart 2009;95:1701–1706, http://dare.uva.nl/document/214264) published on 1890 patients who had LAD occlusion.  They found these "de Winter's waves" (ST depression in V1-V6 with upsloping ST depression and a hyperacute T-wave) in 2% of these patients, and stated they were "persistent."

A quote:  "We have observed this pattern as a static ECG pattern lasting from the time of first medical contact until the recording of the pre-procedural ECG and lasting until angiographic establishment of an occluded LAD artery (that is, approximately 60 minutes)"

They gave as an example a patient with chest pain of 91 minutes who had this pattern.  He had an ECG 71 minutes later and the pattern continued.  Then, they say: "The coronary angiogram performed shortly after this registration revealed a fresh occlusion of the proximal LAD artery."  It is in my view that it is very likely that the artery was barely open while the de Winter's waves were present, and closed off entirely by the time of the angiogram which was done "shortly after" the ECG.

My interpretation of this data

de Winter's waves are probably due to severe subendocardial ischemia, with some epicardial ischemia (enough to result in hyperacute T-waves, but not enough for ST elevation.

This is somewhat academic, because these patients clearly need reperfusion whatever the exact thrombotic state of the artery.