
This was written by Mark Hellerman, a Cardiology Fellow at Stony Brook.
He has a bunch of great videos on OMI and other cardiology topics here.
The Case:
A 60 year old man with no reported medical history presents to the ED for evaluation of chest pain.
For the past 3 days he has been experiencing substernal, exertional chest pain that resolves with rest.
At the time of evaluation in the emergency department he is pain free at which time the following ECG is obtained:

The figure below highlights (in red) the subtle inferior and lateral reperfusion T wave pattern observed by Dr. Smith
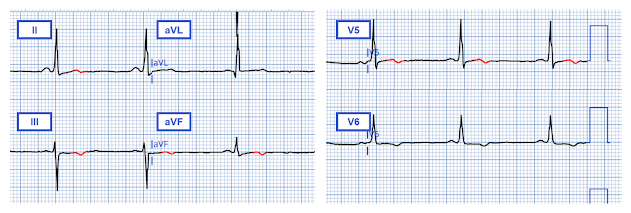
Unfortunately, the PMCardio AI EKG Queen of Hearts model did not detect reperfusion or active OMI.
Initial high-sensitivity cardiac troponin T (hs-cTnT) value returned at 24 ng/L (2 ng/L above the 99th percentile for men according to the package insert).
3 hours later, repeat hs-cTnT returned at 20 ng/L (2 ng/L below the 99th percentile).
8 hours after presentation hs-cTnT returned at 18 ng/L and the following ECG was obtained:

The patient was admitted to the cardiology service for further workup of his chest pain
12 hours after presentation the patient developed lightheadedness and nausea. Vitals revealed a blood pressure of 81/53. The following ECG was obtained:

The cath lab was immediately activated. A repeat troponin sample was collected at this time which eventually returned with a value of 17 ng/L. While awaiting for the cath lab team to arrive the following ECG was obtained:

Angiography revealed 100% thrombotic occlusion of the proximal (dominant) RCA:

A repeat ECG was obtained 1 hour after PCI:

Once again we see subtle biphasic terminal T wave inversion in the inferior and lateral territories -- this time associated with reperfusion after PCI.
An echocardiogram obtained the following day revealed a normal ejection with no wall motion abnormalities.
Discussion:
This case reminds us of two important pearls:
Reperfusion pattern on ECG can be subtle, but when identified, can help us more thoughtfully risk stratify – and thus manage – patients who present with recent anginal symptoms.
Unstable Angina (UA) still exists, even in the era of high-sensitivity cardiac troponin assays
Reperfusion pattern:
As reviewed in previous posts, Wellens' syndrome is a syndrome of transient occlusion myocardial infarction (OMI) affecting the anterior wall, in which the ECG was recorded not at the time of the anginal symptoms, but only after spontaneous resolution of those symptoms (corresponding to spontaneous coronary reperfusion) -- at which time the ECG shows reperfusion T-waves with preservation of R-waves.
When learning about Wellens' syndrome, many trainees are taught only to recognize the “Pattern B” morphology (characterized by deep symmetric T-wave inversion), failing to appreciate that reperfusion T waves exist on a spectrum -- often evolving from more subtle biphasic terminal T-wave inversion characteristic of “Pattern A” (see figure below).
While the anterior precordial T waves characteristic of Wellens' syndrome represent an important subset of reperfusion T waves (corresponding to reperfusion of the anterior myocardial wall), reperfusion T waves can be found in leads corresponding to any myocardial territory and clue you in to recent reperfusion in that region.
Smith: Pattern A Wellens' evolves to Pattern B over time, if you record enough ECGs. See here:

Here are more cases of Wellens' of the inferior, lateral, or posterior walls.
Because this ECG pattern is associated with a high rate of coronary reocclusion and subsequent transmural MI, these patients should be monitored closely with prompt administration of antiplatelets and continuous heparin while awaiting angiography. Threshold for serial ECG should be very low.
The figure below highlights the subtle inferior terminal T wave inversion in this case, which -- in the clinical context of a patient presenting shortly after spontaneous resolution of anginal chest pain -- should make you consider the possibility that it represents a reperfusion pattern (note that a similar pattern emerges after reperfusion with PCI):

Unstable Angina
The advent of the high-sensitivity troponin assay led many to wonder if it would usher out the era of unstable angina. While this assay seems to have significantly reduced the incidence of UA, it has not yet eliminated it completely.
While “myocardial injury” was technically present on admission in this case (as the first troponin value was 2 ng/L above the 99th percentile sex-specific cutoff), and thus some may argue his presentation should not be classified as “unstable angina,” I would argue that it’s not hard to imagine a scenario where the patient presented to the ED just a bit later when the troponin concentration would have likely been below the 99th percentile.
Moreover, it is well established that age also influences troponin concentration. At the age of 60 years, a hs-cTnT level of 24 ng/L seems to be below the 99th percentile upper reference limit (see figure below from a study which included a healthy reference population of 2,746 individuals which found that men 60 years of age and older had a 99th percentile upper reference limit 33 ng/L). For this reason I think it is reasonable to classify the presenting diagnosis of the patient in this case as “unstable angina” when we take into account sex AND age-specific hs-cTnT concentration thresholds.
This point is worth highlighting as a low initial troponin concentration/trend -- even in the era of high sensitivity troponin -- should not provide false reassurance when clinical context remains concerning. It was fortunate that this patient was just down the hall from the cardiac catherization lab during the subsequent plaque rupture event where he made excellent door-to-balloon time.

The Case
In this case, it is likely that the patient auto-lysed the right coronary lesion prior to presentation to the ED. The occlusion was likely too brief to injure enough myocardium to produce an impressive troponin leak. Autolysis and reperfusion of the right coronary artery prior to ED presentation was likely responsible for the subtle biphasic terminal T wave inversion seen on his presenting ECG. 12 hours after presentation the right coronary artery likely RE-occluded, manifesting in the clear ST segment elevation myocardial infarction seen at 2:00 AM.
MY Comment, by KEN GRAUER, MD (5/19/2025):
- I've presented "My Take" regarding ECG Criteria for LVH on a number of occasions (See My Comment at the bottom of the page in the June 20, 2020 post, among others). As a user-friendly reminder of LVH voltage criteria and of ST-T wave changes of LV "strain" — I've added Figure-2 and Figure-3 in an ADDENDUM below.
-USE.png) |
| Figure-1: I've labeled the initial ECG in today's case. |
- For clarity — I've highlighted in RED an outline of the limits of the QRS complex in lead aVL, in which the R wave satisfies voltage criteria in this lead by attaining a height of 15 mm.
- Support that this is a real finding — is forthcoming from the tall R wave in lead I (that measures 17 mm) — which with the relatively deep S wave in lead III (of 11 mm) — surpasses the sometimes used LVH voltage criterion of 25 mm for the sum of these 2 leads.
- The most commonly satisfied voltage criterion (Deepest S in V1,V2 + tallest R in V5,V6 ≥35 mm) — is not fulfilled in ECG #1. However, it is common for patients with LVH not to satisfy all of the criteria that I've listed in Figure-2.
- Despite lack of a previous medical history — this 60-year old man presents with classic angina (ie, 3 days of exertional CP that resolves with rest). And, since this CP apparently is a new symptom — this fulfills one definition of "unstable" angina (namely, that this patient is experiencing new angina) — with the "alarm" symptom being that this 3-day history of CP has become worrisome enough to this patient to prompt presentation in the ED.
- Bottom Line: Regardless of what this patient's initial ECG and Troponin reveal — the above symptom complex is consistent with unstable angina, and merits prompt evaluation.
- There is ST elevation and larger-than-expected positive T waves in leads V1 and V2. Is this acute ST elevation in a patient with CP? — OR — Could this be LV "strain" in a patient with LVH in whom rather than the lateral leads, we are seeing LV "strain" in anterior leads? (See My Comment in the February 6, 2020 post for discussion of this important clinical question).
- My Thought: The amount of J-point elevation and the dimensions of the T wave in lead V2 look larger-than-I'd-typically-expect given modest depth of the S wave in this lead.
- There is shallow T wave inversion in lead V6 — with subtle ST coving followed by shallow terminal T wave inversion in lead V5. Although the T inversion in V6 might be consistent with LV "strain" — R wave amplitude in this lateral chest lead is minimal (ie, not what we should expect if the T wave inversion was from LVH).
- LV "strain" should not produce the ST coving that we see in lead V5.
- There is shallow T wave inversion in both leads III and aVF. While some T wave inversion may normally be seen in lead III and/or lead aVF when the QRS is predominantly negative — lead III is predominantly positive, and the ST coving that appears in this lead is not normally seen.
- Finally, T waves are positive in the 2 lateral limb leads ( = leads I and aVL) that manifest voltage criteria for LVH (ie, So why should there be LV "strain" in lead V6 which has a tiny R wave — but not in leads I and aVL which have greatest R wave amplitude?).
- Finding a prior ECG on today's patient might prove invaluable (ie, If different from ECG #1 — a previous ECG might confirm "dynamic" ST-T wave changes indicative of an ongoing acute event).
- In the absence of a prior ECG for comparison — Given the clinical history of unstable angina in association with this patient's abnormal initial ECG — and, the slight initial elevated hs-Troponin value — prompt cath could have been justified.
- At the least — repeat ECGs (long before 8 additional hours had passed) were indicated — and could have confirmed an ongoing event.
- There is a rough (but far-from-perfect) correlation between the relative size of the QRS complex on ECG — and the degree of LV chamber enlargement. Clinically — One can glean insight from the ECG as to the relative amount of LV chamber enlargement based on: i) HOW MUCH voltage is increased by, according to criteria in Figure-2; and, ii) the presence and extent of ST-T wave changes consistent with either “strain” or a “strain equivalent” (as shown below in Figure-3).
 |
| Figure-2: Criteria I favor for the ECG diagnosis of LVH. |
 |
| Figure-3: Illustration and description of LV “strain” and a “strain equivalent” pattern. |
No comments:
Post a Comment
DEAR READER: I have loved receiving your comments, but I am no longer able to moderate them. Since the vast majority are SPAM, I need to moderate them all. Therefore, comments will rarely be published any more. So Sorry.