Friday, December 23, 2022

30-something woman with a HEART score of zero, EDACS of 2, computer "Normal" ECG, and initial troponin < Limit of Detection

I was working in triage very late when a 30 yo previously completely healthy woman walked in with 30 minutes of central chest pressure.

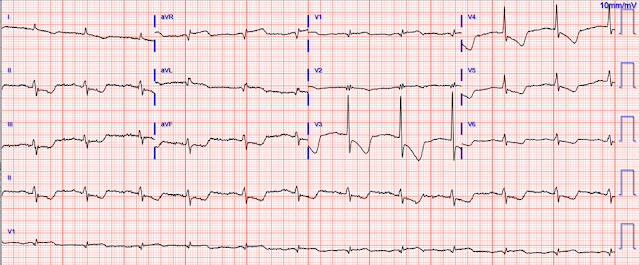
This ECG was recorded:

The computer called it "Normal" 

What do you think?

Veritas algorithm

Overread by cardiologist as normal


I immediately recognized an inferior-posterior-lateral OMI.  There are hyperacute T-waves in II, III, and aVF.  They are too large, wide, fat, and bulky in comparison to the size of the QRS to be normal.  The degree of upward concavity is less than normal.  There is a downsloping ST segment in V2.  There are relatively large T-waves in V4-V6.  

The patient was otherwise healthy, had no past history, and had never had chest discomfort before.

I immediately activated the critical care team and walked the patient to the critical care area, our "Stabilization Room."  The team was there and I showed them the ECG and said "I am 80% certain this is OMI.  Let's record another one."

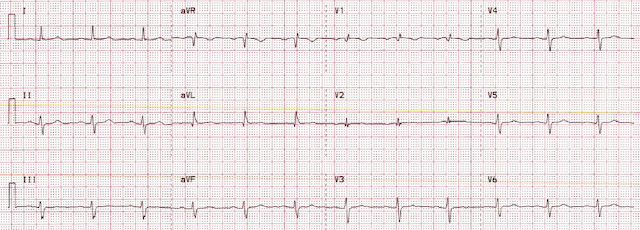
So another was recorded 19 minutes after the first:

This is diagnostic of inferior-posterior OMI.  There is dynamic change from the previous.
Moderate ST depression by Veritas algorithm and cardiologist. 

We activated the cath lab.

While waiting for the cath team, a 3rd ECG was recorded at 54 minutes after the first.
Now there is STE in V6, with large T-waves in V4-V6.
This was read as normal by the Veritas algorithm and by the cardiologist.

It never would have been detected by any of the serial ECGs without expert recognition!!
2 of them would have been called totally normal!

It may be difficult to appreciate the difference between V4-V6 between the 2nd and 3rd ECGs, so I put them side by side:

                                    2nd ECG:                         3rd ECG, 18 minutes later:
T-waves on the right are of far greater area under the curve (AUC) than the ones on the left.  
Our definition of hyperacute T-waves is that their AUC in proportion to the QRS amplitude is greater than normal T-waves.


Angiogram:

Occlusion of branch of First Obtuse Marginal.  Opened and stented.

The initial high sensitivity troponin I returned at <4 ng/L (below the limit of detection).

It peaked at 8000 ng/L 8 hours after arrival (after PCI which releases pent-up troponin).  Who knows how high it would have gone if the diagnosis had been delayed, or only made at 24 hours as so many NonSTEMI OMI are?

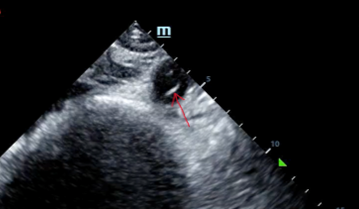
Echo: 
 
The estimated left ventricular ejection fraction is 62 %.
Regional wall motion abnormality-inferolateral, akinetic, small (apical 3-chamber only)
Normal estimated left ventricular ejection fraction .

Learning Points:

1. 25-30% of OMI are not treated in a timely way.  This is why it is essential that the OMI/NOMI paradigm replace the STEMI/NonSTEMI paradigm.  Under Non-STEMI, this patient would not have intervention until at least 20 hours (next day), after the infarct is completed.

2. We have shown that the ECG shows OMI in a very high percentage of cases, but only if you have the skills to recognize it.  This is VERY difficult and takes a lot of experience. 
 
3.  Many say the the ECG is Non-Specific.  But it is not the ECG that is Non-specific; it is the interpreter who is non-specific.  The ECG contains a huge amount of critical information, but it needs to be recognized.  Artificial intelligence (Convolutional Deep Neural Networks) will be able to discern this subtle information.

4. Beware a low HEART score.  It is only meaningful if you can accurately interpret the ECG.

5. Acute MI due to plaque rupture does happen in young people, including young women.  Here are 11 cases of young women with acute MI.


==================================
Comment by KEN GRAUER, MD (12/23/2022):
==================================
This is a “quickie case” that I like — because it reinforces a series of KEY principles essential to rapid decision-making. These principles include the following:

  • The fact that today’s patient is a previously healthy young woman in no way rules out the possibility of acute OMI.

  • The fact that the computer failed to detect any acute abnormality likewise in no way rules out the possibility of acute OMI. Computerized ECG interpretation programs are notorious for missing early subtle ECG changes of acute OMI (Please see My Comment at the bottom of the page in the February 4, 2022 post in Dr. Smith's ECG Blog for "My Take" on the Pros & Cons of Computerized ECG Interpretations).

  • It is not unusual for the initial Troponin value to be normal. An initial normal Troponin value rules out nothing.


For clarity — I’ve put the first 2 ECGs in today’s case together in Figure-1. The point to emphasize, is that although ECG findings are subtle — Dr. Smith immediately recognized that the initial ECG was distinctly abnormal.
  • The finding of an rSr’ complex in both leads V1 and V2 on ECG #1 is unusual. While possible that this might reflect an incomplete RBBB pattern (and there are narrow terminal s waves in both leads I and V6) — even though the P waves in V1 and V2 are not negative — this rSr’ pattern in V1 and V2 should always make you consider the possibility of too-high placement of the V1,V2 electrode leads. The reason this is relevant in cases like this one — is that IF you are looking for subtle signs of acute posterior OMI — you’ll want to ensure that the lead V1 and V2 electrodes are correctly placed.

  • The initial ECG presents a superb example of how to recognize hyperacute T waves. As per Dr. Smith — the T waves in each of the inferior leads (II,III,aVF) are hypervoluminous with respect to QRS amplitudes in these leads (ie, These T waves are taller — “fatter” at their peak — and wider at their base than they should be). There can be NO doubt that in a patient with new chest discomfort — that the T wave in lead III that is double the height of the R wave in this lead is abnormal.

  • The magic reciprocal relationship between leads III and aVL is present here. The reason this is a subtle finding in today's initial tracing — is that the QRS in lead aVL is tiny! But this tiny QRS in aVL starts with a Q wave — manifests a coved ST segment — and ends with disproportionately deep (considering QRS amplitude) T wave inversion.

  • The abnormally straight ST segment in lead I supports our suspicion of reciprocal change in lead aVL. It’s important to appreciate that this ST segment straightening in lead I is not normal.

  • In the Chest Leads — There is often normally slight-but-real ST segment elevation in anterior leads V2,V3. Therefore — it’s important to recognize that the ST segment straightening without any J-point elevation that we see in lead V3 of ECG #1 is not normal. Instead, in a patient with new chest pain and hyperacute inferior lead T waves — this picture that we see in lead V3 suggests associated posterior OMI until proven otherwise. In further support of our suspicion of associated posterior OMI — is that neighboring leads V4,V5 also show subtle-but-real ST segment flattening.

  • To EMPHASIZE: Many of the findings that I highlight above (which Dr. Smith instantly recognized) — are subtle indeed. But taken together — the fact that this previously healthy 36 year old woman presented to the ED with new chest pain — and knowing that there is NO way the towering, fat T wave in lead III is normal — the fact that no less than 8/12 leads show supportive findings of infero-postero OMI (even though we’ve lost the ability to assess 2 of the remaining leads = V1,V2 because of possible electrode lead misplacement) — We have to assume acute infero-postero OMI until proven otherwise.


IF Doubt Remains — Repeat the ECG!
The last important concept I will emphasize from today's case — is that IF there is any doubt about the decision to cath — repeating the ECG can often provide a definitive answer. Especially if there are ongoing symptoms (and especially if there is a change in the severity of these symptoms) — repeating the ECG (sometimes as soon as 5-10 minutes later) may demonstrate a change in ECG findings that documents dynamic ST-T wave change.
  • It’s easiest to appreciate serial ECG changes when you look lead-to-lead with both tracings next to each other (Figure-1). Although I see no significant change in the chest leads between these 2 tracings — there should be no doubt that inferior lead T waves are less voluminous in ECG #2 — and the worrisome shape of the ST segment and depth of T wave inversion in lead aVL has improved. This defines this 2nd ECG as showing dynamic ST-T wave changes — and confirms the need for prompt cath.

Figure-1: For ease of comparison — I've put together the first 2 ECGs in today's case.


==================================
P.S. As shown above in Dr. Smith’s side-by-side comparison of leads V4,V5,V6 in the 2nd ECG with the final (3rd) ECG in today’s case — this last repeat tracing (that was done 18 minutes after ECG #2, while waiting for the cath lab to get ready) — further cements our impression of “dynamic” ST-T wave changes from an acutely evolving event (ie, leads V5 and V6 in this 3rd ECG now clearly becoming more hypervoluminous!)
  • Take Home Point: Repeating the ECG will often provide the answer!
==================================


Thursday, December 22, 2022

See OMI vs. STEMI philosophy in action

by Emre Aslanger

Dr. Aslanger is our newest editorial member.  He is an interventional cardiologist in Turkey. 

Dr. Aslanger is also the author of the DIFFOCULT study:

Emre K. Aslanger,a, Özlem Yıldırımtürk,b Barış Şimşek,c Emrah Bozbeyoğlu,c Mustafa Aytek Şimşek,a Can Yücel Karabay,b Stephen W. Smith,d and Muzaffer Değertekina  

DIFOCCULT: DIagnostic accuracy oF electrocardiogram for acute coronary OCClUsion resuLTing in myocardial infarction.  International Journal of Cardiology Heart & Vasculature

Case

A 40-year-old man presents with excruciating back pain which has started 1 hour ago. His medical history is unremarkable except a similar pain occurred 4-5 times in the previous 3 months with less intensity, short duration, unrelated to exertion. He visited an outpatient clinic for it and an echocardiogram and exercise stress test was normal. He has 40 packs-year of smoking history. There was no premature cardiovascular diseases or sudden death in his family. He denies taking any medication.

On his physical examination, cardiac and pulmonary auscultation was completely normal. Peripheral pulses were all palpable. Blood pressure: 130/80 mmHg, heart rate: 45/min, respiratory rate: 18/min, SaO2: %98, body temperature: normal.

As he seemed very agitated, fentanyl and diazepam were given.   

His first electrocardiogram (ECG) is given below:


--Sinus bradycardia. 
--There are some ST-segment elevations (STE) in V2-5 and lead II, III, aVF. 
--No reciprocal ST-segment depression (STD). 
--QT is short, R wave amplitudes are preserved. 
--For subtle anterior OMI, Smith's 4-variable and Aslanger's simplified formulas both supports benign variant STE. 
--For subtle inferior OMI, there is no STD in aVL or lead I. 
--In summary, some subtle findings which do not fit into a pattern, therefore may be nonspecific ECG changes which are encountered everyday.    


As his pain was very severe, emergency physicians concerned of aortic dissection and ordered a thoracic CT scan. Bi-phasic scan showed no dissection or pulmonary embolism. Coronary arteries cannot be assessed because the scan was not gated, but proximal segments of the coronary arteries seem to be open with some contrast. 

His pain is now settled a bit, around 4/10 and first troponin turned out to be 12 ng/L (normal <14 ng/L).

A second ECG was taken:


Baseline is slightly wandering, therefore it cannot be reliably said that there is no dynamic change from the first ECG, but it seems so. 

Second troponin at 1h comes 20 ng/L. It is above normal limit and there is a significant change

A third ECG and troponin was planned. 

In the meantime, cardiology consultant sees the patient and performs a bedside echocardiogram which revealed no major wall motion abnormalities

Nevertheless, the back pain is still ongoing, he orders another ECG:


Still the same suspicious STEs, but they did not change from the previous ECGs and also do not easily fit into any coronary localization. 
But there is a suspicious new finding here: Is there a new Q wave in lead III ? Or it is due to a slight axis change? Again nothing diagnostic.  

With ongoing pain, without any clinical evidence of OMI, cardiologist thinks NSTEMI and admits the patient to the step 1 coronary care unit.

His ECG on arrival to the CCU:

This ECG was taken with a different machine but there seems to be one dynamic change: There is T wave inversion in lead III and Q wave is still there. This is a very subtle change but cannot be anything other than an acute coronary event. The pain is still ongoing, therefore cath lab is activated.


Cath lab was not activated because we diagnosed a "high risk" NSTEMI; rather, it was because we suspected, actively searched for, and could not refute an OMI that needs to be immediately reperfused. 

Here is the coronary angiogram:

A distal thrombotic right coronary artery (RCA) occlusion ! A significant amount of thrombotic material was aspirated by manual thrombectomy (see below for aspirated thrombi). 

Aspirated thrombotic material. 


The lesion was successfully stented. Here is the post-intervention angiogram and post-PCI ECG. The pain was completely resolved after coronary intervention. 


Take home messages:

1- In STEMI/NSTEMI paradigm you search for STE on ECG. In OMI/NOMI paradigm you search a clue for acute coronary occlusion (ACO). If this patient was managed according to the STEMI/NSTEMI paradigm (although he would be a candidate for early invasive treatment), he would probably be taken to the cath lab hours later. In these golden hours, a majority of the salvageable myocardium would be lost. With OMI/NOMI approach we actively search for an ACO and used conventional angiogram to prove our suspicion even if there was no striking diagnostic clues at hand.

2-A subtle ECG does not mean a subtle pathology. This is a complete coronary occlusion with a good vessel caliber. 


References

1. Aslanger EK, Meyers HP, Smith SW. Recognizing electrocardiographically subtle occlusion myocardial infarction and differentiating it from mimics: Ten steps to or away from cath lab. Turk Kardiyol Dern Ars. 2021 Sep;49(6):488-500. doi: 10.5543/tkda.2021.21026.


==================================
Comment by KEN GRAUER, MD (12/22/2022):
==================================
Brilliant post by Dr. Aslanger — with emphatic illustration of "the difference in OMI vs STEMI philosophy" — in action! 
  • To highlight the subtle ECG change Dr. Aslanger points out in lead III in the 4th tracing — I thought it helpful to magnify and compare the limb leads from that tracing, with the tracing recorded before this ECG change (Figure-1).

As per Dr. Aslanger — there is a subtle, but very important change in lead III of ECG #4 — in that despite no change in the frontal plane axis, the T wave in lead III is now indisputably inverted
  • The same small (but significant) Q wave in lead III remains (as do small Q waves in the other 2 inferior leads) — and the ST segment in lead III manifests coving prior to ending with T wave inversion. 

But aren't there other new ST-T wave changes in
 ECG #4


Figure-1: I've magnified and compared the 3rd and 4th set of limb leads in today's case. How many leads show subtle differences?


Subtle Changes in Other Leads:
Dr. Aslanger emphasizes the importance of clinical context! In a patient with ongoing, severe chest pain — the subtle-but-real ST-T wave changes are "dynamic" indication of an ongoing acute cardiac event — therefore prompting the need for cardiac cath!
  • Often with serial ECG changes — there will be 1 or 2 leads that "stand out" for being definitely different! I look for those first. It becomes easier to recognize more subtle changes in other neighboring leads once you identify the leads that are definitely abnormal.
  • Isn't the "magic" mirror-image opposite relationship between lead III and lead aVL maintained when comparing the 2 tracings in Figure-1? Although assessment of lead aVL is challenging, given the tiny size of the QRS complex in this lead — I thought the flat ST segment with tiny positive T wave in ECG #3 — has been replaced in ECG #4 by a hyperacute ST-T wave that is the mirror-image opposite of the ST-T wave that is now seen in lead III.

  • There are subtle differences in the other 2 inferior leads — as the small-but-upright T wave in lead aVF is now ever-so-slightly inverted — and — the ST-T wave in lead II is now clearly more flattened.

  • Finally — the T wave in lead I is more voluminous than it was in ECG #3.

  • To EMPHASIZE: The changes I describe for leads I, II and aVF are so subtle — that by themselves, I would never be confident they were "real". But in the context of ongoing severe cardiac chest pain — in which a definite "dynamic" ST-T wave change can be seen in both leads III and aVL of ECG #4 — these more subtle findings in the remaining limb leads are doubtlessly real!

Our appreciation to Dr. Aslanger for his brilliant demonstration of how OMI philosophy differs in practice from the previous (and now outdated) STEMI paradigm.


Sunday, December 18, 2022

A young patient with diminishing pain with a subtle but diagnostic ECG.

Written by Emre Aslanger

(Emre is our newest editor.  He is an interventionalist in Turkey and one of 3 originators of the OMI/NOMI paradigm, along with Pendell and Smith.  Here are his publications.)

Case

A 39-year-old male without prior medical history presents with chest pain that started 2 hours prior to presentation. He says that the pain intensity was 10/10 at home but now about 4/10. His medical exam is unremarkable. He has no cardiovascular risk factors except smoking for 10 pack-years. He denies any illicit drug use. His ECG is shown below.  

What do you think ?


Although not striking, this is clearly a diagnostic ECG for infero"posterior" myocardial infarction due to coronary occlusion (OMI), most likely due to left circumflex (LCx) artery occlusion. There is clear ST-segment depression in V2-5, which peaks around V4. The morphology in V2 is especially concerning for a reciprocal change to "posterior" ST-segment elevation (STE). There is also subtle STE in inferior leads, with hyperacute T-waves and accompanying Q waves in lead II and aVF. Lead III has a fractioned QRS complex. These all are highly unlikely to be seen in a 39-year-old man without previous cardiac history.   

Emergency physician doubts the diagnosis and wants to see another ECG with posterior leads. It is given below. The patient is highly stable and says his pain is now around 2/10. What would you do ?


Leads V4-6 here are actually V7-9. It is a good custom to write it on the paper as soon as the printout is acquired. Afterwards nobody can reliably guess what these leads actually are. Another suggestion is to keep V1-3 in place (here it seems that V1-3 are actually V4-6), as they show the greatest amount of ST depression and keeping them on the new ECG might ensure that STD in these leads did not disappear. If STD resolves at the time of the posterior ECG, it might be another reason for its false negativity. 

Here, there is STE in lead V8 and V9. It may be less than 1 mm but it is defined as at least 0.5 mm STE even in the fourth universal definition of myocardial infarction. However, we tend to assess it visually and STE is clearly there.  

Despite the clinical stability and decreasing pain, this patient needs an immediate angiogram. Chest pain may decrease due to multiple factors even if the artery is still occluded. I personally believe that among chest pain, ECG and troponin; the most reliable one is ECG. 

Another important pearl is that: Do not assume that a subtle ECG means a subtle MI. 

The patient was given 300 mg po acetylsalicylic acid, 180 mg ticagrelor and taken to the cath lab. 

Here is his angiogram:  
This shot shows that the left circumflex (LCx) is occluded at the ostium (origin).  This is seen just millimeters beyond the tip of the catheter.

Compare to the anatomy after stenting:
The lower of the 2 now easily seen branches is the circumflex, now with excellent flow.


The patient recovered well. His peak troponin was over 5000 ng/L. Next day echocardiogram showed inferolateral hypokinesia with an EF of %45-50. 


If you still have not read it, I strongly recommend that you read the following article on the diagnosis of "posterior" MI: Ischemic ST-Segment Depression Maximal in V1-V4 (Versus V5-V6) of Any Amplitude Is Specific for Occlusion Myocardial Infarction (Versus Nonocclusive Ischemia), by Meyers HP et al.

Here is the link:
  
Note that the artery is still occluded, no visible collaterals are present (in other images), but the pain is diminished. Always remember that the pain is not so reliable if the ECG is clear.


A small note on "posterior MI":
You might have encountered the discussion about the naming of "posterior" MI. In the newer literature, it is usually called "lateral" MI, but "posterior" MI is also still in widespread use.

This appears to stem from using different coordinate frames interchangeably: one based on myocardial segments the other based on the lead locations on the chest wall.


The current consensus proposed by the American Heart Association divides the LV into 17-segments (basal-, mid-, apical- anterior; basal-, mid-anteroseptum; basal-, mid-inferoseptum; apical septum; basal-, mid-, apical- inferior; basal-, mid-anterolateral; basal-, mid-inferolateral; apical lateral and apex). Many entities like “posterior MI” or “high-lateral MI” are still in use despite no LV segment bears these names. These names are a legacy of the second coordinate system, lead positions on the thoracic cavity. Indeed, the term “posterior MI” has such a historical connection. Since the LV diaphragmatic wall is opposed to the anterior wall, it has been first called as “posterior”. Later, a specific infarction entity that can be recognized using “posterior leads” or their anterior reflections (such as the presence of an R/S ratio >1 or an R-wave duration >40 milliseconds in lead V1) linked to the basal part of this wall. The term "true" posterior was coined for denoting that only the basal part of this wall curves upwards and truly constitutes a posterior structure. The remaining part named as inferior wall. Several later studies indicated that many patients do not have such a posteriorly curving wall. Cardiac magnetic resonance (CMR) studies indicated that these findings actually indicate MI of the inferolateral segments.

I believe that the nomenclature for the definition of MI should be based on the myocardium itself. However, I accept that many people may think the otherwise.

But if you choose to use this second approach, please be aware that "posterior" here means "the infarct diagnosed by ST depression in leads V1-V4 or by the "posterior" leads" not "the infarct of the myocardial wall just opposite to anterior wall". On echocardiogram you will not see a "posterior" hypokinesia (will see "inferolateral") and, as in this case, LCx may not give the blood supply of basal inferior segment (formerly called "posterior").

This may seem a bit detail but predicting the location of the culprit lesion from ECG may help interventionalists in the selection of guiding catheters, spotting the real culprit when multiple culprit-looking lesions are found on angiogram and decision making for revascularization strategies. Moreover, in addition to the extent of the infarcted myocardium being the single most important determinant of long-term prognosis, the involvement of specific left ventricular (LV) segments may also promote a vigilant search for associated complications. For example, mid-anterolateral and mid-inferior segments generally harbor papillary muscles and infarction of these segments may result in acute mitral regurgitation due to papillary muscle dysfunction or rupture. Post-myocardial infarction (MI) ventricular septal defects are frequently seen in mid-anteroseptal and apical septal segments, whereas apex and the basal inferior segment are prone to aneurysm formation.

These being said, the most important thing in this clinical situation is to diagnose OMI, whatever you call it.


Take home messages: 

- Never doubt your diagnosis when ECG is clear.
- A subtle ECG does not mean a subtle MI, especially in LCx territory.
- When taking a posterior ECG, keep leads V1-3 in place
- Posterior leads may be false negative, when V1-4 are diagnostic, do not use them to exclude "posterior" MI. 
- You may choose to say whatever you like, "posterior" or "inferolateral" MI, as long as you know how to diagnose and deal with it.
   

References:

1. Meyers HP, Bracey A, Lee D, Lichtenheld A, Li WJ, Singer DD, Rollins Z, Kane JA, Dodd KW, Meyers KE, Shroff GR, Singer AJ, Smith SW. Ischemic ST-Segment Depression Maximal in V1-V4 (Versus V5-V6) of Any Amplitude Is Specific for Occlusion Myocardial Infarction (Versus Nonocclusive Ischemia). J Am Heart Assoc. 2021 Dec 7;10(23):e022866. doi: 10.1161/JAHA.121.022866. Epub 2021 Nov 15. PMID: 34775811; PMCID: PMC9075358.

2. Aslanger EK. Considerations on the naming of myocardial infarctions. J Electrocardiol. 2022 Mar-Apr;71:44-46. doi: 10.1016/j.jelectrocard.2022.01.006. Epub 2022 Jan 31. PMID: 35124348.

3. Cerqueira MD, Weissman NJ, Dilsizian V, Jacobs AK, Kaul S, Laskey WK, Pennell DJ, Rumberger JA, Ryan T, Verani MS; American Heart Association Writing Group on Myocardial Segmentation and Registration for Cardiac Imaging. Standardized myocardial segmentation and nomenclature for tomographic imaging of the heart. A statement for healthcare professionals from the Cardiac Imaging Committee of the Council on Clinical Cardiology of the American Heart Association. Circulation 2002; 105(4): 539-42.


==================================
Comment by KEN GRAUER, MD (12/18/2022):
==================================
Important case with numerous diagnostic Pearls presented by Dr. Aslanger. I'd add the following thoughts to his excellent presentation.
  • We've presented numerous cases of acute posterior OMI that have been initially (and sometimes permanently) overlooked — because "there is no ST elevation". By definition — there won't be "ST elevation" in the standard 12 lead ECG with acute posterior OMI. As per Dr. Aslanger and his citation of the J Am Heart Assoc article by Meyers, Smith et al — posterior leads are not needed for the diagnosis of acute posterior OMI!

  • More than this — posterior leads that fail to show ST elevation may provide false reassurance (Please see My Comment at the bottom of the page in the September 21, 2022 post in Dr. Smith's ECG Blog)Failure of posterior leads to consistently demonstrate ST elevation in association with subtle posterior OMI — should not be surprising. This is because posterior placement of leads V7, V8 and V9 situates these leads in a position from which electrical activity must pass through the thick musculature of the back before being recorded on the ECG. As a result — even under optimal circumstances, QRST amplitudes (and therefore the amount of ST-T wave elevation) in posterior leads is often modest.

  • As per Dr. Aslanger — it is essential when using additional monitoring leads to specify in writing on the actual ECG which leads are being used. In today's 2nd tracing — I guessed that leads V4,V5,V6 were replaced by posterior leads V7,V8,V9 — but I had no idea that leads V1,V2,V3 were replaced by leads V4,V5,V6. When one considers that 1 or more right-sided leads might also be ordered in addition to (instead of) posterior leads — the number of possible lead switches that might be made is numerous.

  • PEARL #1: I would strongly suggest that when posterior leads V7,V8,V9 are recorded (and substituted for leads V4,V5,V6) — that a 2nd ECG with the standard 12 leads is also recorded! This is an especially important suggestion for those clinicians who obtain posterior leads for the sole purpose of "convincing the cardiologist that there is ST elevation!" As noted above, even in the best of circumstances — the relative amount of ST elevation in posterior leads is modest compared to the amount of ST depression in anterior leads. I have seen cases when 10-15 minutes after the initial ECG, a 2nd ECG is obtained in which leads V7,V8,V9 are substituted for V4,V5,V6 — and because of spontaneous reperfusion that was evident only in leads V4,V5 (which were omitted on the repeat tracing, being replaced by posterior leads) — this spontaneous reperfusion was not recognized! (and as a result — posterior leads no longer showed any ST elevation).


PEARL #2: Several lead electrodes in ECG #1 are malpositioned ...
As we've shown many times on Dr. Smith's ECG Blog — too-high placement of the V1,V2 electrode leads is disturbingly common (Please see My Comment at the bottom of the page in the April 17, 2022 post and in the November 4, 2018 post in Dr. Smith's ECG Blog)

KEY Point: Suspect that leads V1 and/or V2 have been placed 1 or 2 interspaces too high on the chest — IF one or more of the following clues are present:
  • CLUE #1 — If there is an r’ in leads V1 and/or V2, especially if the other finding for incomplete RBBB (ie, terminal s waves in lateral leads I and V6) is absent.
  • CLUE #2 — If there is a significant negative component to the P wave in lead V1 and/or V2.
  • CLUE #3 — If the appearance of the QRS complex and the ST-T wave in leads V1 and V2 looks very much like the QRS and ST-T wave in lead aVR.

Note that in the initial ECG from today's case (which I have reproduced in Figure-1) — all of the above 3 Clues are present, which strongly suggests that leads V1 and V2 are malpositioned.
  • In addition — Morphology of the QRS complex and ST-T wave of lead V3 does not make physiologic sense in ECG #1, considering the relative size and shape of the QRST complex in neighboring leads V2 and V4.

  • KEY Point: Given that the treating clinician in today's case was uncertain enough about the diagnosis of acute OMI, that he/she felt the need to repeat the ECG with posterior leads — the fact that the V1, V2 and V3 electrode leads are almost certainly malpositioned should have prompted immediate repeat of the standard 12-lead ECG after verifying lead placement.

Our THANKS to Dr. Aslanger for presenting today's case!


Figure-1: I've reproduced the initial ECG in today's case.


A woman in her 70s with chest pain

 Submitted and written by Quinton Nannet, MD, peer reviewed by Meyers, Grauer, Smith


A woman in her 70s recently diagnosed with COVID was brought in by EMS after she experienced acute onset sharp midsternal chest pain without radiation or dyspnea. She felt nauseous and lightheaded with no neurologic deficits. EMS noted prehospital vitals for heart rates in the 60s, SPO2 of 98% on room air, initially hypotensive to 66/34 with improvement to 100/70 after 800 mL of IV fluids by EMS.  Here is her ECG on arrival to the ED:


What is your differential? What are your next steps?


The ECG is quickly reviewed and shows sinus rhythm with normal QRS complexes. There is ST depression in leads V3-V6, I, aVL, II, III, and aVF, with ST elevation in aVR. Importantly, there is also STE in aVL, as well as V1. The differential is:

Posterolateral OMI or subendocardial ischemia


The distinction between posterior OMI and subendocardial ischemia can be important and sometimes difficult. Usually, ST depression proportionally maximal in V1-V4 indicates posterior OMI, whereas ST depression maximal in V5-V6 (with similar STD in II and reciprocal STE in aVR) indicates subendocardial ischemia. In posterior OMI, the STD in V4 improves significantly or resolves completely from V4 to V6; whereas, in subendocardial ischemia, the STD persists in severity or worsens from V4 to V6.

STD/R wave ratios:

V3: 2.5 / 16.5 = 15%

V4: 2.0 / 11.0 = 18%

V5: 0.5 / 5 = 10%, or perhaps it is closer to 0.75 / 5 = 15%

V6: 0.5 / 3 = 17%

So this is a difficult one, as the STD may be objectively maximal in V4, but still persists from V4 to V6. The STE in aVL should probably be considered lateral OMI until proven otherwise (thus also making posterior OMI more likely), but in subendocardial ischemia the leads with upward/superior components (aVR, V1, aVL) can all show reciprocal STE from the diffuse downward and leftward STD.


Her prior ECG on file is shown below: 


What are your next steps?

Do you activate the Cath Lab?


Given her still undifferentiated hypotension, a RUSH exam was performed. It was notable for a normal cardiac ultrasound with no pericardial fluid, normal LV and RV function (though the quality was not sufficient to evaluate for wall motion abnormalities) and normal IVC dynamics.  There was no free fluid noted in the thorax, right upper quadrant, left upper quadrant, or retrovesicular views.  The probe was then moved to the aorta.


A dissection flap is noted in the intrabdominal aorta, and the aortic outflow tract is also noted to appear wider than normal. She was taken immediately for a CT angiogram of the chest, abdomen and pelvis.


Type A Axial.mov from Pendell Meyers on Vimeo.


The CT angio showed a type A aortic dissection extending from the aortic root proximally to the carotid and left subclavian artery and distally to the common femoral arteries. Cardiothoracic and vascular surgery were consulted and the patient was taken to the OR within an hour and a half of her arrival to the ED.  Intraoperative TEE noted "Type A aortic dissection arising 1.0 cm distal to the non-coronary cusp of the aortic valve." The operative report and radiology reads do not comment specifically as to whether the dissection flap was partially or fully obstructing coronary flow, or whether it was obstructing the left main or the RCA. She was noted to have a blood-tinged pericardial effusion.  Her dissection was repaired and her aortic valve was resuspended.  On postop day 1 she was extubated and the following ECG was obtained:


Resolution of STD, and no obvious posterolateral reperfusion findings.


Her initial ED high sensitivity troponin was less than 6ng/L (below limit of detection), and none further were ordered.


Intraoperative TEE (before intervention) showed:

Normal LV size and thickness

Normal systolic function with EF 60%

No segmental wall motion abnormalities

Normal RV function

Aortic dissection false lumen prolapses into the aortic valve creating severe aortic valve insufficiency, 3-4+ aortic regurgitation


The patient progressed well throughout her hospital stay and was discharged on post-op day 6. Wonderfully, she has returned to her normal life with no significant co-morbidities from her dissection.


Learning Points:

The ECG is always just one piece of the clinical puzzle. Bedside ultrasound is another very important piece. It worthwhile to perform ultrasound on all chest pain patients, but particularly if there are any hemodynamic signs.

Ischemic ST depression includes posterior OMI and subendocardial ischemia. In the context of ACS, ST depression maximal in V1-4 has been shown to be fairly specific for posterior OMI. Usually the STD of posterior OMI improves and resolves from V4 to V6, whereas subendocardial ischemia STD typically persists or worsens from V4 to V6.

STD maximal in V5-6 and lead II, with reciprocal STE in aVR, typically indicates global supply/demand mismatch subendocardial ischemia, which can be due to a huge variety of clinical causes, including life-threatening ACS.

Ultrasound can be very helpful to distinguish causes of hypotension. Sometimes a dissection flap can be seen using bedside ultrasound.


Further Reading:

http://hqmeded-ecg.blogspot.com/2012/02/five-primary-patterns-of-ischemic-st.html


See these relevant cases:

A man in his 50s with acute chest pain and diffuse ST depression


==================================
Comment by KEN GRAUER, MD (12/18/2022):
==================================
I thought the initial ECG in today's case (which I've reproduced in Figure-1) — to be "eye-catching". I focus my comment on why I thought so.

  • To Emphasize: The presentation by Drs. Nannet and Meyers is complete and superb. It clearly covers all KEY educational points.


Why I Found ECG #1 to be "EYE-Catching"
It's hard not to find your eyes being immediately drawn to the QRST complex in lead V3. The QRS complex in this lead is by far the largest — and — the amount of J-point depression and size of the inverted ST-T wave is greatest. These findings are all the more striking when compared to neighboring leads V1 and V2, in which the QRST complex is tiny.
  • My initial impression was that something must be "off". But nothing was off — and lead placement was correct (verified by nearly-identical looking leads V1 and V2 on the prior tracing in the chart). 
  • The other "eye-catching" lead in ECG #1 was lead V4. While not quite as large as the complex in lead V3 — QRS amplitude, and ST-T wave size was clearly much greater than that seen in the other 10 leads.

  • That said, as per Drs. Nannet and Meyers — there is ST-T wave depression in 8/12 leads, with the relative amount of ST-T wave deviation being comparable in each of these 8 leads when one considers the relative differences in QRS amplitudes!
  • In the remaining leads — there is worrisome ST elevation in aVRaVL and V1 — with a hint of ST coving (if not slight elevation) in lead V2.

We are told that the history in today's case — is that of a woman in her 70s with recently diagnosed COVID — who presented with new chest pain and marked hypotension — but no dyspnea.
  • BUT — If I had not been given this history — My differential diagnosis on seeing this tracing would clearly be expanded. In addition to the 2 principal considerations put forth by Drs. Nannet and Meyers ( = acute posterolateral OMI and diffuse subendocardial ischemia) — I would add myocarditis (since the patient has newly diagnosed COVID) — acute PE (since there is worrisome-looking ST-T depression in the inferior and mid-chest leads) — and some form of multi-vessel coronary disease (given how hard-pressed I felt trying to explain all the ST-T wave depression in the face of worrisome-looking ST elevation in leads aVL and V1).
  • To the above (especially given this patient's age) — I'd add Takotsubo cardiomyopathy, given at least slight QTc prolongation and the unusual distribution and magnitude of ST-T wave deviations.
  • And — I wondered if the net positive tiny QRS in lead V1 represent a new or old finding related to incomplete RBBB vs posterior infarction.

BOTTOM Line: 
  • Credit to the treating clinicians — as this case was solved in large part due to the tip-off provided by bedside ultrasound that did not stop with the cardiac exam, but which continued to assess the aorta.

  • PEARL: We think of diffuse subendocardial ischemia as being characterized by ST depression in multiple leads with ST elevation in lead aVR. But as per Drs. Nannet and Meyers — ST elevation may also sometimes be seen in leads aVL and V1 with this entity!

  • The patient made a complete recovery thanks to quick actions by the treating clinicians — with successful surgical repair of her aortic dissection.

  • In retrospect — all ECG findings in the "eye-catching" initial tracing were explained. Diffuse ST-T wave depression on the initial tracing was the result of shock from the patient's aortic dissection. Considering reduced QRS amplitudes — the relative amount of ST-T wave depression was comparable in the 8 leads that showed this finding. ST elevation in leads aVR, aVL and V1 was part of this ECG presentation of diffuse subendocardial ischemia. The tiny positive QRS complex in lead V1 was longstanding. And following surgical repair — ST-T wave changes for the most part resolved — and the final ECG was no longer "eye-catching"!

Figure-1: I've reproduced the initial ECG in today's case.