Monday, August 30, 2021

Some ECG simply require pattern recognition, followed by a bit of investigation

Brooks Walsh @BrooksWalsh helped with this post 

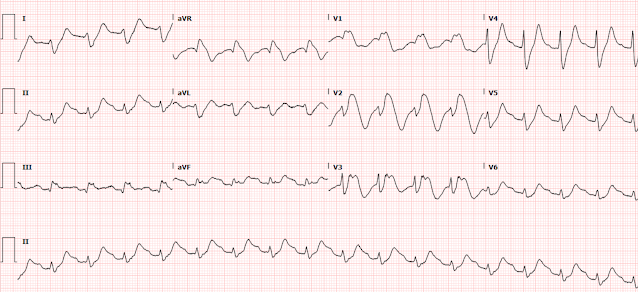
One of my partners showed me this series of ECGs, without any info:


I said: "It's a normal variant.  Young black male, right?"

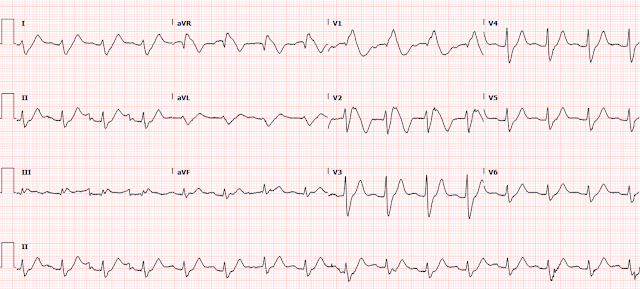
He said, "Yes, but look at this one recorded 2 hours later. It is different":

There is T-wave inversion in V4 that was not there before.

I said: "Yes, small changes can happen even with normal variants."  And there might be a slight difference in lead placement.  On the 2nd ECG, V4 is farther to the right -- notice there is more S-wave than on the first and the R/S ratio is smaller.   


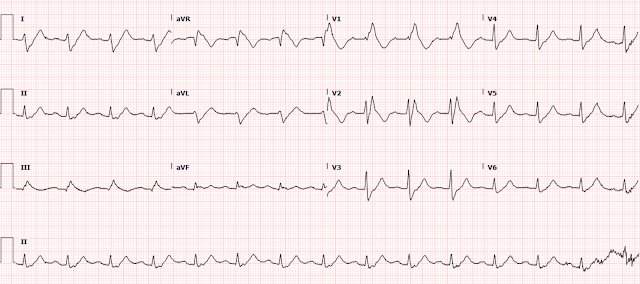
There was also a 3rd ECG at 3.5 hours:

Same issue here: V4 is even farther right, and R/S ratio = 1


I said "So tell me about the patient.  Chest pain?  Young black male?"

"Yes, 33 yo black male with acute chest pain."

Then I said, "I would just rule him out with troponins."

He said: "He had 2 hs troponin I less than 4 ng/L."

I said, "Then that is all you need."

He said, "Well, I called cardiology and got a formal echocardiogram.  It was totally normal.  How did you know?"

I said, "First, there is very high voltage, probably because he has thin chest wall and, second, I recognize this morphology.  Some things simply require pattern recognition."

Comments 

 T-wave inversion, with or without ST Elevation, in young black males, especially athletes, is very complicated, but not so much because it mimics ACS, but because it is difficult to ascertain if the ECG represents Hypertrophic Cardiomyopathy.

If the patient presents with chest pain, and MI/ACS is the main concern, then you can recognize these patterns as NOT due to ACS.  The patient then does NOT need further ED workup.

If the patient presents with syncope, then HOCM, or even Arrhythmogenic Right Ventricular Cardiomyopathy (ARVC) is on the differential and it becomes much more difficult to differentiate the benign forms from HOCM, and an echocardiogram may be necessary, and may even be necessary before sending the patient home.  Perhaps a POCUS cardiac ultrasound is sufficient, if the operator/interpreter knows what he/she is doing.

Here is a post/lecture on Benign T-wave Inversion, with several example ECGs: http://hqmeded-ecg.blogspot.com/2012/03/benign-t-wave-inversion.html

Here is an article that Brooks and I wrote, along with Peter MacFarlane:

Distinctive ECG patterns in healthy black adults.  

Full text manuscript:   https://eprints.gla.ac.uk/189824/7/189824.pdf

The below quote is from this article:

Electrocardiographic anterior T-wave inversion in athletes of different ethnicities: differential diagnosis between athlete's heart and cardiomyopathy

Here is full text (images at this article are worth viewing)

"Older studies found that anterior TWI was found in 3%–10% of black Africans or African Americans [30,40,65,67], but not in white subjects [65]. More contemporary literature finds that anterior TWI can be found in 4.2% of healthy, non-athletic black males [82]. By contrast, anterior TWI is seen in only 1.9% of white male athletes [82], and rarely extends
past V2 [83]. The prevalence in non-athletic middle aged white men is even lower (0.5%) [72]. Similarly, this pattern is found in 14% of black European female athletes, but only 2% of white female athletes [71].This pattern was found in over 12% of black European male athletes [82], and is recognized as a benign feature in the black athlete [84]. This may be true in athletes of any race: one study has demonstrated that the combination of J point elevation N0.1mV and TWI limited to V1-4 ruled out arrhythmogenic right ventricular cardiomyopathy and hypertrophic cardiomyopathy, regardless of ethnicity [85]. In the absence of J point elevation, HCM or ARVC must still be considered. The literature hasn't
specifically addressed whether this pattern of anterior TWI with J-point elevation can be presumed benign in non-athletes, black or white."


Notice that there is not only T-wave inversion, but also some J-point elevation.  These authors are of the opinion that, if there is no J-point elevation, one must not interpret "benign" until HOCM is ruled out with ultrasound

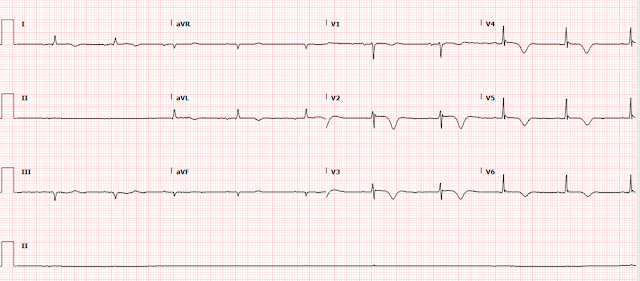
Below are 2 representative tracings from HOCM patients. Note that there is no J-point elevation.  However, I believe these are very different from our patient because there is poor R-wave progression.  Our patient above has very well formed R-waves (and S-waves) in V3 and V4.


Bottom line:

If chest pain, recognize this pattern as NOT OMI and NOT Wellens'.  Do get serial troponins to rule out Non-OMI.

If syncope, beware HOCM, and much less commonly, ARVC.


Friday, August 27, 2021

Wide and weird

Written by Clare Gunn MD, peer reviewed by Smith, Meyers, Bracey


A 74-year-old female presented to the ER after a trip and fall (unclear if purely mechanical or due to possible unsteadiness) causing her to cut her leg. Due to chronic anticoagulation for atrial fibrillation, she could not stop the bleeding, so she came the ED.  On arrival she is found to be hypoxemic requiring four liters of oxygen via nasal cannula. While getting her leg wound repaired, the patient was also evaluated for hypoxemia and tachycardia and was found to have this ECG:


What do you think?


Here was her most recent prior ECG on file for comparison:

RBBB at baseline.


EKG interpretation:

Wide complex regular tachydysrhythmia at around 100 bpm

Very wide and bizarre QRS morphology, very difficult to precisely figure out where the QRS ends, but my guess is that the QRS is about 200 msec in width. It does have a RBBB configuration, with a large upright QRS in V1 and a wide S-wave in V6. This suggests that the known baseline RBBB is further distorted by additional pathology. Computer QRS duration was 189 msec.

For this highly bizarre QRS complex, there are similarly bizarre ST segments and T waves. In some leads there is a sine wave appearance.

The rhythm is not totally clear. The differential includes sinus or accelerated junctional rhythm with massive conduction aberrancy. I do not think there is any definite atrial activity that can be seen. VT by definition cannot be 100 bpm or lower, and is only very rarely as slow as 120 bpm. 

I texted this ECG to Dr. Smith without any clinical information and without the previous ECG, and he immediately texted back: "HyperK, or Na channel blocker such as TCA or Flecainide."

The most common cause of a QRS this wide and weird would of course be hyperkalemia. But the second most common cause is sodium channel blocker toxicity, which can be seen in many tox syndromes, for example tricyclic antidepressants, diphenhydramine, and drugs intentionally designed to block Na channels such as flecainide, procainamide, etc. Conduction abnormalities due to hyperkalemia or drug toxicity will often cause ST elevation (as in V1-V3 in this case) which the computer may report as "STEMI."  It is necessary to instantly recognize that the bizarre features of the QRS complex, including the STE, are related to a metabolic process and not OMI in order to avoid early diagnostic closure.


Impression:

This ECG is highly concerning for hyperkalemia or sodium channel blocker toxicity. Since the heart rate is only barely above 100 bpm, the exact rhythm in this case is not as important as understanding that the QRS is acutely widened by toxicologic/metabolic causes.


Case continued:

The ED provider was appropriately concerned for hyperkalemia first, and promptly gave the patient 2 grams of calcium gluconate with minimal change in her ECG (Meyers side note: 2 grams of calcium gluconate may not be enough calcium to see obvious QRS narrowing in all cases of hyperK! More will not hurt, and in some cases much more will be required before proving that it isn't hyperK). When her lab work resulted, her potassium was only 5.3 but she was noted to have a newly elevated creatinine at 2.2. Further review of the EMR demonstrated that the patient was prescribed flecainide for atrial fibrillation and had recently had her dose increased significantly. Toxicology and cardiology were consulted, and the patient was determined to have flecainide toxicity likely related to her acute kidney injury and increased dose. She was given several boluses and a drip of sodium bicarbonate, but did not seem to immediately respond. She was admitted to the ICU for close monitoring.

The ICU notes describe a sudden change in her rhythm, in which there was still wide complex regular tachycardia, but the ventricular rate rose to 140 bpm. They interpreted this as likely ventricular tachycardia, did not record an ECG of it, and decided to synchronized cardiovert. Following cardioversion attempt, they state that the heart rate went back down to around 100-110 bpm. 

Her QRS slowly narrowed over the course of several days.

Here is  her ECG approximately one day later:

Computer QRS duration = 204 msec (I think it is less than that)

Day 2:

Computer QRS duration = 164 msec (I think its a bit longer)

Computer QRS duration = 189 msec, but obviously the morphology is improving 


She was ultimately discharged to rehab with no further anti-arrhythmic therapy. Below is her ECG one week later:

Computer QRS duration = 138 msec


Learning points

QRS widening is the result of either (or both) physical or chemical aberrancy of the action potential propagation, compared to normal using a normal Purkinje conduction system. Physical aberrancy includes bundle branch blocks, nonspecific intraventricular conduction delays, cardiomyopathies, bypassing of the conduction system such as paced rhythm, etc. "Chemical" aberrancy involves a slower speed of action potential propagation, such as hyperkalemia or sodium channel blockade. Every wide QRS complex must have at least one of these components to explain why it is wide.


Any RBBB that has a QRS duration longer than 170 ms is likely due to an additional QRS lengthening pathology:

Is This a Simple Right Bundle Branch Block?


Flecainide, the culprit drug in this case, is a Class 1C antiarrhythmic that functions by blocking the fast inward sodium channels that are open during phase zero depolarization of the cardiac myocytes and His-Perkinje system. This results in prolonged depolarization and slowed conduction. Flecainide also acts on inward potassium channels affecting the refractory period of cardiac cells making it well suited for its roll in preventing tachydysrhythmias like atrial fibrillation and other SVT’s.

Flecainide is renally cleared and acute or chronic kidney injury can increase plasma levels of the drug. Toxicity is often recognized in patients due to their bizarre ECGs. Patients will have wide QRS complexes, prolonged PR intervals and prolonged QT’s. Goals of treatment of flecainide toxicity include the management of airway, breathing, and circulation in critically ill patients, avoiding further blockade of sodium channels and prevention of arrhythmic events. Early and aggressive administration of sodium bicarb can help overcome sodium channel blockade and lipid emulsion has been used in cases of severe overdose. There does not appear to be a role for hemodialysis at this point. Early involvement of a poison center or toxicologist is recommended for severe cases.

Having a broad differential for any ECG that is handed to you is important. Treating this patient for assumed hyperkalemia is safe and would have been lifesaving if the bizarre morphology above had been caused by elevated potassium levels but don’t forget to check your patient’s medication list for medications like Flecainide that cause sodium channel blockade as they can also produce strange QRS morphologies at therapeutic and especially in toxic doses.


References


Smith A, Gerasimon G. An electrocardiographic series of flecainide toxicity. Indian Pacing Electrophysiol J. 2019 Mar-Apr;19(2):75-78. doi: 10.1016/j.ipej.2018.11.012. Epub 2018 Nov 28. PMID: 30502382; PMCID: PMC6450827.


Mazer-Amirshahi M, & Nelson L.S. (2019). Antidysrhythmics. Nelson L.S., & Howland M, & Lewin N.A., & Smith S.W., & Goldfrank L.R., & Hoffman R.S.(Eds.), Goldfrank's Toxicologic Emergencies, 11e. McGraw Hill. https://accessemergencymedicine-mhmedical-com.libproxy.lib.unc.edu/content.aspx?bookid=2569&sectionid=210273423


Joshua M. Newson, Cynthia D. Santos, Bradford L. Walters, Brett R. Todd,

The Case of Flecainide Toxicity: What to Look for and How to Treat,

The Journal of Emergency Medicine,Volume 59, Issue 2, 2020, Pages e43-e47,

ISSN 0736-4679,

https://doi.org/10.1016/j.jemermed.2020.04.052.

(https://www.sciencedirect.com/science/article/pii/S0736467920303905)


Other cases from this blog:

Here, Flecainide toxicity mimics anterior OMI:

Right Bundle Branch Block with New Anterior ST elevation 


Here, Flecainide toxicity in the setting of ventricular paced rhythm mimics hyperK:

Weakness and Dyspnea with a Sine Wave. It's not what you think!


Finally, a fascinating case of the odd aspect of"use dependence" with flecainide toxicity: it's effect on the QRS is often dependent on the heart rate.

Note how the QRS gets wider when the HR gets higher:


Wednesday, August 25, 2021

ST Depression Seen While scrolling through ECGs -- What is it?

This is a good one for residents and students! 


I was reading ECGs on the system and saw this one.

What do you think?
When I subsequently went into the chart, what do you think I was looking for?


This ECG is all but diagnostic for Digoxin effect.  There is atrial fibrillation, which explains why the patient would be prescribed Digoxin.  There is scooped ST depression in multiple leads, nearly pathognomonic of Digoxin, and the ST depression in accompanied by a short QT interval.

So to confirm, I went to the chart and, sure enough, he was on digoxin.  

These findings are seen at therapeutic levels. The ECG findings are not suggestive of digoxin toxicity.  

Then I realized that this patient was in triage, complaining of weakness. 

I ordered a chem panel and a digoxin level.  The creatinine returned elevated, raising suspicion of digoxin toxicity (as it is cleared renally), but the digoxin level returned at a therapeutic level.

In the setting of a normal QRS (no LBBB, no LVH, no RVH, no RBBB, no WPW), ST depression is a result of 4 categories:

1. Ischemia (Subendocardial or reciprocal to STE elsewhere -- including V1-V4, reciprocal to the posterior wall)

2. Hypokalemia

3. Digoxin

4. Benign baseline

Only Digoxin has a short QT interval


See other cases of Digoxin effect here: 

http://hqmeded-ecg.blogspot.com/search/label/digoxin

Monday, August 23, 2021

Crushing Chest pain, Tachycardia, and Very Elevated Blood Pressure in a 40-something Man.

A 40-something male called 911 for 2 hours of crushing, non-radiating, chest pain at about 11 AM.   He reported a similar episode last year when his blood pressure was very out of control and that again he has not taken his BP meds for 2 months.  He stated he had drunk 12 cans of Mountain Dew (high caffeine content) overnight. 

On exam, he was very anxious,  holding his chest, breathing normally.  Chest pain was worse with palpation.  

His BP was 250/150 with a heart rate of 150.

Here are 2 prehospital ECGs, 6 minutes apart:


Heart rate 156.  ST Elevation. Large T-waves

The computer read both ECGs as "Early Repolarization"  

What do you think?


There is definitely anterior ST Elevation.  

There is also STE in I and aVL, with reciprocal STD in inferior leads.  

There is also extreme tachycardia and elevated BP.  

Tachycardia can exacerbate pre-existing normal ST Elevation.  Moreover, both tachycardia and hypertension can result in demand ischemia.  Tachycardia is not seen in ACS unless there is a severe complication such as cardiogenic shock.  Therefore, if there is ACS here, there is also another underlying pathology contributing to tachycardia and elevated BP (toxic, volume depletion, and more).  The combination of untreated hypertension, anxiety, and caffeine could be the source of all this.

Exception!!!  The STE in I and aVL, with inferior reciprocal ST depression, should not be present due to tachycardia!!  Because of this, I think this ECG is all but diagnostic of OMI. 

Management?  I would first want to find the etiology of the tachycardia and hypertension, correct it with supportive care to normalize BP and heart rate, and then record another ECG.  But I would not waste any time.

The patient received aspirin, sublingual NTG, fluids, and reassurance.  The patient became much less anxious.

On arrival in the ED, the BP was 164/105 with a pulse of 113.  He was not placed in a critical care area or made high priority, as there were dozens of very ill patients present in the ED.  

An ECG was ordered.  Due to severe overcrowding, the ECG was not recorded for 57 minutes.  

Here it is:

QTc is 418.  The computer called non-specific changes
What do you think? 


This was immediately recognized by our very astute emergency physicians as diagnostic of LAD occlusion.  There is minimal ST Elevation in I, aVL V2, V3, V4, with hyperacute T-waves in V2-V4 and some inferior ST depression.

The cath lab was activated.

If you don't immediately recognize this as anterior (LAD) OMI, you can use the 4-variable formula or the simplified formula, both explained in detail at this post

The 4-variable formula value is (using 418 for QTc, 3.0mm for STE60V3, 11.5mm for RAV4, and 11.5mm for QRSV2) = 20.10, which is diagnostic of LAD occlusion.  The most accurate cutpoint is 18.2, but any value over 19.0 is very specific for LAD occlusion.

Initial hs troponin I (which returned much later) was 141 ng/L.  This value by itself does not help to distinguish type 1 from type 2 MI, or even from non-MI acute or chronic myocardial injury, much less to diagnose OMI vs. NOMI.  In a U.S. population, taking all patients with an initial value over 200 ng/L (which includes many with much higher troponins) the PPV for any MI (type 1 or 2 MI, but not for OMI) was about 70% and for type 1 MI was about 50%.  Thus, the PPV at 200 ng/L is less than 50% for type 1 MI and even less for OMI.

16 minutes later, before leaving for the cath lab, this was recorded:

Evolution of hyperacute T-waves, making it more obvious, but still not meeting STEMI criteria.

And another 16 minutes later:

This is the first ECG that was called STEMI by the computer algorithm (because it was the first STEMI! Because STEMI is defined by mm of ST Elevation!)  All previous ECGs were OMI without STEMI [STEMI (-) OMI].
On this ECG, you see what appears to be evidence of inferior injury as well.  However, as Dr. Balasubramian pointed out, this is due to lead misplacement. 

Immediately after this ECG, the patient was transported to the cath lab.

Angiogram--Culprit for the acute anterior ST elevation MI is ruptured plaque/thrombotic occlusion of the proximal and mid LAD.  A stent was placed with subsequent TIMI III flow and with "good runoff" after wards (a very good sign that there is good microvascular reperfusion).

Formal Echocardiogram--Normal left ventricular size, normal wall thickness and moderate systolic dysfunction.  The estimated left ventricular ejection fraction is 38%.

Regional wall motion abnormality

--mid and apical segment of the septum, anterior, anterolateral and apex akinetic and large.

--Regional wall motion abnormality-apical inferior wall, dyskinetic.  This confirms the inferior OMI.


Here is a 36 hour ECG

Evidence of significant amount of infarction (barely any R-wave left in V2 and V3)

Reperfusion T-waves (look exactly the same as Wellens' waves because Wellens waves ARE reperfusion T-waves.


Learning Points:

1. Normal ST Elevation can be exaggerated by tachycardia.

2. Stabilize vital signs and record another ECG if the diagnosis is unclear

3. STE from OMI can be mistaken as Normal ST Elevation 

4. Recognize hyperacute T-waves

5.  Use the 4-variable formula if needed


Thursday, August 19, 2021

A 60 year old man with chest pain -- many fascinating aspects to this ECG

Written and submitted by Lucas Goss MD, peer reviewed by Smith, Meyers, Bracey


A 60-year old man with history of CAD and prior stents to the LAD and ramus presented with acute chest tightness and shortness of breath. He arrives to the ED at about 1 hour and 15 minutes after onset of pain, and his triage ECG is shown below:

ECG#1 (no baseline available for comparison):

What do you think?


Sinus rhythm with PVC

No evidence of hyperkalemia

QT within normal limits

Negative P-wave in V2, so at least V1 and V2 are placed too high

STE in V2-V5, as well as lead II, III, aVF

Terminal QRS distortion (TQRSD) in V3 and perhaps almost also V4 

---TQRSD means absence of BOTH S-wave and J-wave in EITHER of leads V2 or V3 -- this is never seen in normal ST Elevation -- see this article: Terminal QRS distortion is present in anterior myocardial infarction but absent in early repolarization

Evidence of OMI in the PVC!

--------For this PVC, there is inappropriate isoelectric ST segment in V3 (since the PVC is of RBBB morphology there should be discordant STD from the R' wave, usually with TWI, but here we have an isoelectric ST segment and upright T wave). Moreover, V2 is nearly isoelectric, and the ST segment is upsloping and convex ("coved" ST segment), which is highly suggestive of LAD OMI. In addition, the T-wave is biphasic, down-up. A normal ST-T following the R'-wave in RBBB would be negative and downsloping with a fully negative T wave. 

Q waves which are too wide to be normal (in this context, considered pathologic until proven otherwise) in II, III, aVF, V4-6

Likely hyperacute T waves in V2-V4 and inferior leads, if compared to prior


Dr. Goss sent this ECG to me (Meyers) without any information, and I responded that I was worried about possible anterior and inferior OMI findings, worrisome for LAD OMI, but I was not quite ready to call it diagnostic. I recommended looking for a prior, getting the history, and serial ECGs. I later sent it to Dr. Smith with no information, and he instantly responded, "Terminal QRS distortion in V3, looks like LAD occlusion." Dr. Smith needed no extra information in this case.


At this point, no definite signs of OMI were appreciated by the treating physician, but the story was concerning enough to trigger serial ECGs.


ECG#2 (15 minutes later):

Obviously there is progression of hyperacute T wave and STE, but also there is a change in the QRS pattern in the anterior leads which makes me think there was probably a change in the electrode positions between the first and second ECGs. In fact, the P-wave in lead V2 is no longer fully negative, so it is placed lower on the chest. In this ECG, there is no lead with terminal QRS distortion, because V1-V6 all have an S wave. Subtle reciprocal depression is now present in aVL.


In this ECG you can now see clear and obvious hyperacute T waves in the anterior leads with approximately 1mm of STE that does not meet STEMI criteria in 2 consecutive leads. This ECG was interpreted as "subtle ST elevation in V4-V6 without reciprocal changes."


Initial high sensitivity cardiac troponin I was 129 ng/L (99% URL for men for this assays is 20 ng/L).  


Smith note: In the only U.S. study to look at it, the positive predictive value of an initial troponin at 129 ng/L was about 55% for any MI and about 45% for type 1 MI. Many such elevated troponins are due to type II MI or non-AMI myocardial injury. This is why the clinical presentation and ECG are so important. 

Sandoval Y, Smith SW, Schulz K, Sexter A, Apple FS. Rapid identification of patients at high risk for acute myocardial infarction using a single high-sensitivity cardiac troponin I measurement. Cin Chem 2020; 66:620-2.


A third repeat ECG was obtained 30 minutes later, ECG#3:


A code STEMI was called after this ECG. 

At this point, the ECG shows obvious STEMI(+) OMI. The patient was emergently transferred to a hospital with PCI capabilities. Cardiac catheterization was performed approximately 3.5 hours after initial symptoms. 


Catheterization Lab Findings:

LAD: 100% mid-thrombotic occlusion - stented

D1: Ostial 99% - stented

Ramus intermedius: 100% thromotic occlusion - stented


ECG after reperfusion: 

Significant loss of R waves with persistent STE, but also with some reperfusion as evidenced by the significant terminal T wave inversion in the LAD distribution. This likely indicates incomplete microvascular reperfusion ("no reflow phenomenon"). The presence of QS-waves portends complete transmural MI. If LVA develops (and this is quite likely), then T-waves may be inverted (or upright), but will not remain so deep. 


This patient went to the lab at only about 2 hours after onset of symptoms, with hyperacute T waves on the first few ED ECGs. There was not much delay, and it was electrocardiographically hyperacute before intervention. Hopefully this portends that this patient has a decent chance of recovery of the anterior wall and apex (stunning vs. infarction), but based on the ECG, troponins, and explanation below, it seems unlikely.

Echo one day after catheterization: "EF 31%. Akinesis of the apical LV segments and mid-septum (LAD distribution)."

Multiple repeat troponins were greater than 25,000 ng/L (our lab's upper limit of reporting).  


Smith: These very high troponins further support a very large MI and portend a poor prognosis in spite of rapid therapy.  It is consistent with the persistently high ST segments after reperfusion.  Both these findings together suggest some element of "No Reflow" due to microvascular obstruction with platelet-fibrin aggregates.  ST resolution is the best indicator of microvascular reperfusion, and can also be measured by TIMI myocardial perfusion grading on the angiogram.

See this post: 

Poor Microvascular Reperfusion ("No Reflow"): Best Diagnosed by ECG


ECG progression (lead 4):

This is a very nice demonstration of the main concepts of the OMI progression. Hyperacute T waves inflate with area under the curve as the R wave diminishes, with rising ST segments, development of small Q waves which grow bigger as the R wave diminishes, then total QS waves with persistent STE.


Learning Points

Frequent repeat ECGs are extremely important for the detection of OMI, especially with a concerning story. Within 15 minutes this patient's ECG demonstrated clear and obvious evidence of evolving OMI. This was particularly important in this case, as early detection was essential to ensure prompt transfer to PCI.

Terminal QRS distortion occurs when the enlarging T wave and rising ST segment obliterates the end of the QRS complex, characterized by lack of BOTH 1) an S-wave and 2) a J-wave. When this finding is in V2-3 of a normal QRS complex, it has been shown to have high specificity for OMI.

Do not rely on the ECG becoming such an obvious STEMI(+) OMI as it did in this case. Many patients with OMI will not manifest STEMI criteria, and even when they do, experts can recognize the life-saving need for reperfusion much earlier than STEMI criteria. In this case, Dr. Smith recognized OMI about 30 minutes earlier than STEMI criteria. It is conceivable that reducing the time of identification of OMI to reperfusion in cath lab will improve morbidity or mortality in a common, deadly condition. 

PVCs should be inspected for signs of ischemia and can provide additional evidence of OMI in borderline cases (such as this one).


Monday, August 16, 2021

A 52 year old female with chest pain

Written by Pendell Meyers, edits by Steve Smith


A 52 year old female with history of hypothyroidism and smoking presented to the ED with an episode of chest pain that began suddenly around 1500 while sitting down at work. She states it felt like a central chest pressure that radiated to her jaw. The pain had been persistently present since since 1500 (seen at 1615 in the ED), but had waxed and waned in severity, with the initial onset of pain being the worst. She had dyspnea and diaphoresis when the pain began. Coworkers called EMS who administered aspirin and NTG, which the patient says did not relieve her pain. During initial exam, she reports that her dyspnea had improved, but she had new nausea and vomiting x2 while in triage. 


Here is her triage ECG at 1615:

What do you think?


Smith comment (blinded to all information): This ECG, even without an old one for comparison, is diagnostic of LAD occlusion. T-waves like this are NEVER normal and only caused by transmural ischemia.


Her baseline ECG was available on file:

Normal Baseline


This baseline normal ECG proves that that first ECG above shows hyperacute T waves in leads V3-6, as well as likely hyperacute T waves in II, III, and aVF when compared to baseline. These T waves are evidence of acute transmural injury in the anterolateral and likely apical LV walls, which would fit well with acute LAD OMI. There is also abnormal STE in V2-V4 which is minimal in amplitude and does not meet STEMI criteria. Please notice that an experienced electrocardiographer can diagnose these T waves in V3-V5 as definitively hyperacute without having the baseline ECG to compare to, but with the baseline in hand everyone can see that these T waves are truly hyperacute throughout the precordium and the inferior leads. 

According to the OMI progression of ECG findings, this is perhaps the earliest possible diagnosis of LAD OMI on ECG, with the maximal benefit to emergent reperfusion. 


The ECG was not recognized as OMI. The first high sensitivity troponin I returned at 1647 elevated at 124 ng/L (reference limit less than 12 ng/L for women, less than 20 ng/L for men).

A second troponin was ordered, which resulted at 1903 at 530 ng/L.

It seems that a repeat ECG was ordered due to the rising troponins, at 1911:


At this time, 3 hours after arrival, we now see resolution of hyperacute T waves, with V2 and aVL showing inverted T waves likely indicative of spontaneous (lucky) reperfusion.

However, it seems that the patient had ongoing chest pain at this time, because she was given 4mg morphine and 4mg ondansetron for ongoing chest pain at 1945.


Another ECG was performed at 2007:


At this time, the providers start to notice the T wave inversions in aVL. They performed a bedside echo which showed an anterior and apical wall motion abnormality.

A third troponin resulted at 2025 at 987 ng/L.


With ongoing pain, rising troponin, and wall motion abnormality, the providers rightfully consulted cardiology for the possibility of emergent angiogram despite lack of STEMI criteria. 

The cardiologist stated: "During my interview, patient is pain-free and resting comfortably after receiving morphine.  Troponin has subsequently risen to 530 followed by 987.  Patient remains pain-free fortunately."

This sentence seems to suggest that the cardiologist believes that morphine is a reasonable response to ongoing ischemic symptoms instead of reperfusion. This reflects the practice I have seen at many institutions, and cases I am sent from all over the world.

Despite documenting that the pain is all gone, the cardiologist immediately orders nitroglycerin paste at 2046. 

The fourth troponin results at 2142 at 1108 ng/L.

Enoxaparin ordered at 2149.

More nitroglycerin ordered at 2341. Who orders repeat doses of NTG at midnight on a regular medicine floor for patients who are asymptomatic? Despite national guidelines that require emergent angiogram for ongoing ACS, we have orders for ischemic symptoms without any documentation of whether or not the patient has ongoing pain.

The fifth troponin returns at 0105 at 1150 ng/L, and no more will be ordered.

Smith comment: A rising troponin does NOT necessarily mean that the artery remains occluded.  Infarction that was ongoing hours ago can result in rising troponin now.  Only the combination of BOTH 1) resolution of ECG findings (present here) AND 2) with resolution of symptoms (apparently absent here, as patient required morphine and nitroglycerin) can tell you that the ischemia is resolved.

The next morning at 0800, an ECG is recorded:

Findings consistent with LAD reperfusion.


And another at 0900:

Deepening of T-wave inversion.
This is the typical progression after reperfusion.


Catheterization was performed the next day 0935

"There is severe apical hypokinesis with EF estimated at 40%. The circumflex and RCA are within normal limits. There was a focal lesion in the midportion of the LAD after 2nd perforator which had the appearance of a likely coronary dissection. There was a significant apical LAD vessel beyond this area. There was a wall motion abnormality consistent with infarction in this distribution. 

It was elected to attempt intervention (stenting) on this area primarily due to the size of the vessel and the short area of the dissection. 

The LAD lesion was estimated at 80%. There was no pre-intervention TIMI flow listed. Post-intervention TIMI flow was 3.

During cardiac rehab clinic follow up 10 days later, the patient states in a questionnaire that she can walk around her house, do light work including washing dishes, but states that she is unable to walk a block on level ground, unable to climb a flight of stairs, unable to rake leaves, or participate in sports.

Here is her ECG at that visit:


Her long term outcome is unknown, but we know that NSTEMI patients with missed OMI have double the short term,1-year, and 2-year mortality according to data by Khan et al who metaanalyzed over 40,000 NSTEMI patients in RCTs. And that's just their MORTALITY, not to mention their long term decreased quality of life, CHF, etc.

Luckily for this patient, however, she appears to have reperfused after a few hours of occlusion, and the ECG does not show progression to full thickness infarct (there is preservation of R waves, and reperfusion T waves). Hopefully her EF and cardiac function will improve.


Here is the OMI progression with a yellow arrow showing the course that this patient's ECGs followed in this case:


Learning Points:

Hyperacute T waves can be learned and recognized. They are symmetric, fat, broad based, encroaching on the QRS, resulting in large area under the curve of the ST segment and T wave compared to baseline.

Learn the OMI progression.

Missed or delayed care for OMI carries a much worse prognosis. Luckily for this patient she spontaneously reperfused in the early stages of missed OMI.

I hear many people say that coronary dissections do not receive PCI. This is a false and dangerous assumption. You cannot know until angiogram whether it will be suitable for PCI, and type I ACS (plaque rupture and thrombosis) is vastly more common as a cause of OMI.


Friday, August 13, 2021

A 60-something male presents with crushing chest pain

 I was reading ECGs on the system and saw this one:

What do you think?


I recognized this immediately as a variant due to some combination of Benign T-wave Inversion, Early repolarization, or LVH.  

1. There is ST Elevation in V2-V5

2. There is very high R-wave voltage in V4-V6

3. The leads with STE and T-wave inversion have very distinct J-waves.

4. The T-wave inversion is in leads V3-V6 (in contrast to Wellens', in which they are V2-V4)

5. There is high S-wave voltage in V2, with proportional ST elevation (consistent with LVH)

6. The T-wave inversion in leads V4-V6 is preceded by minimal S-waves, or J-waves only


I was curious to see how the case presented, and it was managed by the treating physicians.  So I looked into it.  Here is the case:

This 60-something male presents with crushing left sided 10/10 chest pain.

The cath lab was activated.

Would you activate the cath lab?  I certainly would not blame you if you did.

But if you read this blog regularly, you too might recognize that this ECG is very likely to represent non-ischemic ST elevation and do a bit more digging into the chart.

Had you done more digging, you would have found that this patient frequently presents with chest pain, sometimes associated with cocaine use, and frequently also has elevated troponins (in the range of 80-100 ng/L, normal is less than 34 ng/L) and has multiple similar ECGs.

He had even had a negative angiogram just one month prior.

Here are 2 other ECGs within the last 6 weeks (both were initial ECGs on an ED presentation for chest pain):

5 weeks ago, with chest pain.


6 weeks ago, with chest pain:


Here is an echo from 10 days prior:

Normal left ventricular size, systolic function, and wall motion. The estimated left ventricular ejection fraction is 61%.

Left ventricular hypertrophy concentric moderate.

ECGs

All ECGs without chest pain had the very similar morphology.

Outcome

The angiogram was negative, just as it was one month prior.

Trops were 65, 74, 53, and 60.  (the patient has chronic myocardial injury, probably from LVH)


Learning Points:

1. MEMORIZE this morphology.

2. Patients with cocaine chest pain are not necessarily having any myocardial ischemia or vasospasm, though they might have it.

3. Patients with cocaine chest pain frequently have abnormal ECGs with non-ischemic ST Elevation.  Look for old ones and previous workups.


You can see more cases of "Benign T wave inversion" here: 

https://hqmeded-ecg.blogspot.com/search/label/Benign%20T-wave%20Inversion

Here is another case showing the combination of Benign T-wave Inversion and LVH:

This was a baseline ECG, not due to OMI


BTWI is a normal variant associated with early repolarization.  K. Wang studied it a while back.  He reviewed ECGs from all 11,424 patients who had at least one recorded during 2007 at Hennepin County Medical Center (where I work) and set aside the 101 cases of benign T-wave inversion.  97 were black.  3.7% of black men and  1% of black women had this finding.  1 of 5099 white patients had it.  Aside from an 8.8% incidence (9 of 109) black males aged 17-19, it was evenly distributed by age group.

I have reviewed these 101 ECGs, and what strikes me is:

1. There is a relatively short QT interval (QTc < 425ms)  
2. The leads with T-wave inversion often have very distinct J-waves.
3. The T-wave inversion is usually in leads V3-V6 (in contrast to Wellens' syndrome, in which they are V2-V4)
4. The T-wave inversion does not evolve and is generally stable over time (in contrast to Wellens', which always evolves). 
5. The leads with T-wave inversion (left precordial) usually have some ST elevation 
6. Right precordial leads often have ST elevation typical of classic early repolarization
7. The T-wave inversion in leads V4-V6 is preceded by minimal S-waves
8. The T-wave inversion in leads V4-V6 is preceded by high R-wave amplitude
9. II, III, and aVF also frequently have T-wave inversion. 


Tuesday, August 10, 2021

Why do we liberally record ECGs? And what do you think the angiogram showed?

A 40 something complained of 1 week of constipation and eructation after a "bad batch of enchiladas."  He stated all of this was causing abdominal pain, which he indicated was in the epigastrium.

On exam, he had Right Upper Quadrant tenderness.

A point of care right upper quadrant ultrasound showed + gallstones but no wall thickening or pericholecystic fluid.  No etiology of the pain was established, but a gastric acid related etiology was suspected.

The providers decided after a while that it would be advisable to record an ECG, just in case.  

Here it is:

This ECG was texted to me.  What do you think?  What was my answer?


I said that "This is Aslanger's pattern.  You'd better get an angiogram or at least a stat echo.  It looks like Occlusion MI (OMI)." See below for description of Aslanger's pattern.

There is single lead STE in III, with recipocal STD in aVL (inferior OMI).  There is STD in V3-V6 diagnostic of subendocardial ischemia.

The first troponin returned at 3000 ng/L.

Angiogram:

Severe 3 vessel Coronary artery disease involving the LAD

100% mid LCX occlusion.

Formal Echo:

Regional wall motion abnormality--very mild apical septal and apical anterior hypokinesis.

Regional wall motion abnormality--basal to mid inferior and mid inferolateral hypokinesis

Discussion:

This ECG is Aslanger's pattern, and the angiogram is exactly what you expect with this ECG pattern, including the inferior OMI attributed to circumflex (more often than RCA).

This pattern was recently published in J Electrocardiology: Aslanger and others (including Smith).  A new electrocardiographic pattern indicating inferior myocardial infarction.  https://pubmed.ncbi.nlm.nih.gov/32526537/

This newly recognized ECG pattern is defined as:

(1) any STE in III (with reciprocal STD in aVL), but not in other inferior leads, 

(2) STD in any of leads V4 to V6, (but not in V2) with a positive or terminally positive T-wave, 

(3) ST in lead V1 higher than ST in V2."  

The subendocardial ischemia, with an ST depression vector towards lead II, prevents ST elevation in II and aVF, leaving only lead III to manifest single lead ST Elevation.

Learning Points:

1. Upper abdominal pain may be due to acute MI.  If there is no definite diagnosis (and sometimes even if there is), and ECG and possibly also troponin should be ordered for upper abdominal pain.

2. Aslanger pattern, even if the STE is less than 1 mm (with reciprocal STD in aVL), is diagnostic of OMI in the right clinical situation.   This presentation has a low pretest probability, so obtaining an echo is wise, UNLESS the troponin comes back diagnostic, as in this case.


EKGs filed under "atypical symptoms"

Full echo results:

Decreased left ventricular systolic performance, moderate.

The estimated left ventricular ejection fraction is 35%.

Regional wall motion abnormality-distal septum and apex akinetic.

Regional wall motion abnormality-inferolateral, base.

Regional wall motion abnormality-basal inferior/inferior septum.

Normal right ventricular size with probable RV hypertrophy.

No evidence for left ventricular thrombus.